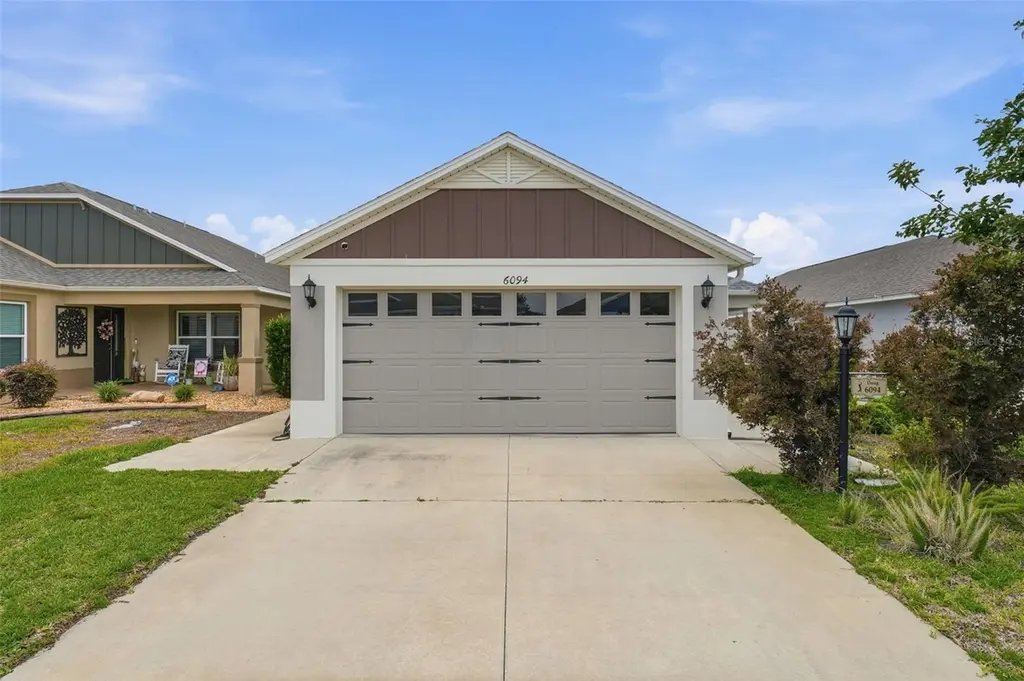
6094 Rodriguez Ln · Wildwood, FL
Flood risk 4/10 · Minor
- FEMA flood zone
- X (unshaded)
- Chance of flooding over 30 yrs
- 0.22%
- Est. flood insurance / yr
- $507 – $1,088
Fire risk 5/10 · Moderate
- Est. fire insurance / yr
- $947 – $1,759
Heat risk 9/10 · Severe
- Hot days now (above 108°F)
- 7 days/yr
- Hot days in 30 yrs
- 23 days/yr
Wind risk 10/10 · Severe
- Chance of severe wind over 30 yrs
- 99.0%
Air-quality risk 2/10 · Minimal
- Unhealthy air days now
- 1 days/yr
- Unhealthy air days in 30 yrs
- 2 days/yr
Risk factors via First Street. Map © Google.
Why this score? — see what drove the F grade
The composite is a weighted blend of 9 inputs, each scored 0–100. Each bar is that input's sub-score; the figure is the points it added to the 100-point composite (weight × sub-score).
- Appreciation +10.0/10.0
- Schools +5.2/10.0
- Cash flow +5.1/30.0
- Livability +3.5/5.0
- Rent growth +2.5/5.0
- Condition / age +2.5/5.0
- 1% rule +1.5/10.0
- ARV discount +0.7/15.0
- DSCR +0.0/10.0
$365,000
🖨 Deal sheet (PDF) 📄 Offer letter ✓ Due diligence
Listing remarks
Welcome to this beautifully maintained 2021 Durham Courtyard Villa in the Village of Citrus Grove. This move-in-ready home offers 2 bedrooms, 2 bathrooms, and a 2-car garage, with vaulted ceilings and an open-concept layout with luxury vinyl flooring throughout the main living areas. The kitchen is thoughtfully designed with a spacious pantry, breakfast bar, gas range, newer stainless-steel appliances, and soft-close cabinetry—perfect for both everyday living and entertaining. The combined living and dining area provides an inviting space for gatherings. The primary suite features a tray ceiling, walk-in closet, and a well-appointed en-suite bath with dual vanities, a linen closet, an
Key facts
- Spacious pantry
- Tray ceiling
- Soft-close cabinetry
Tags
Property features AI
Finance
- Other: No lease restrictions reported
- Financial info: CDD present; Homestead exempt
- HOA & community: Association: The Villages; Monthly association fee approximately $204 (total monthly fees); Annual association fees approximately $2,448; Community features include community mailbox, deed restrictions, golf carts allowed, and tennis courts; Senior community; Pets allowed
Exterior
- Parking: Attached garage; 2-car garage
- Utilities: Public sewer; Water connected; Natural gas connected; Electricity available; Cable available
- Home design: Villa (residential); One story; Northeast-facing
- Construction: Stucco construction; Shingle roof; Slab foundation; Built as a single-level home
- Exterior features: Paved road access; Irrigation equipment; Community pool (association amenity)
Interior
- Kitchen: Dishwasher; Microwave; Range; Refrigerator
- Bedrooms: 2 bedrooms
- Flooring: Carpet; Ceramic tile
- Bathrooms: 2 full bathrooms
- Heating & cooling: Central heating; Central air conditioning
- Interior features: Ceiling fans; Open floorplan; Vaulted ceilings
- Laundry & utility: Laundry room; Dryer
Neighborhood map
What this means for you Summary
Snapshot
- This is a 2-bed/2.0-bath single-family listed at $365k.
Deal economics
- At list price, monthly cash flow is $-837 ($-10k/yr) — negative.
- To cash-flow at today's rent, offer at most $217k (40.5% below list).
- To meet the 1% rule (rent ≥ 1% of price), the offer needs to be $237k (35.0% below list).
- Recommended offer: $217k (40.5% below list) — sets the bar for cash-flow.
Location & tenants
- Location reads 69/100 on livability (#471 in FL) — a middle-class / working-renter tenant base. Strengths: health & safety A+, cost of living A, crime A-; Watch: amenities F, commute F, employment D-.
- Sumter (rural): math 61% / reading 61% proficiency, ranked #11 of 73 in FL (top 15%) — acceptable for families but not a draw, mixed tenant base, ~2y average lease.
- Zoned schools: Wildwood Elementary School (math 49% / reading 52%, grade D+, #1,055 of 2,144 statewide, top 50%, 940 students, 76% FRL); South Sumter Middle School (math 55% / reading 54%, grade B-, #183 of 571 statewide, top 34%, 897 students, 61% FRL) — zoned schools average 68% FRL vs 51% district-wide (18 pts higher); higher-poverty schools than district average — tighter screening recommended.
- Market conditions: 269 active listings in the ZIP; 5 comparable units currently listed for rent nearby; rentals at typical pace (median 23d on market — plan ~3-4 weeks tenant-placement turnaround); solid renter incomes; 3,961 units permitted in Sumter County in 2024 (248 in 5+ unit buildings).
Forward outlook
- In year one you build about $39k of equity ($3k loan paydown + $36k appreciation (10.0% local appreciation)).
- Sumter County population projected at +45% by 2050 — long-run rental-demand tailwind backs the buy-and-hold thesis.
- By year 2, paydown + projected appreciation supports a ~$63k cash-out refi (75% LTV) — recoverable capital for the next deal without selling this one.
Negotiation context
- It's been on market 51 days — a 3% lower offer ($354k) is reasonable based on typical stale-listing flexibility.
Risks & watch-outs
- Climate carrying-cost: severe wind risk, 99% chance of damaging wind over 30y; moderate wildfire risk; extreme-heat days projected 7→23/yr by 2055 (HVAC capex compounding) — expect insurance premiums to compound above CPI over the hold.
Questions for the listing agent
- What do current leases actually rent for vs. the listed asking? Can we see a recent rent roll and the last 12 months of T-12 income?
- It's been on market 51 days. Have you received any prior offers? Is the seller open to a 41% concession, seller financing, or rate buy-down credit?
- What does the HOA fee cover, when was the last increase, and are there any pending special assessments or reserve-fund shortfalls?
- Is there a deadline driving the sale (1031 exchange, divorce, estate, relocation)? That informs how much negotiation room exists.
- The area grade is low — what's the realistic commute time and amenity access for the typical tenant pool here? Any planned neighborhood developments (good or bad) we should know about?
- What's the average days-on-market for RENTAL listings here right now (not sales)? A rising rental-DOM trend means longer vacancies and softer asking-rent achievability than the comps imply.
- What's the recent tenant-quality profile in this submarket — average credit score on applications, eviction rate, late-payment / NSF rate, and stable-employment percentage? A property-management company in the area should have these aggregated.
- How much new for-sale + rental construction is in the pipeline within 1–3 miles? Heavy new supply typically softens prices + rents 12–24 months out; constrained supply supports both.
Investment metrics
- 1% rule
- 0.65% ✗
- Cap rate
- 3.54%
- Cash-on-cash
- -9.83%
- DSCR
- 0.56
- GRM
- 12.8
CMA / ARV
- ARV (on-the-fly)
- $317,340
- Comps found
- 12
Show comp detail 12 sales within ~0.75 mi
| Address | Dist | Beds/Ba | Sqft | Sold | Price | $/sf | Match |
|---|---|---|---|---|---|---|---|
| 6316 Danielson Loop | 0.26mi | 3/2.0 (+1) | 1,392 (+8%) | 1mo | $360,000 | $259 | 69 |
| 6084 Guy Ter | 0.27mi | 2/2.0 | 1,227 (-5%) | 13mo | $267,500 | $218 | 68 |
| 493 Kayla Ct | 0.28mi | 3/2.0 (+1) | 1,426 (+10%) | 0mo | $338,000 | $237 | 64 |
| 463 Kayla Ct | 0.33mi | 2/2.0 | 1,203 (-7%) | 13mo | $324,999 | $270 | 62 |
| 6370 Danielson Loop | 0.22mi | 3/2.0 (+1) | 1,459 (+13%) | 1mo | $395,000 | $271 | 62 |
| 6223 Atkinson Ln | 0.58mi | 2/2.0 | 1,203 (-7%) | 2mo | $297,500 | $247 | 60 |
| 320 Zingale Ln | 0.69mi | 2/2.0 | 1,262 (-2%) | 10mo | $325,000 | $258 | 56 |
| 6338 Flaxmayer Rd | 0.67mi | 3/2.0 (+1) | 1,361 (+6%) | 3mo | $335,000 | $246 | 52 |
| 6342 Whittle Ct | 0.64mi | 3/2.0 (+1) | 1,426 (+10%) | 1mo | $285,000 | $200 | 47 |
| 289 Zingale Ln | 0.72mi | 3/2.0 (+1) | 1,392 (+8%) | 5mo | $301,999 | $217 | 44 |
| 284 Pelchat Pl | 0.72mi | 3/2.0 (+1) | 1,361 (+6%) | 11mo | $319,000 | $234 | 42 |
| 6273 Windham Way | 0.73mi | 3/2.0 (+1) | 1,465 (+14%) | 3mo | $333,000 | $227 | 36 |
Match score weights: distance 35% · size 25% · config 20% · recency 20%. Top-matched comps best support the ARV.
Projected returns pro-forma
10.0% appreciation · 3.0% rent growth · sell at horizon
- IRR
- 17.4%
- Equity multiple
- 2.42×
- Total profit
- $145,630
- Equity at exit
- $328,821
- IRR
- 16.4%
- Equity multiple
- 5.61×
- Total profit
- $471,082
- Equity at exit
- $709,115
Cash invested: $102,200 (down + closing). Projections, not guarantees.
Landlord ↔ Tenant lean methodology
- Overall (STATE)
- 87 Strongly Landlord-Friendly
- State Florida
- 87 Strongly Landlord-Friendly · R+3
- County
- — inherits STATE
- City
- — inherits STATE
ZIP-level market 32163
- Home prices YoY
- 9.8%
- Active inventory
- 269
- Price-to-rent
- 12.8×
Monthly cashflow live
- Estimated rent
- $2,373 high interval (Pro) →
- Mortgage (P&I)
- −$1,914
- Tax from tax record
- −$441 /mo · $5,298/yr
- Insurance
- −$152
- HOA
- −$204
- Vacancy / Maint / Mgmt
- −$498
- Net cashflow
- $-837
Break-even live
Sensitivity live
| Price | -10% $-630 | -5% $-734 | +0% $-837 | +5% $-940 | +10% $-1,044 |
|---|---|---|---|---|---|
| Rent | -10% $-1,024 | -5% $-931 | +0% $-837 | +5% $-743 | +10% $-650 |
| Rate | -1.0pp $-653 | -0.5pp $-744 | base $-837 | +0.5pp $-932 | +1.0pp $-1,028 |
UW: 25.0% down · 7.5% · 30yr · 1.5% tax · 5.0% vac · 8.0% maint · 8.0% mgmt
Financing live
Cash to close
- Down payment
- $91,250
- Closing costs
- $10,950
- Reserves months
- —
- Total cash needed
- —
Loan-product check · same deal, 3 products live
Conventional
25% down · 7.5% · 30yr
- Down + closing
- —
- Monthly P&I
- —
- Monthly cashflow
- —
- DSCR
- —
- Eligible?
- —
Personal DTI + credit; lowest rate.
DSCR
20% down · 8.5% · 30yr
- Down + closing
- —
- Monthly P&I
- —
- Monthly cashflow
- —
- DSCR
- —
- Eligible?
- —
No personal income docs; deal must DSCR.
Hard money
10% down · 12.0% · 12mo
- Down + closing
- —
- Monthly P&I
- —
- Monthly cashflow
- —
- DSCR
- —
- Eligible?
- —
Short-term bridge; refi at stabilization.
Rent comps 5 comps
| Address | Beds | Baths | Sqft | Rent | $/sqft | DOM | Units | Dist |
|---|---|---|---|---|---|---|---|---|
| 6502 McKnight Loop Unit 1525259P The Villages, FL | 3.0 | 2.0 | 1442 | $1,711 | $1.19 | 0d | 1 | 0.94mi |
| 6551 Mason Pl Unit 1545857P The Villages, FL | 3.0 | 2.0 | 1593 | $4,056 | $2.55 | 18d | 1 | 1.26mi |
| 5806 Winn Way Unit 1525269P Wildwood, FL | 3.0 | 2.0 | 1550 | $1,770 | $1.14 | 22d | 1 | 1.29mi |
| 6743 Mary Loop The Villages, FL | 3.0 | 2.0 | 1392 | $2,500 | $1.80 | 25d | 1 | 1.31mi |
| 5541 Goodman Ct The Villages, FL | 2.0 | 2.0 | 1203 | $1,990 | $1.65 | 22d | 1 | 1.48mi |
HOA detail
- Monthly dues
- $204 · $2,448/yr
- Likely covers
- gas
Listing history 17 events
-
2026-06-22days on market $365,000 Active 51 DOM
-
2026-06-19days on market $365,000 Active 49 DOM
-
2026-06-18days on market $365,000 Active 48 DOM
-
2026-06-17days on market $365,000 Active 47 DOM
-
2026-06-16days on market $365,000 Active 46 DOM
-
2026-06-15days on market $365,000 Active 45 DOM
-
2026-06-14days on market $365,000 Active 43 DOM
-
2026-06-13days on market $365,000 Active 42 DOM
-
2026-06-10days on market $365,000 Active 40 DOM
-
2026-06-09days on market $365,000 Active 39 DOM
-
2026-06-08days on market $365,000 Active 38 DOM
-
2026-06-07days on market $365,000 Active 37 DOM
-
2026-06-02days on market $365,000 Active 32 DOM
-
2026-06-01days on market $365,000 Active 31 DOM
-
2026-05-31days on market $365,000 Active 30 DOM
-
2026-05-30days on market $365,000 Active 29 DOM
-
2026-05-01$365,000 Active
ⓘ Source: listings_history table (triggers on properties + properties_extension) + one-shot
backfill from property_details.listing_events for pre-trigger history.
Tax reassessment forecast FL · Resets to sale price
- Current annual tax
- $5,298 · $441/mo
- Projected year-2 tax
- $5,298 · $441/mo
- Expected delta
- $0/yr ($0/mo · 0.0%)
ⓘ Screening estimate from a state-policy table — verify with the county assessor before closing.
Climate risk First Street
- Flood 4/10 Moderate FEMA zone X (unshaded) · 22% chance over 30 yrs
- Wildfire 5/10 Major
- Heat 9/10 Extreme 7 d/yr ≥108°F today · 23 d/yr by 30 yrs out
- Wind 10/10 Extreme 99% chance of damaging wind over 30 yrs
- Air quality 2/10 Low 1 unhealthy d/yr today · 2 by 30 yrs out
Nearby sold comps map
Loading sold comps map…
Walkable amenities ~0.75 mi
Loading nearby amenities…
Taxation est. · year 1
- Rental income
- $28,475
- − Mortgage interest
- −$20,446
- − Property taxes
- −$5,298
- − Insurance
- −$1,825
- − Repairs & maintenance
- −$2,278
- − Management
- −$2,278
- − HOA
- −$2,448
- − Depreciation
- −$10,618
- Taxable loss
- −$16,715
- Est. tax savings @ 24.0%
- +$4,012
- After-tax cash flow
- $-6,033/yr
For passive investors: Depreciation is non-cash, so a rental often shows a tax loss while cash-flowing — sheltering income. Rental losses are passive: they offset passive income freely, and up to $25,000/yr can offset ordinary (W-2) income if you actively participate and your MAGI is under $100k (phasing out to $0 by $150k); unused losses carry forward. On sale, claimed depreciation is recaptured at up to 25%, and gains may owe capital-gains tax (a 1031 exchange can defer both). Figures are a year-1 estimate at your 24.0% rate — not tax advice; consult a CPA.
Schools (NCES district)
- District
- Sumter
- NCES district ID
- 1201800
- Math proficiency
- 61% ▼ -4.00%
- Reading proficiency
- 61% ▼ -2.00%
- Median HH income
- $48,240
- Composite
- 51.74/100
- National rank
- #1682
- State rank
- #11 of 73 in FL
Livability — Wildwood
- Score
- 69/100
- State rank
- #471
- US rank
- #8500
Category grades
Schools grade is shown separately in the Schools card above.
Census & demographics
- Census place
- Wildwood, FL
- County
- Sumter County · 110,591 people
- City population
- 21,568
- Metro
- The Villages, FL
- Population (ZIP)
- 28,549
- Household income
- $96,775
- Rent vs Own
- Severe rent burden
- 307.0
Population outlook (Sumter County) Hauer SSP2
- Today (2025)
- 161,172 people
- By 2030
- 180,083 · +11.7%
- By 2040
- 209,892 · +30.2%
- By 2050
- 234,186 · +45.3%
- By 2075
- 284,602 · +76.6%
- By 2100
- 317,039 · +96.7%
Race, ethnicity, and origin ACS 2023
- Neighborhood character
- Predominantly White (95%)
- Race & ethnicity
- White 95% Two or more races 2% Hispanic / Latino 2% Asian 1%
- Common ancestry
- Romanian 6% Lithuanian 3% Iranian 3%
- Foreign-born
- 6% · Canada, Vietnam
- Languages at home
- 96% English-only · Spanish 2% Vietnamese 1% Other Indo-European 0%
Political lean MEDSL · Sumter
- 2024 margin
- Solid R (+37.6) · D 30.9% · R 68.6%
- 2008→2024 swing
- -10.6pp toward R · 2008: -27.0pp · 2024: -37.6pp
- All cycles
- 2024: R+37.6 2020: R+36.1 2016: R+39.2 2012: R+34.9 2008: R+27.0
Not yet ingested
- Civics
- —
Market trends
- HPI YoY
- ▲ 20.47%
- Current HPI
- 229.0075
- Rent YoY
- —
- Metro
- The Villages, FL
- State GDP YoY
- ▲ 3.28%
- F500 in state
- 36
Industry mix (Fortune 500 HQ in FL)
| Industry | F500 HQs | Revenue |
|---|---|---|
| Industrial Technology | 2 | $29B |
|
||
| Insurance | 2 | $17B |
|
||
| Retail | 1 | $60B |
|
||
| Technology Distribution | 1 | $58B |
|
||
| Homebuilding | 1 | $35B |
|
||
| Technology Manufacturing | 1 | $35B |
|
||
Price history
1 event — show timeline
- 2026-05-01 Listed $365,000 Stellar MLS as Distributed by MLS Grid
Property tax history
+28.8%/yrLatest (2025): $5,298 · -9.4% YoY. Source: county tax records.
Cash-flow waterfall
monthlySold comps — $/sqft
last 12 mo · ≤1 miLoading sold comps…