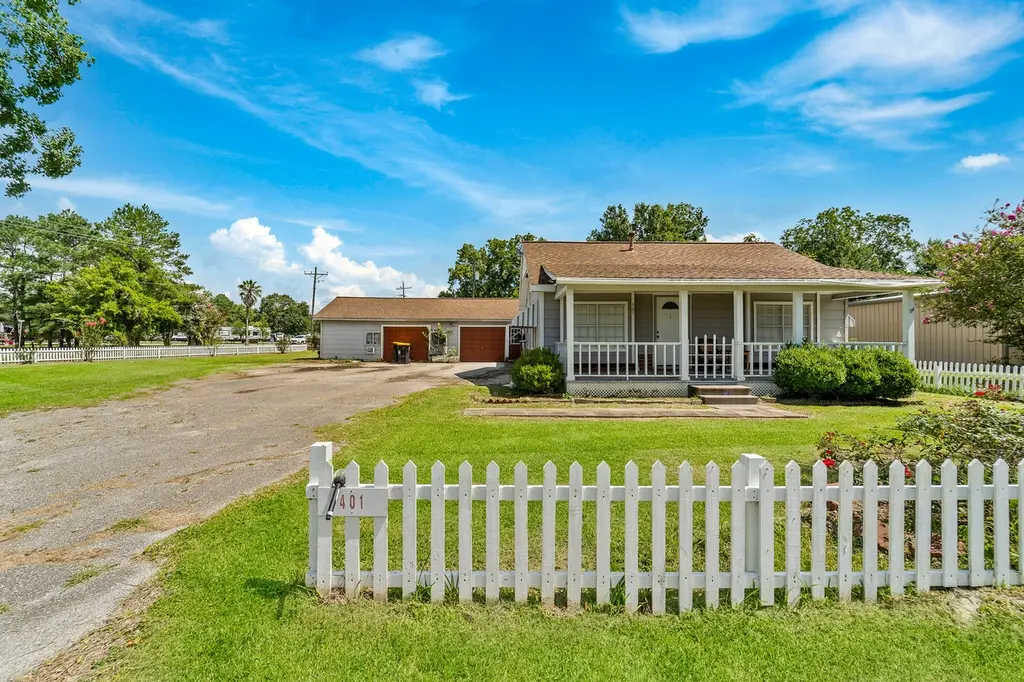
401 Lee Ave · Anahuac, TX
Flood risk 5/10 · Moderate
- FEMA flood zone
- X (unshaded)
- Chance of flooding over 30 yrs
- 0.26%
- Est. flood insurance / yr
- $507 – $1,088
Fire risk 4/10 · Minor
- Est. fire insurance / yr
- $1,222 – $2,270
Heat risk 10/10 · Severe
- Hot days now (above 112°F)
- 7 days/yr
- Hot days in 30 yrs
- 26 days/yr
Wind risk 9/10 · Severe
- Chance of severe wind over 30 yrs
- 99.0%
Air-quality risk 2/10 · Minimal
- Unhealthy air days now
- 1 days/yr
- Unhealthy air days in 30 yrs
- 1 days/yr
Risk factors via First Street. Map © Google.
Why this score? — see what drove the C grade
The composite is a weighted blend of 9 inputs, each scored 0–100. Each bar is that input's sub-score; the figure is the points it added to the 100-point composite (weight × sub-score).
- Cash flow +17.1/30.0
- ARV discount +15.0/15.0
- 1% rule +6.1/10.0
- DSCR +5.3/10.0
- Schools +3.5/10.0
- Livability +3.5/5.0
- Rent growth +2.5/5.0
- Condition / age +2.5/5.0
- Appreciation +0.0/10.0
$219,990
🖨 Deal sheet (PDF) 📄 Offer letter ✓ Due diligence
Key facts
- 0.49 acre lot
- 2 garage spots
- Built 1971
Property features AI
Finance
- Other: Seller disclosure available
Exterior
- Parking: Attached garage; 2-car garage
- Utilities: Public water; Public sewer
- Home design: Residential property; Single-story entry (all main rooms listed on first floor)
- Construction: Brick construction; Built in 1971; Composition roof; Slab foundation
- Exterior features: Located in a subdivision
Interior
- Kitchen: Dishwasher; Disposal; Microwave
- Bedrooms: Primary bedroom on the first floor (15 x 11); Bedroom on the first floor (10 x 10); Bedroom on the first floor (10 x 12); Bedroom on the first floor (11 x 8); Four total rooms
- Bathrooms: Three full bathrooms
- Heating & cooling: Central heating (gas); Central air conditioning (electric)
- Interior features: Dishwasher; Disposal; Microwave
Neighborhood map
What this means for you Summary
Snapshot
- This is a 4-bed/3.0-bath single-family listed at $220k.
Deal economics
- At list price, monthly cash flow is $152 ($2k/yr) — positive.
- The deal already cash-flows at list — no discount required.
- Meets the 1% rule at list price ($2k rent vs $220k).
- Recommended offer: $213k (3.0% below list) — sets the bar for market timing.
- Cap rate 7.1% vs local median 3.9% in Anahuac — top-decile yield for the area; either an underpriced asset or a hidden risk that comps aren't pricing in. Stress-test before assuming the spread holds.
Location & tenants
- Location reads 70/100 on livability (#365 in TX) — a middle-class / working-renter tenant base. Strengths: cost of living A+, housing A+, crime A; Watch: employment C-, amenities F, commute F.
- Anahuac ISD (rural): math 41% / reading 41% proficiency, ranked #373 of 826 in TX (top 45%) — families likely to look elsewhere, expect single-tenant / working-renter base with shorter leases.
- Zoned schools: Anahuac El (math 31% / reading 25%, grade F, #2,740 of 4,322 statewide, top 64%, 713 students, 64% FRL); Anahuac Middle (math 52% / reading 46%, grade C-, #378 of 1,662 statewide, top 23%, 326 students, 61% FRL); Anahuac H S (math 37% / reading 62%, grade D, #509 of 1,632 statewide, top 34%, 454 students, 58% FRL).
- Market conditions: 146 active listings in the ZIP; 629 units permitted in Chambers County in 2024 (0 in 5+ unit buildings).
Forward outlook
- Local home prices are declining (-3.0%/yr); year-one equity from $2k of loan paydown is wiped out by about $7k of value loss. Plan a longer hold.
- Chambers County population projected at +46% by 2050 — long-run rental-demand tailwind backs the buy-and-hold thesis.
Negotiation context
- It's been on market 56 days — a 3% lower offer ($213k) is reasonable based on typical stale-listing flexibility.
- 6 sale attempts since 9y ago with the ask held roughly flat each time — persistent listings suggest the price (not the market) is what's stuck; bring a comps-based counter.
Risks & watch-outs
- Watch-outs: property tax is 2.9% of price.
- Climate carrying-cost: moderate flood risk; severe wind risk, 99% chance of damaging wind over 30y; extreme-heat days projected 7→26/yr by 2055 (HVAC capex compounding) — expect insurance premiums to compound above CPI over the hold.
Questions for the listing agent
- It's been on market 56 days. Have you received any prior offers? Is the seller open to a 3% concession, seller financing, or rate buy-down credit?
- Built in 1971 — when were the roof, HVAC, electrical panel, plumbing, and water heater last replaced?
- Property tax is high relative to price — has the assessment been appealed recently, and will the sale trigger a re-assessment?
- Is there a deadline driving the sale (1031 exchange, divorce, estate, relocation)? That informs how much negotiation room exists.
- What's the average days-on-market for RENTAL listings here right now (not sales)? A rising rental-DOM trend means longer vacancies and softer asking-rent achievability than the comps imply.
- What's the recent tenant-quality profile in this submarket — average credit score on applications, eviction rate, late-payment / NSF rate, and stable-employment percentage? A property-management company in the area should have these aggregated.
- How much new for-sale + rental construction is in the pipeline within 1–3 miles? Heavy new supply typically softens prices + rents 12–24 months out; constrained supply supports both.
Investment metrics
- 1% rule
- 1.11% ✓
- Cap rate
- 7.12%
- Cash-on-cash
- 2.96%
- DSCR
- 1.13
- GRM
- 7.5
CMA / ARV
- ARV (median comp)
- $343,773
- List price
- $219,990
- Delta
- -36.01%
- Verdict
- UNDERPRICED
- Comps
- 20 within 1.0 mi
Show comp detail 8 sales within ~0.75 mi
| Address | Dist | Beds/Ba | Sqft | Sold | Price | $/sf | Match |
|---|---|---|---|---|---|---|---|
| 701 Lee Ave | 0.27mi | 4/3.0 | 1,800 (-14%) | 2mo | $225,000 | $125 | 62 |
| 1209 Kansas Ave S | 0.42mi | 3/2.0 (-1) | 2,000 (-5%) | 4mo | $390,000 | $195 | 60 |
| 1207 Kansas Ave | 0.43mi | 3/2.0 (-1) | 2,061 (-2%) | 18mo | $215,000 | $104 | 53 |
| 911 Oak St | 0.45mi | 4/3.0 | 2,308 (+10%) | 12mo | $540,000 | $234 | 52 |
| 1002 Ransom St | 0.54mi | 4/2.5 | 2,369 (+13%) | 1mo | $175,000 | $74 | 50 |
| 800 Trinity St | 0.73mi | 4/2.0 | 1,872 (-11%) | 1mo | $259,000 | $138 | 43 |
| 1005 Ransom St | 0.54mi | 3/2.0 (-1) | 2,213 (+6%) | 21mo | $335,000 | $151 | 39 |
| 805 Belton Ln Unit 1/2 | 0.65mi | 4/2.5 | 1,836 (-12%) | 13mo | $259,000 | $141 | 36 |
Match score weights: distance 35% · size 25% · config 20% · recency 20%. Top-matched comps best support the ARV.
Projected returns pro-forma
-3.0% appreciation · 3.0% rent growth · sell at horizon
- IRR
- -11.5%
- Equity multiple
- 0.58×
- Total profit
- $-25,771
- Equity at exit
- $32,801
- IRR
- -2.2%
- Equity multiple
- 0.85×
- Total profit
- $-9,195
- Equity at exit
- $19,021
Cash invested: $61,597 (down + closing). Projections, not guarantees.
Landlord ↔ Tenant lean methodology
- Overall (STATE)
- 87 Strongly Landlord-Friendly
- State Texas
- 87 Strongly Landlord-Friendly · R+5
- County
- — inherits STATE
- City
- — inherits STATE
ZIP-level market 77514
- Home prices YoY
- -23.3%
- Active inventory
- 146
- Price-to-rent
- 7.5×
Monthly cashflow live
- Estimated rent
- $2,434 medium interval (Pro) →
- Mortgage (P&I)
- −$1,154
- Tax from tax record
- −$525 /mo · $6,306/yr
- Insurance
- −$92
- HOA
- −$0
- Lot rent
- −$0
- Vacancy / Maint / Mgmt
- −$511
- Net cashflow
- $152
Break-even live
Sensitivity live
| Price | -10% $277 | -5% $214 | +0% $152 | +5% $90 | +10% $28 |
|---|---|---|---|---|---|
| Rent | -10% $-40 | -5% $56 | +0% $152 | +5% $248 | +10% $344 |
| Rate | -1.0pp $263 | -0.5pp $208 | base $152 | +0.5pp $95 | +1.0pp $37 |
UW: 25.0% down · 7.5% · 30yr · 1.5% tax · 5.0% vac · 8.0% maint · 8.0% mgmt
Financing live
Cash to close
- Down payment
- $54,998
- Closing costs
- $6,600
- Reserves months
- —
- Total cash needed
- —
Loan-product check · same deal, 3 products live
Conventional
25% down · 7.5% · 30yr
- Down + closing
- —
- Monthly P&I
- —
- Monthly cashflow
- —
- DSCR
- —
- Eligible?
- —
Personal DTI + credit; lowest rate.
DSCR
20% down · 8.5% · 30yr
- Down + closing
- —
- Monthly P&I
- —
- Monthly cashflow
- —
- DSCR
- —
- Eligible?
- —
No personal income docs; deal must DSCR.
Hard money
10% down · 12.0% · 12mo
- Down + closing
- —
- Monthly P&I
- —
- Monthly cashflow
- —
- DSCR
- —
- Eligible?
- —
Short-term bridge; refi at stabilization.
Listing history 38 events
-
2026-06-22days on market $219,990 Active 56 DOM
-
2026-06-21days on market $219,990 Active 55 DOM
-
2026-06-18days on market $219,990 Active 52 DOM
-
2026-06-17days on market $219,990 Active 51 DOM
-
2026-06-16days on market $219,990 Active 50 DOM
-
2026-06-15days on market $219,990 Active 49 DOM
-
2026-06-13days on market $219,990 Active 47 DOM
-
2026-06-09days on market $219,990 Active 43 DOM
-
2026-06-08days on market $219,990 Active 42 DOM
-
2026-06-07days on market $219,990 Active 41 DOM
-
2026-06-04days on market $219,990 Active 38 DOM
-
2026-06-03days on market $219,990 Active 37 DOM
-
2026-06-02days on market $219,990 Active 36 DOM
-
2026-06-01days on market $219,990 Active 35 DOM
-
2026-05-31days on market $219,990 Active 34 DOM
-
2026-04-27historical
-
2026-04-27$219,990 Active
-
2026-03-25price $224,990
-
2026-02-01status Active
-
2026-01-31historical
-
2026-01-17price $229,000
-
2025-11-19price $238,000
-
2025-07-15historical
-
2025-07-14$240,000 Active
-
2025-07-08price $243,000
-
2025-06-29price $245,000
-
2025-03-05price $265,900
-
2025-01-16$269,900 Active
-
2022-05-25soldstatus
-
2017-07-31soldstatus Sold
-
2017-07-16status Pending
-
2017-07-12status Option Pending
-
2017-06-19price $42,000
-
2017-06-13status Active
-
2017-06-11status Option Pending
-
2017-05-26$52,000 Active
-
2004-08-19soldstatus
-
2004-08-16soldstatus
ⓘ Source: listings_history table (triggers on properties + properties_extension) + one-shot
backfill from property_details.listing_events for pre-trigger history.
Tax reassessment forecast TX · Resets to sale price
- Current annual tax
- $6,306 · $525/mo
- Projected year-2 tax
- $6,306 · $525/mo
- Expected delta
- $0/yr ($0/mo · 0.0%)
ⓘ Screening estimate from a state-policy table — verify with the county assessor before closing.
Climate risk First Street
- Flood 5/10 Major FEMA zone X (unshaded) · 26% chance over 30 yrs
- Wildfire 4/10 Moderate
- Heat 10/10 Extreme 7 d/yr ≥112°F today · 26 d/yr by 30 yrs out
- Wind 9/10 Extreme 99% chance of damaging wind over 30 yrs
- Air quality 2/10 Low 1 unhealthy d/yr today · 1 by 30 yrs out
Nearby sold comps map
Loading sold comps map…
Walkable amenities ~0.75 mi
Loading nearby amenities…
Taxation est. · year 1
- Rental income
- $29,208
- − Mortgage interest
- −$12,323
- − Property taxes
- −$6,306
- − Insurance
- −$1,100
- − Repairs & maintenance
- −$2,337
- − Management
- −$2,337
- − Depreciation
- −$6,400
- Taxable loss
- −$1,593
- Est. tax savings @ 24.0%
- +$382
- After-tax cash flow
- $2,207/yr
For passive investors: Depreciation is non-cash, so a rental often shows a tax loss while cash-flowing — sheltering income. Rental losses are passive: they offset passive income freely, and up to $25,000/yr can offset ordinary (W-2) income if you actively participate and your MAGI is under $100k (phasing out to $0 by $150k); unused losses carry forward. On sale, claimed depreciation is recaptured at up to 25%, and gains may owe capital-gains tax (a 1031 exchange can defer both). Figures are a year-1 estimate at your 24.0% rate — not tax advice; consult a CPA.
Schools (NCES district)
- District
- Anahuac ISD
- NCES district ID
- 4808190
- Math proficiency
- 41% ▼ -22.00%
- Reading proficiency
- 41% ▼ -7.00%
- Median HH income
- $46,714
- Composite
- 35.02/100
- National rank
- #5043
- State rank
- #373 of 826 in TX
Livability — Anahuac
- Score
- 70/100
- State rank
- #365
- US rank
- #7791
Category grades
Schools grade is shown separately in the Schools card above.
Census & demographics
- Census place
- Anahuac, TX
- Population (ZIP)
- 5,213
Population outlook (Chambers County) Hauer SSP2
- Today (2025)
- 46,946 people
- By 2030
- 51,094 · +8.8%
- By 2040
- 59,578 · +26.9%
- By 2050
- 68,318 · +45.5%
- By 2075
- 90,485 · +92.7%
- By 2100
- 104,885 · +123.4%
Race, ethnicity, and origin ACS 2023
- Neighborhood character
- Diverse neighborhood (Simpson 0.61)
- Race & ethnicity
- White 55% Hispanic / Latino 29% Two or more races 13% Black 10% Asian 3%
- Hispanic origin (detail)
- Mexican 28%
- Common ancestry
- Lithuanian 4% Slovak 2% Scandinavian 1%
- Foreign-born
- 12% · Canada, Vietnam
- Languages at home
- 73% English-only · Spanish 23% Vietnamese 3%
Political lean MEDSL · Chambers
- 2024 margin
- Solid R (+65.6) · D 16.8% · R 82.4%
- 2008→2024 swing
- -14.4pp toward R · 2008: -51.2pp · 2024: -65.6pp
- All cycles
- 2024: R+65.6 2020: R+61.7 2016: R+62.1 2012: R+61.1 2008: R+51.2
Not yet ingested
- Civics
- —
Market trends
- HPI YoY
- ▼ -61.88%
- Current HPI
- 203.8454
- Rent YoY
- —
- Metro
- —
- State GDP YoY
- ▲ 3.95%
- F500 in state
- 110
Industry mix (Fortune 500 HQ in TX)
| Industry | F500 HQs | Revenue |
|---|---|---|
| Energy | 16 | $1,198B |
|
||
| Technology | 5 | $198B |
|
||
| Engineering / Construction | 4 | $72B |
|
||
| Energy Services | 3 | $60B |
|
||
| Utilities | 3 | $41B |
|
||
| Healthcare | 2 | $330B |
|
||
Price history
+323.1% since first listed23 events — show timeline
- 2026-04-27 Listed $219,990 HARMLS
- 2026-04-27 Listing Removed — HARMLS
- 2026-03-25 Price Changed $224,990 HARMLS
- 2026-02-01 Relisted — HARMLS
- 2026-01-31 Listing Removed — HARMLS
- 2026-01-17 Price Changed $229,000 HARMLS
- 2025-11-19 Price Changed $238,000 HARMLS
- 2025-07-15 Listing Removed — HARMLS
- 2025-07-14 Listed $240,000 HARMLS
- 2025-07-08 Price Changed $243,000 HARMLS
- 2025-06-29 Price Changed $245,000 HARMLS
- 2025-03-05 Price Changed $265,900 HARMLS
- 2025-01-16 Listed $269,900 HARMLS
- 2022-05-25 Sold (Public Records) — Public Records
- 2017-07-31 Sold (MLS) — HARMLS
- 2017-07-16 Pending — HARMLS
- 2017-07-12 Pending — HARMLS
- 2017-06-19 Price Changed $42,000 HARMLS
- 2017-06-13 Relisted — HARMLS
- 2017-06-11 Pending — HARMLS
- 2017-05-26 Listed $52,000 HARMLS
- 2004-08-19 Sold (Public Records) — Public Records
- 2004-08-16 Sold (Public Records) — Public Records
Property tax history
+4.6%/yrLatest (2025): $6,306 · +7.8% YoY. Source: county tax records.
Cash-flow waterfall
monthlySold comps — $/sqft
last 12 mo · ≤1 miLoading sold comps…