735 E Bowman St · South Bend, IN
Flood risk 1/10 · Minimal
- FEMA flood zone
- X (unshaded)
- Chance of flooding over 30 yrs
- 0.0%
- Est. flood insurance / yr
- $473 – $860
Fire risk 1/10 · Minimal
- Est. fire insurance / yr
- $717 – $1,331
Heat risk 2/10 · Minimal
- Hot days now (above 99°F)
- 7 days/yr
- Hot days in 30 yrs
- 15 days/yr
Wind risk 2/10 · Minimal
- Chance of severe wind over 30 yrs
- —
Air-quality risk 3/10 · Minor
- Unhealthy air days now
- 2 days/yr
- Unhealthy air days in 30 yrs
- 3 days/yr
Risk factors via First Street. Map © Google.
Why this score? — see what drove the C+ grade
The composite is a weighted blend of 9 inputs, each scored 0–100. Each bar is that input's sub-score; the figure is the points it added to the 100-point composite (weight × sub-score).
- Cash flow +27.8/30.0
- DSCR +9.8/10.0
- 1% rule +7.6/10.0
- ARV discount +4.7/15.0
- Rent growth +3.5/5.0
- Livability +3.2/5.0
- Condition / age +2.5/5.0
- Schools +1.4/10.0
- Appreciation +0.0/10.0
$90,000
🖨 Deal sheet (PDF) 📄 Offer letter ✓ Due diligence
Listing remarks
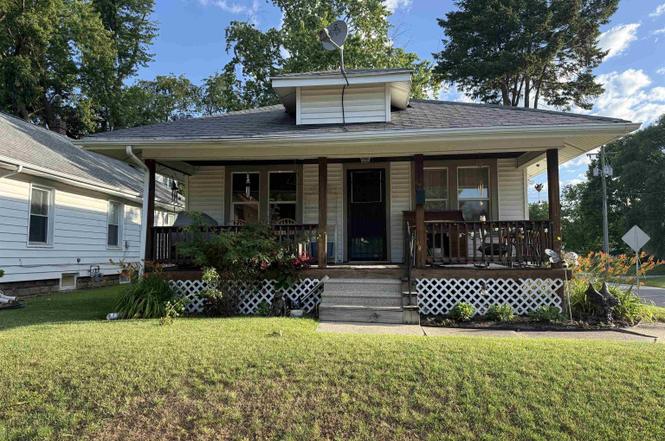
Well-maintained two-bedroom, one-bath home offering affordability, flexibility, and opportunity. Whether you're searching for a place to call home or looking to expand your investment portfolio, this property deserves a closer look. The home features a covered front porch, spacious living area, dedicated dining room, functional kitchen, and a convenient mudroom off the rear entrance. Additional highlights include a basement with laundry and ample storage space, along with a large rear parking area accessible from the alley. With its practical layout, manageable size, and attractive price point, this property offers a variety of possibilities for its next owner. Interior photos will be added
Key facts
- Covered front porch
- Functional kitchen
- Convenient mudroom
Tags
Property features AI
Exterior
- Utilities: Public water; Public sewer
- Home design: Single-family residence (site-built); One story
- Construction: Aluminum siding
- Exterior features: Corner lot; Sloped lot; Lot dimensions approximately 40 x 128
Interior
- Kitchen: No specific kitchen appliances listed
- Bedrooms: Total of 6 rooms (bedrooms included; specific bedroom counts not provided)
- Bathrooms: 2 full bathrooms, both on the main level
- Heating & cooling: Natural gas forced air heating; No central cooling
- Interior features: Gas water heater; Water heater (additional listing)
- Laundry & utility: Laundry located on the lower level
Neighborhood map
What this means for you Summary
Snapshot
- This is a 2-bed/1.5-bath single-family listed at $90k.
Deal economics
- At list price, monthly cash flow is $274 ($3k/yr) — positive.
- The deal already cash-flows at list — no discount required.
- Meets the 1% rule at list price ($1k rent vs $90k).
- Cap rate 9.9% vs local median 4.3% in South Bend — top-decile yield for the area; either an underpriced asset or a hidden risk that comps aren't pricing in. Stress-test before assuming the spread holds.
Location & tenants
- Location reads 64/100 on livability (#365 in IN) — a middle-class / working-renter tenant base. Strengths: cost of living A+, housing A+, health & safety A+; Watch: amenities D, employment D, crime F.
- South Bend Community School Corporation (urban): math 12% / reading 21% proficiency, ranked #284 of 301 in IN (top 94%) — low school quality limits family demand, transient renter base, plan for 1-2y turnover; 66% free/reduced lunch — lower-income household profile, screen leases tightly.
- Zoned schools: Lincoln Elementary School (math 7% / reading 6%, grade F, #964 of 994 statewide, top 97%, 467 students, 86% FRL); Jackson Middle School (math 3% / reading 8%, grade F, #326 of 330 statewide, top 99%, 528 students, 82% FRL); Riley High School (math 19% / reading 46%, grade F, #293 of 369 statewide, top 80%, 992 students, 67% FRL).
- Market conditions: Rents rising fast (+4.1%/yr); 78 active listings in the ZIP; 17 comparable units currently listed for rent nearby; rentals at typical pace (median 23d on market — plan ~3-4 weeks tenant-placement turnaround); 41% of comp listings sitting > 30 days — soft ceiling on asking rent; lower-income renter base — watch delinquency; 754 units permitted in St. Joseph County in 2024 (460 in 5+ unit buildings).
- This rent runs 32% of the median local income ($43k/yr) — at the standard rent-burdened threshold; future hikes will face affordability resistance.
Forward outlook
- Local home prices are declining (-3.0%/yr); year-one equity from $622 of loan paydown is wiped out by about $3k of value loss. Plan a longer hold.
- At projected returns (-3.0% appreciation + 4.1% rent growth), your $25k cash investment doubles in ~8 years — after that, you're playing with house money.
Negotiation context
- Only 5 days on market — expect competitive offers; lowballing is unlikely to land.
- Current owner paid $35k; list at $90k implies a 157% gain — meaningful room to come down on a strong offer.
Risks & watch-outs
- Watch-outs: built in 1923 — expect roof / HVAC / electrical / plumbing capex.
Questions for the listing agent
- Built in 1923 — when were the roof, HVAC, electrical panel, plumbing, and water heater last replaced?
- Is there a deadline driving the sale (1031 exchange, divorce, estate, relocation)? That informs how much negotiation room exists.
- Schools are F-rated, which usually means shorter tenancies and higher turnover. Who's the typical renter profile here, and what's been the actual vacancy rate?
- Crime grade is F in this area — have there been break-ins, vandalism, or insurance claims at this property in the last 3 years? What carrier currently insures it and at what premium?
- What's the average days-on-market for RENTAL listings here right now (not sales)? A rising rental-DOM trend means longer vacancies and softer asking-rent achievability than the comps imply.
- What's the recent tenant-quality profile in this submarket — average credit score on applications, eviction rate, late-payment / NSF rate, and stable-employment percentage? A property-management company in the area should have these aggregated.
- How much new for-sale + rental construction is in the pipeline within 1–3 miles? Heavy new supply typically softens prices + rents 12–24 months out; constrained supply supports both.
Investment metrics
- 1% rule
- 1.26% ✓
- Cap rate
- 9.94%
- Cash-on-cash
- 13.03%
- DSCR
- 1.58
- GRM
- 6.6
CMA / ARV
- ARV (on-the-fly)
- $84,672
- Comps found
- 12
Show comp detail 12 sales within ~0.75 mi
| Address | Dist | Beds/Ba | Sqft | Sold | Price | $/sf | Match |
|---|---|---|---|---|---|---|---|
| 804 E Calvert St | 0.05mi | 2/1.0 | 779 (-10%) | 1mo | $72,000 | $92 | 79 |
| 1140 E Dayton St | 0.35mi | 2/1.0 | 864 (0%) | 7mo | $119,000 | $138 | 76 |
| 1144 E Dayton St | 0.36mi | 3/1.0 (+1) | 864 (0%) | 1mo | $67,000 | $78 | 76 |
| 817 E Eckman St | 0.50mi | 2/1.0 | 880 (+2%) | 2mo | $130,000 | $148 | 70 |
| 1148 E Dayton St | 0.37mi | 2/1.0 | 936 (+8%) | 1mo | $67,000 | $72 | 66 |
| 1340 E Calvert St | 0.58mi | 2/1.0 | 888 (+3%) | 3mo | $65,500 | $74 | 64 |
| 128 Milton St | 0.47mi | 2/1.0 | 832 (-4%) | 11mo | $138,000 | $166 | 61 |
| 925 Altgeld St | 0.28mi | 2/1.0 | 960 (+11%) | 10mo | $120,000 | $125 | 58 |
| 1113 E Donald St | 0.27mi | 3/1.0 (+1) | 972 (+12%) | 5mo | $95,000 | $98 | 55 |
| 821 E Irvington Ave | 0.44mi | 2/1.0 | 752 (-13%) | 3mo | $109,500 | $146 | 54 |
| 312 E Donald St | 0.33mi | 2/1.0 | 748 (-13%) | 8mo | $25,000 | $33 | 53 |
| 1405 E Donald St | 0.61mi | 2/1.0 | 756 (-12%) | 2mo | $55,000 | $73 | 47 |
Match score weights: distance 35% · size 25% · config 20% · recency 20%. Top-matched comps best support the ARV.
Projected returns pro-forma
-3.0% appreciation · 4.08% rent growth · sell at horizon
- IRR
- 4.2%
- Equity multiple
- 1.16×
- Total profit
- $4,107
- Equity at exit
- $13,419
- IRR
- 14.7%
- Equity multiple
- 2.24×
- Total profit
- $31,328
- Equity at exit
- $7,782
Cash invested: $25,200 (down + closing). Projections, not guarantees.
Landlord ↔ Tenant lean methodology
- Overall (STATE)
- 90 Strongly Landlord-Friendly
- State Indiana
- 90 Strongly Landlord-Friendly · R+11
- County
- — inherits STATE
- City
- — inherits STATE
ZIP-level market 46613
- Home prices YoY
- -7.2%
- Rents YoY
- 4.1%
- Active inventory
- 78
- Price-to-rent
- 6.6×
Monthly cashflow live
- Estimated rent
- $1,137 high interval (Pro) →
- Mortgage (P&I)
- −$472
- Tax from tax record
- −$115 /mo · $1,386/yr
- Insurance
- −$38
- HOA
- −$0
- Vacancy / Maint / Mgmt
- −$239
- Net cashflow
- $274
Break-even live
Sensitivity live
| Price | -10% $324 | -5% $299 | +0% $274 | +5% $248 | +10% $223 |
|---|---|---|---|---|---|
| Rent | -10% $184 | -5% $229 | +0% $274 | +5% $318 | +10% $363 |
| Rate | -1.0pp $319 | -0.5pp $296 | base $274 | +0.5pp $250 | +1.0pp $227 |
UW: 25.0% down · 7.5% · 30yr · 1.5% tax · 5.0% vac · 8.0% maint · 8.0% mgmt
Financing live
Cash to close
- Down payment
- $22,500
- Closing costs
- $2,700
- Reserves months
- —
- Total cash needed
- —
Loan-product check · same deal, 3 products live
Conventional
25% down · 7.5% · 30yr
- Down + closing
- —
- Monthly P&I
- —
- Monthly cashflow
- —
- DSCR
- —
- Eligible?
- —
Personal DTI + credit; lowest rate.
DSCR
20% down · 8.5% · 30yr
- Down + closing
- —
- Monthly P&I
- —
- Monthly cashflow
- —
- DSCR
- —
- Eligible?
- —
No personal income docs; deal must DSCR.
Hard money
10% down · 12.0% · 12mo
- Down + closing
- —
- Monthly P&I
- —
- Monthly cashflow
- —
- DSCR
- —
- Eligible?
- —
Short-term bridge; refi at stabilization.
Rent comps 17 comps
| Address | Beds | Baths | Sqft | Rent | $/sqft | DOM | Units | Dist |
|---|---|---|---|---|---|---|---|---|
| 2114 High St South Bend, IN | 3.0 | 1.0 | 949 | $1,300 | $1.37 | 45d | 1 | 0.12mi |
| 1213 E Donald St South Bend, IN | 2.0 | 1.0 | 648 | $1,050 | $1.62 | 23d | 1 | 0.40mi |
| 1142 E Indiana Ave South Bend, IN | 1.0 | 1.0 | 751 | $599 | $0.80 | 15d | 1 | 0.43mi |
| 202 E Calvert St South Bend, IN | 2.0 | 1.0 | 1000 | $999 | $1.00 | 23d | 1 | 0.45mi |
| 237 E Victoria St South Bend, IN | 3.0 | 1.0 | 840 | $995 | $1.18 | 45d | 1 | 0.51mi |
| 214 Altgeld St South Bend, IN | 2.0 | 1.0 | 950 | $1,200 | $1.26 | 23d | 1 | 0.52mi |
| 1701 E Donald St South Bend, IN | 2.0 | 1.0 | 720 | $1,075 | $1.49 | 45d | 1 | 0.88mi |
| 922 Ridgedale Rd South Bend, IN | 2.0 | 1.0 | 864 | $1,200 | $1.39 | 15d | 1 | 0.93mi |
| 1729 E Calvert St South Bend, IN | 3.0 | 1.0 | 900 | $1,300 | $1.44 | 45d | 1 | 0.93mi |
| 1920 S Scott St South Bend, IN | 2.0 | 1.0 | 816 | $1,000 | $1.23 | 15d | 1 | 1.01mi |
| 2102 S Scott St South Bend, IN | 3.0 | 1.0 | 768 | $1,250 | $1.63 | 45d | 1 | 1.01mi |
| 604 E South St South Bend, IN | 1.0 | 1.0 | 750 | $825 | $1.10 | 45d | 1 | 1.08mi |
| 533 Columbia St Unit C South Bend, IN | 1.0 | 1.0 | 600 | $700 | $1.17 | 23d | 1 | 1.16mi |
| 2804 Delaware St Mishawaka, IN | 2.0 | 1.0 | 720 | $1,200 | $1.67 | 15d | 1 | 1.25mi |
| 1106 S 20th St South Bend, IN | 1.0–3.0 | 1.0–2.0 | 885 | $924 | $1.04 | 15d | 1 | 1.29mi |
| 4005 Addison St South Bend, IN | 3.0 | 1.0 | 900 | $1,250 | $1.39 | 45d | 1 | 1.44mi |
| 1009 E Jefferson Blvd South Bend, IN | 2.0 | 1.0 | 770 | $1,049 | $1.36 | 23d | 1 | 1.49mi |
Listing history 5 events
-
2026-06-22remarks 699-char remark
-
2026-06-22days on market $90,000 Active 5 DOM
-
2026-06-18days on market $90,000 Active 2 DOM
-
2026-06-16remarks 678-char remark
-
2026-06-16$90,000 Active 1 DOM
ⓘ Source: listings_history table (triggers on properties + properties_extension) + one-shot
backfill from property_details.listing_events for pre-trigger history.
Tax reassessment forecast IN · Partial reset (capped growth)
- Current annual tax
- $1,386 · $115/mo
- Projected year-2 tax
- $1,386 · $115/mo
- Expected delta
- $0/yr ($0/mo · 0.0%)
ⓘ Screening estimate from a state-policy table — verify with the county assessor before closing.
Climate risk First Street
- Flood 1/10 Low FEMA zone X (unshaded) · 0% chance over 30 yrs
- Wildfire 1/10 Low
- Heat 2/10 Low 7 d/yr ≥99°F today · 15 d/yr by 30 yrs out
- Wind 2/10 Low
- Air quality 3/10 Moderate 2 unhealthy d/yr today · 3 by 30 yrs out
Nearby sold comps map
Loading sold comps map…
Walkable amenities ~0.75 mi
Loading nearby amenities…
Taxation est. · year 1
- Rental income
- $13,648
- − Mortgage interest
- −$5,041
- − Property taxes
- −$1,386
- − Insurance
- −$450
- − Repairs & maintenance
- −$1,092
- − Management
- −$1,092
- − Depreciation
- −$2,618
- Taxable income
- $1,969
- Est. tax owed @ 24.0%
- −$473
- After-tax cash flow
- $2,810/yr
For passive investors: Depreciation is non-cash, so a rental often shows a tax loss while cash-flowing — sheltering income. Rental losses are passive: they offset passive income freely, and up to $25,000/yr can offset ordinary (W-2) income if you actively participate and your MAGI is under $100k (phasing out to $0 by $150k); unused losses carry forward. On sale, claimed depreciation is recaptured at up to 25%, and gains may owe capital-gains tax (a 1031 exchange can defer both). Figures are a year-1 estimate at your 24.0% rate — not tax advice; consult a CPA.
Schools (NCES district)
- District
- South Bend Community School Corporation
- NCES district ID
- 1810290
- Math proficiency
- 12% ▼ -10.00%
- Reading proficiency
- 21% ▼ -6.00%
- Median HH income
- $41,935
- Composite
- 14.21/100
- National rank
- #9452
- State rank
- #284 of 301 in IN
Livability — South Bend
- Score
- 64/100
- State rank
- #365
- US rank
- #13730
Category grades
Schools grade is shown separately in the Schools card above.
Census & demographics
- Census place
- South Bend, IN
- County
- Saint Joseph County · 189,048 people
- City population
- 99,767
- Metro
- South Bend-Mishawaka, IN-MI
- Population (ZIP)
- 12,279
- Household income
- $42,537
- Rent vs Own
- Severe rent burden
- 545.0
Population outlook (St. Joseph County) Hauer SSP2
- Today (2025)
- 273,186 people
- By 2030
- 273,594 · +0.1%
- By 2040
- 271,641 · -0.6%
- By 2050
- 269,187 · -1.5%
- By 2075
- 263,136 · -3.7%
- By 2100
- 245,659 · -10.1%
Race, ethnicity, and origin ACS 2023
- Neighborhood character
- Highly diverse neighborhood (Simpson 0.72)
- Race & ethnicity
- White 41% Hispanic / Latino 24% Black 23% Two or more races 22% Asian 2% Native American 1%
- Hispanic origin (detail)
- Mexican 22%
- Common ancestry
- Romanian 4% Italian 1% Slovak 1%
- Foreign-born
- 9% · Canada, Philippines
- Languages at home
- 81% English-only · Spanish 17% Other Asian/Pacific 1%
Political lean MEDSL · St. Joseph
- 2024 margin
- Toss-up / Even · D 50.0% · R 48.5% · Other 1.5%
- 2008→2024 swing
- -15.6pp toward R · 2008: 17.1pp · 2024: 1.5pp
- All cycles
- 2024: D+1.5 2020: D+5.8 2016: D+0.2 2012: D+3.5 2008: D+17.1
Not yet ingested
- Civics
- —
Market trends
- HPI YoY
- ▼ -20.88%
- Current HPI
- 270.0303
- Rent YoY
- ▲ 4.08%
- Metro
- South Bend-Mishawaka, IN-MI
- State GDP YoY
- ▲ 2.90%
- F500 in state
- 18
Industry mix (Fortune 500 HQ in IN)
| Industry | F500 HQs | Revenue |
|---|---|---|
| Industrial Machinery | 2 | $37B |
|
||
| Healthcare | 1 | $177B |
|
||
| Pharmaceuticals | 1 | $45B |
|
||
| Metals / Steel | 1 | $18B |
|
||
| Agriculture | 1 | $17B |
|
||
| Packaging | 1 | $12B |
|
||
Price history
+157.1% since first listed2 events — show timeline
- 2026-06-16 Listed $90,000 IRMLS
- 2011-02-22 Sold (Public Records) $35,000 Public Records
Property tax history
+13.2%/yrLatest (2025): $1,386 · -48.5% YoY. Source: county tax records.
Cash-flow waterfall
monthlySold comps — $/sqft
last 12 mo · ≤1 miLoading sold comps…