1910 SW 650 Rd · Holden, MO
Flood risk 1/10 · Minimal
- FEMA flood zone
- X (unshaded)
- Chance of flooding over 30 yrs
- 0.0%
- Est. flood insurance / yr
- $507 – $1,088
Fire risk 5/10 · Moderate
- Est. fire insurance / yr
- $1,054 – $1,958
Heat risk 4/10 · Minor
- Hot days now (above 108°F)
- 7 days/yr
- Hot days in 30 yrs
- 17 days/yr
Wind risk 2/10 · Minimal
- Chance of severe wind over 30 yrs
- 1.0%
Air-quality risk 2/10 · Minimal
- Unhealthy air days now
- 1 days/yr
- Unhealthy air days in 30 yrs
- 1 days/yr
Risk factors via First Street. Map © Google.
Why this score? — see what drove the D grade
The composite is a weighted blend of 9 inputs, each scored 0–100. Each bar is that input's sub-score; the figure is the points it added to the 100-point composite (weight × sub-score).
- Appreciation +10.0/10.0
- Cash flow +9.1/30.0
- ARV discount +7.5/15.0
- Livability +3.5/5.0
- Schools +3.2/10.0
- DSCR +2.5/10.0
- Rent growth +2.5/5.0
- Condition / age +2.5/5.0
- 1% rule +1.7/10.0
$127,500
🖨 Deal sheet 📄 Offer letter ✓ Due diligence
Listing remarks MLS
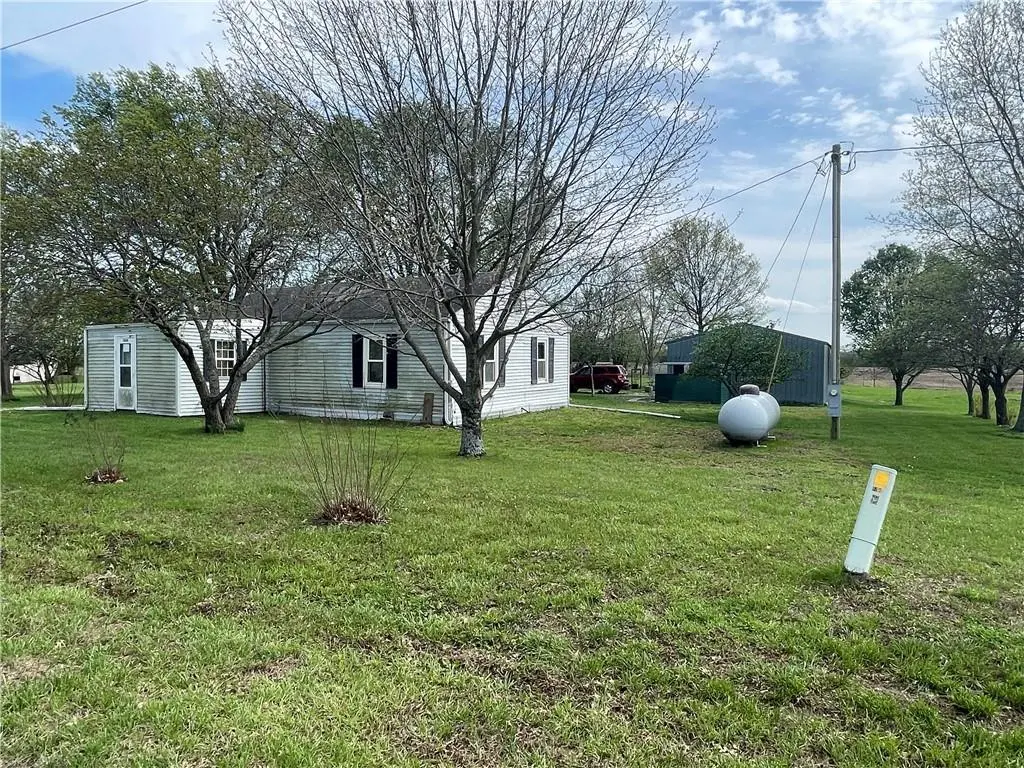
MULTIPLE OFFER SITUATION; HIGHEST AND BEST BY 5/12/26 AT 11:00AM. REMARKABLE FIND! 5 acre tract with a pond, fruit trees, septic system, electric, and a 24X40 metal outbuilding. Owners have not given any value to the 2 bedroom, 1 bath home with a covered back deck because it is not livable and needs to be tore down. Selling as-is. Pavers on the north side of the outbuilding, propane tank, and water tanks on the south side fo the outbuilding do not stay. This will go FAST!!!
Key facts
- 5 acre lot
- Built 1958
- Listed 5 days
Neighborhood map
What this means for you Summary
Snapshot
- This is a 2-bed/1.0-bath other listed at $128k.
Deal economics
- At list price, monthly cash flow is $-99 ($-1k/yr) — negative.
- To cash-flow at today's rent, offer at most $110k (13.7% below list).
- To meet the 1% rule (rent ≥ 1% of price), the offer needs to be $86k (32.7% below list).
- Recommended offer: $86k (32.7% below list) — sets the bar for 1% rule.
- Cap rate 5.4% vs local median 2.6% in Holden — top-decile yield for the area; either an underpriced asset or a hidden risk that comps aren't pricing in. Stress-test before assuming the spread holds.
Location & tenants
- Location reads 69/100 on livability (#167 in MO) — a middle-class / working-renter tenant base. Strengths: cost of living A+, housing A+, crime A-; Watch: employment D+, schools F, amenities F.
- Holden R-III (rural): math 33% / reading 41% proficiency, ranked #176 of 324 in MO (top 54%) — families likely to look elsewhere, expect single-tenant / working-renter base with shorter leases.
- Market conditions: 75 active listings in the ZIP; 80 units permitted in Johnson County in 2024 (27 in 5+ unit buildings).
Forward outlook
- In year one you build about $14k of equity ($882 loan paydown + $13k appreciation (10.0% local appreciation)).
- Johnson County population projected at +6% by 2050 — modest demand growth; plan on rents tracking national, not racing it.
- By year 3, paydown + projected appreciation supports a ~$35k cash-out refi (75% LTV) — recoverable capital for the next deal without selling this one.
Negotiation context
- Only 5 days on market — expect competitive offers; lowballing is unlikely to land.
- 2 sale attempts since 27y ago with the ask held roughly flat each time — persistent listings suggest the price (not the market) is what's stuck; bring a comps-based counter.
Risks & watch-outs
- Watch-outs: built in 1958 — expect roof / HVAC / electrical / plumbing capex.
- Climate carrying-cost: moderate wildfire risk — expect insurance premiums to compound above CPI over the hold.
Questions for the listing agent
- What do current leases actually rent for vs. the listed asking? Can we see a recent rent roll and the last 12 months of T-12 income?
- Built in 1958 — when were the roof, HVAC, electrical panel, plumbing, and water heater last replaced?
- Is there a deadline driving the sale (1031 exchange, divorce, estate, relocation)? That informs how much negotiation room exists.
- Schools are F-rated, which usually means shorter tenancies and higher turnover. Who's the typical renter profile here, and what's been the actual vacancy rate?
- The area grade is low — what's the realistic commute time and amenity access for the typical tenant pool here? Any planned neighborhood developments (good or bad) we should know about?
- What's the average days-on-market for RENTAL listings here right now (not sales)? A rising rental-DOM trend means longer vacancies and softer asking-rent achievability than the comps imply.
- What's the recent tenant-quality profile in this submarket — average credit score on applications, eviction rate, late-payment / NSF rate, and stable-employment percentage? A property-management company in the area should have these aggregated.
- How much new for-sale + rental construction is in the pipeline within 1–3 miles? Heavy new supply typically softens prices + rents 12–24 months out; constrained supply supports both.
Investment metrics
- 1% rule
- 0.67% ✗
- Cap rate
- 5.37%
- Cash-on-cash
- -3.31%
- DSCR
- 0.85
- GRM
- 12.4
CMA / ARV
No comps found within radius.
Projected returns pro-forma
10.0% appreciation · 3.0% rent growth · sell at horizon
- IRR
- 21.9%
- Equity multiple
- 2.77×
- Total profit
- $63,110
- Equity at exit
- $114,862
- IRR
- 19.7%
- Equity multiple
- 6.34×
- Total profit
- $190,685
- Equity at exit
- $247,704
Cash invested: $35,700 (down + closing). Projections, not guarantees.
Landlord ↔ Tenant lean methodology
- Overall (STATE)
- 81 Strongly Landlord-Friendly
- State Missouri
- 81 Strongly Landlord-Friendly · R+10
- County
- — inherits STATE
- City
- — inherits STATE
ZIP-level market 64040
- Home prices YoY
- 6.2%
- Active inventory
- 75
- Price-to-rent
- 12.4×
Monthly cashflow live
- Estimated rent
- $859 medium interval (Pro) →
- Mortgage (P&I)
- −$669
- Tax from tax record
- −$55 /mo · $661/yr
- Insurance
- −$53
- HOA
- −$0
- Vacancy / Maint / Mgmt
- −$180
- Net cashflow
- $-99
Break-even live
UW: 25.0% down · 7.5% · 30yr · 1.5% tax · 5.0% vac · 8.0% maint · 8.0% mgmt
Financing live
Cash to close
- Down payment
- $31,875
- Closing costs
- $3,825
- Reserves months
- —
- Total cash needed
- —
Loan-product check · same deal, 3 products live
Conventional
25% down · 7.5% · 30yr
- Down + closing
- —
- Monthly P&I
- —
- Monthly cashflow
- —
- DSCR
- —
- Eligible?
- —
Personal DTI + credit; lowest rate.
DSCR
20% down · 8.5% · 30yr
- Down + closing
- —
- Monthly P&I
- —
- Monthly cashflow
- —
- DSCR
- —
- Eligible?
- —
No personal income docs; deal must DSCR.
Hard money
10% down · 12.0% · 12mo
- Down + closing
- —
- Monthly P&I
- —
- Monthly cashflow
- —
- DSCR
- —
- Eligible?
- —
Short-term bridge; refi at stabilization.
Listing history 6 events
-
2026-05-14status Pending 479-char remark
Show marketing remark (479 chars)
MULTIPLE OFFER SITUATION; HIGHEST AND BEST BY 5/12/26 AT 11:00AM. REMARKABLE FIND! 5 acre tract with a pond, fruit trees, septic system, electric, and a 24X40 metal outbuilding. Owners have not given any value to the 2 bedroom, 1 bath home with a covered back deck because it is not livable and needs to be tore down. Selling as-is. Pavers on the north side of the outbuilding, propane tank, and water tanks on the south side fo the outbuilding do not stay. This will go FAST!!!
-
2026-05-10$127,500 Active 479-char remark
Show marketing remark (479 chars)
MULTIPLE OFFER SITUATION; HIGHEST AND BEST BY 5/12/26 AT 11:00AM. REMARKABLE FIND! 5 acre tract with a pond, fruit trees, septic system, electric, and a 24X40 metal outbuilding. Owners have not given any value to the 2 bedroom, 1 bath home with a covered back deck because it is not livable and needs to be tore down. Selling as-is. Pavers on the north side of the outbuilding, propane tank, and water tanks on the south side fo the outbuilding do not stay. This will go FAST!!!
-
2026-04-22historical $127,500 479-char remark
Show marketing remark (479 chars)
MULTIPLE OFFER SITUATION; HIGHEST AND BEST BY 5/12/26 AT 11:00AM. REMARKABLE FIND! 5 acre tract with a pond, fruit trees, septic system, electric, and a 24X40 metal outbuilding. Owners have not given any value to the 2 bedroom, 1 bath home with a covered back deck because it is not livable and needs to be tore down. Selling as-is. Pavers on the north side of the outbuilding, propane tank, and water tanks on the south side fo the outbuilding do not stay. This will go FAST!!!
-
1999-03-23soldstatus 262-char remark
Show marketing remark (262 chars)
Cute Farm Home. Detached 24x40 Garage With Concrete Floor, Electricity, Insulated, Galvanized & 30 Yr Warranty. 24x60 Machine Shed. Home Has Newer Siding, Deck, & Back Porch. Kingsville S. On T Hwy To Tt Then W On Tt To Rd 1871 South On 1871 To 650 Rd
-
1999-03-01soldstatus
-
1999-01-28$72,500 262-char remark
Show marketing remark (262 chars)
Cute Farm Home. Detached 24x40 Garage With Concrete Floor, Electricity, Insulated, Galvanized & 30 Yr Warranty. 24x60 Machine Shed. Home Has Newer Siding, Deck, & Back Porch. Kingsville S. On T Hwy To Tt Then W On Tt To Rd 1871 South On 1871 To 650 Rd
ⓘ Source: listings_history table (triggers on properties + properties_extension) + one-shot
backfill from property_details.listing_events for pre-trigger history.
Tax reassessment forecast MO · Resets to sale price
- Current annual tax
- $661 · $55/mo
- Projected year-2 tax
- $1,237 · $103/mo
- Expected delta
- +$576/yr (+$48/mo · 87.2%)
ⓘ Screening estimate from a state-policy table — verify with the county assessor before closing.
Climate risk First Street
- Flood 1/10 Low FEMA zone X (unshaded) · 0% chance over 30 yrs
- Wildfire 5/10 Major
- Heat 4/10 Moderate 7 d/yr ≥108°F today · 17 d/yr by 30 yrs out
- Wind 2/10 Low 100% chance of damaging wind over 30 yrs
- Air quality 2/10 Low 1 unhealthy d/yr today · 1 by 30 yrs out
Nearby sold comps map
Loading sold comps map…
Walkable amenities ~0.75 mi
Loading nearby amenities…
Taxation est. · year 1
- Rental income
- $10,302
- − Mortgage interest
- −$7,142
- − Property taxes
- −$661
- − Insurance
- −$638
- − Repairs & maintenance
- −$824
- − Management
- −$824
- − Depreciation
- −$3,709
- Taxable loss
- −$3,495
- Est. tax savings @ 24.0%
- +$839
- After-tax cash flow
- $-344/yr
For passive investors: Depreciation is non-cash, so a rental often shows a tax loss while cash-flowing — sheltering income. Rental losses are passive: they offset passive income freely, and up to $25,000/yr can offset ordinary (W-2) income if you actively participate and your MAGI is under $100k (phasing out to $0 by $150k); unused losses carry forward. On sale, claimed depreciation is recaptured at up to 25%, and gains may owe capital-gains tax (a 1031 exchange can defer both). Figures are a year-1 estimate at your 24.0% rate — not tax advice; consult a CPA.
Schools (NCES district)
- District
- Holden R-III
- NCES district ID
- 2914490
- Math proficiency
- 33% ▲ 2.00%
- Reading proficiency
- 41% ▲ 1.00%
- Median HH income
- $53,033
- Composite
- 32.27/100
- National rank
- #5759
- State rank
- #176 of 324 in MO
Livability — Holden
- Score
- 69/100
- State rank
- #167
- US rank
- #8986
Category grades
Schools grade is shown separately in the Schools card above.
Census & demographics
- City population
- 5,968
- Population (ZIP)
- 5,968
Population outlook (Johnson County) Hauer SSP2
- Today (2025)
- 55,794 people
- By 2030
- 56,861 · +1.9%
- By 2040
- 58,239 · +4.4%
- By 2050
- 59,168 · +6.0%
- By 2075
- 62,222 · +11.5%
- By 2100
- 60,118 · +7.7%
Race, ethnicity, and origin ACS 2023
- Neighborhood character
- Predominantly White (92%)
- Race & ethnicity
- White 92% Two or more races 6% Hispanic / Latino 4%
- Common ancestry
- Iranian 6% Italian 2% Portuguese 2%
- Foreign-born
- 2% · Canada
- Languages at home
- 96% English-only · Spanish 3%
Political lean MEDSL · Johnson
- 2024 margin
- Solid R (+39.6) · D 29.5% · R 69.1% · Other 1.4%
- 2008→2024 swing
- -27.3pp toward R · 2008: -12.2pp · 2024: -39.6pp
- All cycles
- 2024: R+39.6 2020: R+36.8 2016: R+36.9 2012: R+24.2 2008: R+12.2
Not yet ingested
- Civics
- —
Market trends
- HPI YoY
- ▲ 19.92%
- Current HPI
- 342.75
- Rent YoY
- —
- Metro
- —
- State GDP YoY
- ▲ 1.84%
- F500 in state
- 20
Industry mix (Fortune 500 HQ in MO)
| Industry | F500 HQs | Revenue |
|---|---|---|
| Healthcare | 1 | $163B |
|
||
| Insurance | 1 | $21B |
|
||
| Industrial Technology | 1 | $17B |
|
||
| Retail | 1 | $16B |
|
||
| Industrial Distribution | 1 | $10B |
|
||
| Utilities | 1 | $9B |
|
||
Price history
+75.9% since first listed6 events — show timeline
- 2026-05-14 Pending — Heartland MLS as Distributed by MLS Grid
- 2026-05-10 Listed $127,500 Heartland MLS as Distributed by MLS Grid
- 2026-04-22 Coming Soon $127,500 Heartland MLS as Distributed by MLS Grid
- 1999-03-23 Sold (MLS) — Heartland MLS as Distributed by MLS Grid
- 1999-03-01 Sold (Public Records) — Public Records
- 1999-01-28 Listed $72,500 Heartland MLS as Distributed by MLS Grid
Property tax history
+0.7%/yrLatest (2025): $661 · +2.0% YoY. Source: county tax records.
Cash-flow waterfall
monthlySold comps — $/sqft
last 12 mo · ≤1 miLoading sold comps…