8015 Oakway · O'Fallon, MO
Flood risk No data
- FEMA flood zone
- —
- Chance of flooding over 30 yrs
- —
- Est. flood insurance / yr
- —
Fire risk No data
- Est. fire insurance / yr
- —
Heat risk No data
- Hot days now (above threshold)
- —
- Hot days in 30 yrs
- —
Wind risk No data
- Chance of severe wind over 30 yrs
- —
Air-quality risk No data
- Unhealthy air days now
- —
- Unhealthy air days in 30 yrs
- —
Risk factors via First Street. Map © Google.
Why this score? — see what drove the B- grade
The composite is a weighted blend of 9 inputs, each scored 0–100. Each bar is that input's sub-score; the figure is the points it added to the 100-point composite (weight × sub-score).
- Cash flow +27.6/30.0
- 1% rule +10.0/10.0
- DSCR +9.7/10.0
- ARV discount +7.5/15.0
- Schools +4.3/10.0
- Condition / age +4.0/5.0
- Rent growth +2.9/5.0
- Livability +2.5/5.0
- Appreciation +0.0/10.0
$90,995
🖨 Deal sheet 📄 Offer letter ✓ Due diligence
Listing remarks MLS
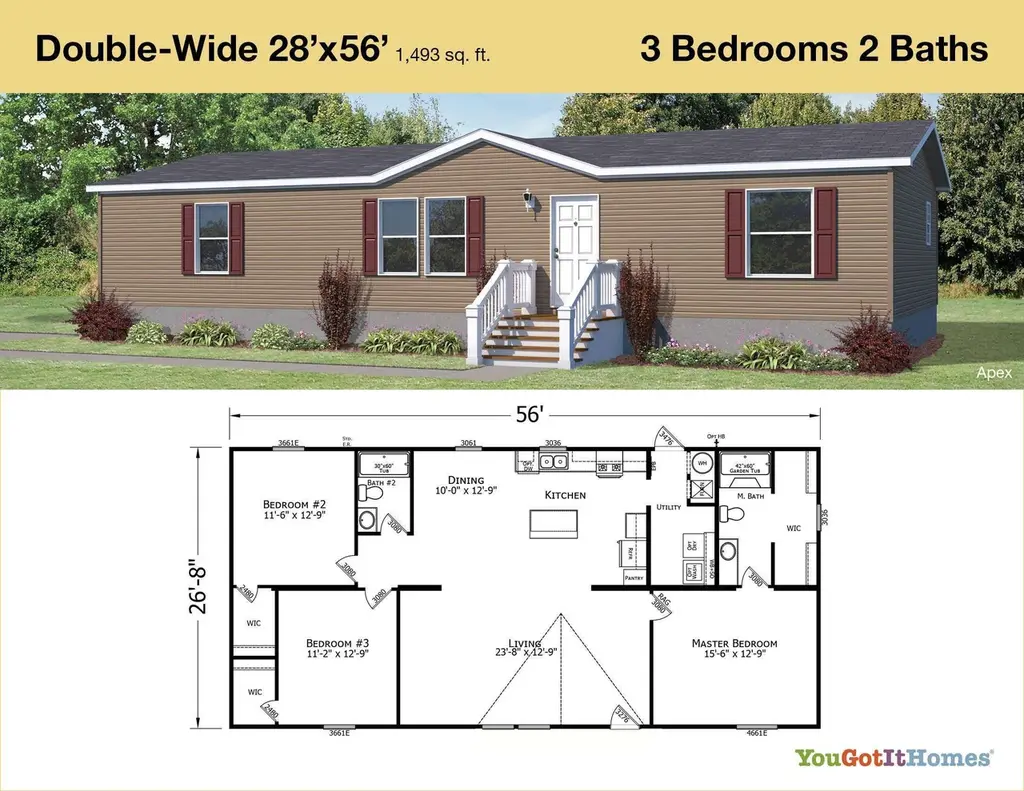
This spacious Champion Prime 2025 double width home includes three bedrooms and two baths. With a spacious living area, the home includes a laundry room, nice working kitchen and a deck. You will love the amenities at Pin Oak Pointe.
Key facts
- Working kitchen
- Laundry room
- Deck
Tags
Neighborhood map
What this means for you Summary
Snapshot
- This is a 3-bed/2.0-bath single-family listed at $91k. Condition is rated good.
Deal economics
- At list price, monthly cash flow is $271 ($3k/yr) — positive.
- The deal already cash-flows at list — no discount required.
- Meets the 1% rule at list price ($2k rent vs $91k).
- Recommended offer: $80k (12.0% below list) — sets the bar for market timing.
- Cap rate 9.9% vs local median 3.2% in O'Fallon — top-decile yield for the area; either an underpriced asset or a hidden risk that comps aren't pricing in. Stress-test before assuming the spread holds.
Location & tenants
- Location reads: area grade B — affects rentability + tenant quality, not the cash-flow math above.
- Wentzville R-IV (suburban): math 44% / reading 52% proficiency, ranked #32 of 324 in MO (top 10%) — families likely to look elsewhere, expect single-tenant / working-renter base with shorter leases; only 18% free/reduced lunch — higher-income household profile.
- Market conditions: Rents rising (+1.6%/yr); 374 active listings in the ZIP; 24 comparable units currently listed for rent nearby; rentals at typical pace (median 15d on market — plan ~3-4 weeks tenant-placement turnaround); high-income renter base; 2,021 units permitted in St. Charles County in 2024 (568 in 5+ unit buildings).
Forward outlook
- Local home prices are declining (-3.0%/yr); year-one equity from $629 of loan paydown is wiped out by about $3k of value loss. Plan a longer hold.
- St. Charles County population projected at +22% by 2050 — long-run rental-demand tailwind backs the buy-and-hold thesis.
Negotiation context
- It's been on market 322 days — a 12% lower offer ($80k) is reasonable based on typical stale-listing flexibility.
Risks & watch-outs
- Watch-outs: HOA is 33% of rent.
Questions for the listing agent
- It's been on market 322 days. Have you received any prior offers? Is the seller open to a 12% concession, seller financing, or rate buy-down credit?
- What does the HOA fee cover, when was the last increase, and are there any pending special assessments or reserve-fund shortfalls?
- Why hasn't it sold? Are there any deal-killer items the seller is aware of (foundation, flood, title, zoning, code violations)?
- Is there a deadline driving the sale (1031 exchange, divorce, estate, relocation)? That informs how much negotiation room exists.
- What's the average days-on-market for RENTAL listings here right now (not sales)? A rising rental-DOM trend means longer vacancies and softer asking-rent achievability than the comps imply.
- What's the recent tenant-quality profile in this submarket — average credit score on applications, eviction rate, late-payment / NSF rate, and stable-employment percentage? A property-management company in the area should have these aggregated.
- How much new for-sale + rental construction is in the pipeline within 1–3 miles? Heavy new supply typically softens prices + rents 12–24 months out; constrained supply supports both.
Investment metrics
- 1% rule
- 2.13% ✓
- Cap rate
- 9.87%
- Cash-on-cash
- 12.77%
- DSCR
- 1.57
- GRM
- 3.9
CMA / ARV
- ARV (median comp)
- $331,840
- List price
- $90,995
- Delta
- -72.58%
- Verdict
- UNDERPRICED
- Comps
- 20 within 1.0 mi
Show comp detail 12 sales within ~0.75 mi
| Address | Dist | Beds/Ba | Sqft | Sold | Price | $/sf | Match |
|---|---|---|---|---|---|---|---|
| 309 Dalriada Blvd | 0.49mi | 3/2.0 | 1,418 (-5%) | 16mo | $464,254 | $327 | 56 |
| 70 Mora Blvd Unit 432-402 | 0.36mi | 3/2.5 | 1,363 (-9%) | 14mo | $331,194 | $243 | 55 |
| 68 Mora Blvd Unit 432-401 | 0.36mi | 3/2.5 | 1,363 (-9%) | 14mo | $340,570 | $250 | 55 |
| 52 Mora Blvd Unit 424-403 | 0.34mi | 3/2.5 | 1,363 (-9%) | 16mo | $333,280 | $245 | 54 |
| 38 Mora Blvd Unit 420-401 | 0.33mi | 3/2.5 | 1,363 (-9%) | 17mo | $340,691 | $250 | 54 |
| 706 English Ivy | 0.25mi | 4/2.0 (+1) | 1,294 (-13%) | 10mo | $379,000 | $293 | 52 |
| 60 Mora Blvd Unit 428-402 | 0.34mi | 3/2.5 | 1,363 (-9%) | 19mo | $354,002 | $260 | 52 |
| 35 Heatherwood Ct | 0.75mi | 3/2.5 | 1,452 (-3%) | 11mo | $325,000 | $224 | 49 |
| 175 Noahs Mill Dr | 0.71mi | 2/2.0 (-1) | 1,525 (+2%) | 13mo | $379,900 | $249 | 48 |
| 176 Noahs Mill Dr | 0.73mi | 2/2.0 (-1) | 1,605 (+8%) | 8mo | $434,900 | $271 | 42 |
| 8 Marian Dr | 0.54mi | 3/1.0 | 1,286 (-14%) | 11mo | $285,000 | $222 | 39 |
| 2355 Post Rd | 0.70mi | 3/1.0 | 1,296 (-13%) | 14mo | $264,900 | $204 | 30 |
Match score weights: distance 35% · size 25% · config 20% · recency 20%. Top-matched comps best support the ARV.
Projected returns pro-forma
-3.0% appreciation · 1.59% rent growth · sell at horizon
- IRR
- 0.2%
- Equity multiple
- 1.01×
- Total profit
- $233
- Equity at exit
- $13,568
- IRR
- 7.6%
- Equity multiple
- 1.52×
- Total profit
- $13,326
- Equity at exit
- $7,868
Cash invested: $25,479 (down + closing). Projections, not guarantees.
Landlord ↔ Tenant lean methodology
- Overall (STATE)
- 81 Strongly Landlord-Friendly
- State Missouri
- 81 Strongly Landlord-Friendly · R+10
- County
- — inherits STATE
- City
- — inherits STATE
ZIP-level market 63368
- Home prices YoY
- -20.7%
- Rents YoY
- 1.6%
- Active inventory
- 374
- Price-to-rent
- 3.9×
Monthly cashflow live
- Estimated rent
- $1,937 high interval (Pro) →
- Mortgage (P&I)
- −$477
- Tax est. 1.5%
- −$114 /mo · $1,365/yr
- Insurance
- −$38
- HOA
- −$630
- Vacancy / Maint / Mgmt
- −$407
- Net cashflow
- $271
Break-even live
UW: 25.0% down · 7.5% · 30yr · 1.5% tax · 5.0% vac · 8.0% maint · 8.0% mgmt
Financing live
Cash to close
- Down payment
- $22,749
- Closing costs
- $2,730
- Reserves months
- —
- Total cash needed
- —
Loan-product check · same deal, 3 products live
Conventional
25% down · 7.5% · 30yr
- Down + closing
- —
- Monthly P&I
- —
- Monthly cashflow
- —
- DSCR
- —
- Eligible?
- —
Personal DTI + credit; lowest rate.
DSCR
20% down · 8.5% · 30yr
- Down + closing
- —
- Monthly P&I
- —
- Monthly cashflow
- —
- DSCR
- —
- Eligible?
- —
No personal income docs; deal must DSCR.
Hard money
10% down · 12.0% · 12mo
- Down + closing
- —
- Monthly P&I
- —
- Monthly cashflow
- —
- DSCR
- —
- Eligible?
- —
Short-term bridge; refi at stabilization.
Rent comps 24 comps
| Address | Beds | Baths | Sqft | Rent | $/sqft | DOM | Units | Dist |
|---|---|---|---|---|---|---|---|---|
| 440 Wild Oak Dr O Fallon, MO | 2.0 | 2.5 | 1214 | $1,625 | $1.34 | 11d | 1 | 0.26mi |
| 314 Newbridge Way O Fallon, MO | 3.0 | 2.5 | 1363 | $2,100 | $1.54 | 2d | 1 | 0.29mi |
| 60 Mora Blvd O Fallon, MO | 3.0 | 2.5 | 1363 | $2,150 | $1.58 | 23d | 1 | 0.36mi |
| 333 Wild Oak Dr O Fallon, MO | 2.0 | 2.0 | 1568 | $2,300 | $1.47 | 43d | 1 | 0.39mi |
| 13300 Spring Creek Ln O Fallon, MO | 2.0 | 2.0 | 1018 | $1,450 | $1.42 | 7d | 1 | 0.40mi |
| 9200 Spring Creek Ln O Fallon, MO | 2.0 | 2.0 | 1014 | $1,450 | $1.43 | 43d | 1 | 0.45mi |
| 9201 Spring Creek Ln Unit 9201 O'Fallon, MO | 2.0 | 2.0 | 1014 | $1,600 | $1.58 | 4d | 1 | 0.45mi |
| 6303 Spring River Dr O Fallon, MO | 2.0 | 2.0 | 1014 | $1,697 | $1.67 | 43d | 1 | 0.57mi |
| 4103 Spring River Dr Unit 4103 O'Fallon, MO | 2.0 | 2.0 | 1054 | $1,600 | $1.52 | 16d | 1 | 0.60mi |
| 214 Harmony Meadows Ct O Fallon, MO | 2.0 | 2.0 | 1000 | $1,600 | $1.60 | 17d | 1 | 0.82mi |
| 234 Harmony Meadows Ct O Fallon, MO | 2.0 | 2.0 | 1000 | $1,500 | $1.50 | 23d | 1 | 0.82mi |
| 710 Alban Aly Unit O O'Fallon, MO | 3.0 | 2.0 | 1527 | $2,400 | $1.57 | 1d | 1 | 0.93mi |
| 101 Lemon Dr Lake St Louis, MO | 1.0–3.0 | 1.0–2.0 | 1002 | $2,228 | $2.22 | 1d | 16 | 1.03mi |
| 284 Stonewall Creek Dr O Fallon, MO | 2.0 | 2.0 | 1075 | $1,575 | $1.47 | 43d | 1 | 1.05mi |
| 55 Timber Oaks Trl O'Fallon, MO | 2.0 | 2.0 | 985 | $1,600 | $1.62 | 43d | 1 | 1.08mi |
| 102 Ripple creek Dr Lake St Louis, MO | 2.0–3.0 | 2.5–3.0 | 1599 | $2,600 | $1.63 | 1d | 4 | 1.18mi |
| 1007 Carpathian Dr Lake Saint Louis, MO | 3.0 | 2.5 | 1524 | $2,191 | $1.44 | 7d | 1 | 1.24mi |
| 104 Shire Dr Lake Saint Louis, MO | 3.0 | 2.5 | 1462 | $2,781 | $1.90 | 4d | 1 | 1.31mi |
| 603 Country Village Dr Lake Saint Louis, MO | 2.0 | 2.0 | 1245 | $1,825 | $1.47 | 10d | 1 | 1.32mi |
| 1124 Welsh Dr Lake Saint Louis, MO | 2.0 | 2.0 | 1130 | $1,495 | $1.32 | 43d | 1 | 1.37mi |
| 4133 Welsh Dr Lake Saint Louis, MO | 2.0 | 2.0 | 1130 | $1,600 | $1.42 | 43d | 1 | 1.37mi |
| 5114 Welsh Dr Lake St Louis, MO | 2.0 | 2.0 | 1114 | $1,450 | $1.30 | 14d | 1 | 1.39mi |
| 5114 Welsh Dr Lake Saint Louis, MO | 2.0 | 2.0 | 1114 | $1,450 | $1.30 | 10d | 1 | 1.39mi |
| 5123 Welsh Dr Lake Saint Louis, MO | 2.0 | 2.0 | 1130 | $1,425 | $1.26 | 7d | 1 | 1.39mi |
HOA detail
- Monthly dues
- $630 · $7,560/yr
Listing history 15 events
-
2026-06-18days on market $90,995 Active 322 DOM
-
2026-06-17days on market $90,995 Active 321 DOM
-
2026-06-16days on market $90,995 Active 320 DOM
-
2026-06-15days on market $90,995 Active 319 DOM
-
2026-06-13days on market $90,995 Active 317 DOM
-
2026-06-13days on market $90,995 Active 316 DOM
-
2026-06-09days on market $90,995 Active 313 DOM
-
2026-06-08days on market $90,995 Active 312 DOM
-
2026-06-08days on market $90,995 Active 311 DOM
-
2026-06-05days on market $90,995 Active 308 DOM
-
2026-06-03days on market $90,995 Active 307 DOM
-
2026-06-02days on market $90,995 Active 306 DOM
-
2026-06-01days on market $90,995 Active 305 DOM
-
2026-05-31days on market $90,995 Active 304 DOM
-
2025-07-31$90,995 Active 233-char remark
Show marketing remark (233 chars)
This spacious Champion Prime 2025 double width home includes three bedrooms and two baths. With a spacious living area, the home includes a laundry room, nice working kitchen and a deck. You will love the amenities at Pin Oak Pointe.
ⓘ Source: listings_history table (triggers on properties + properties_extension) + one-shot
backfill from property_details.listing_events for pre-trigger history.
Nearby sold comps map
Loading sold comps map…
Walkable amenities ~0.75 mi
Loading nearby amenities…
Taxation est. · year 1
- Rental income
- $23,241
- − Mortgage interest
- −$5,097
- − Property taxes
- −$1,365
- − Insurance
- −$455
- − Repairs & maintenance
- −$1,859
- − Management
- −$1,859
- − HOA
- −$7,560
- − Depreciation
- −$2,647
- Taxable income
- $2,398
- Est. tax owed @ 24.0%
- −$576
- After-tax cash flow
- $2,679/yr
For passive investors: Depreciation is non-cash, so a rental often shows a tax loss while cash-flowing — sheltering income. Rental losses are passive: they offset passive income freely, and up to $25,000/yr can offset ordinary (W-2) income if you actively participate and your MAGI is under $100k (phasing out to $0 by $150k); unused losses carry forward. On sale, claimed depreciation is recaptured at up to 25%, and gains may owe capital-gains tax (a 1031 exchange can defer both). Figures are a year-1 estimate at your 24.0% rate — not tax advice; consult a CPA.
Condition & rehab AI · 13 photos
This well-maintained single-family home in a desirable neighborhood offers a good investment opportunity with minimal repairs needed.
Value-add opportunities
- Resale Paint exterior siding — Enhances curb appeal and value
- Rental Clean gutters — Keeps property in good condition and reduces maintenance costs
Renovation cost estimate screening
Value-add ROI direction
- Resale Paint exterior siding — Enhances curb appeal and value ↑
- Rental Clean gutters — Keeps property in good condition and reduces maintenance costs ↑
ⓘ Cost ranges are severity-bucket heuristics (US national rule-of-thumb). Get contractor quotes + a written scope before underwriting a rehab budget.
Schools (NCES district)
- District
- Wentzville R-IV
- NCES district ID
- 2931650
- Math proficiency
- 44% ▼ -9.00%
- Reading proficiency
- 52% ▼ -7.00%
- Median HH income
- $74,961
- Composite
- 43.49/100
- National rank
- #2994
- State rank
- #32 of 324 in MO
Livability — O'Fallon
No livability data for this city. (Only ~50 U.S. cities are tracked.)
Census & demographics
- Census place
- O'Fallon, MO
- County
- Saint Charles County · 399,703 people
- City population
- 45,862
- Metro
- St. Louis, MO-IL
- Population (ZIP)
- 46,966
- Household income
- $124,297
- Rent vs Own
- Severe rent burden
- 538.0
Population outlook (St. Charles County) Hauer SSP2
- Today (2025)
- 437,857 people
- By 2030
- 461,707 · +5.4%
- By 2040
- 503,222 · +14.9%
- By 2050
- 534,684 · +22.1%
- By 2075
- 597,047 · +36.4%
- By 2100
- 609,682 · +39.2%
Race, ethnicity, and origin ACS 2023
- Neighborhood character
- Predominantly White (84%)
- Race & ethnicity
- White 84% Asian 5% Two or more races 5% Black 4% Hispanic / Latino 3%
- Common ancestry
- Romanian 4% Lithuanian 3% Italian 2%
- Foreign-born
- 6% · Canada, China
- Languages at home
- 93% English-only · Other Asian/Pacific 2% Spanish 2% Other Indo-European 2%
Political lean MEDSL · St. Charles
- 2024 margin
- R (+17.0) · D 40.8% · R 57.8% · Other 1.4%
- 2008→2024 swing
- -7.2pp toward R · 2008: -9.7pp · 2024: -17.0pp
- All cycles
- 2024: R+17.0 2020: R+17.5 2016: R+26.4 2012: R+21.0 2008: R+9.7
Not yet ingested
- Civics
- —
Market trends
- HPI YoY
- ▼ -57.32%
- Current HPI
- 219.7731
- Rent YoY
- ▲ 1.59%
- Metro
- St. Louis, MO-IL
- State GDP YoY
- ▲ 1.84%
- F500 in state
- 20
Industry mix (Fortune 500 HQ in MO)
| Industry | F500 HQs | Revenue |
|---|---|---|
| Healthcare | 1 | $163B |
|
||
| Insurance | 1 | $21B |
|
||
| Industrial Technology | 1 | $17B |
|
||
| Retail | 1 | $16B |
|
||
| Industrial Distribution | 1 | $10B |
|
||
| Utilities | 1 | $9B |
|
||
Price history
1 event — show timeline
- 2025-07-31 Listed $90,995 Zillow
Cash-flow waterfall
monthlySold comps — $/sqft
last 12 mo · ≤1 miLoading sold comps…