7600 Golden Valley Rd #1004 · Golden Valley, MN
Flood risk 1/10 · Minimal
- FEMA flood zone
- X (unshaded)
- Chance of flooding over 30 yrs
- 0.0%
- Est. flood insurance / yr
- $507 – $1,088
Fire risk 1/10 · Minimal
- Est. fire insurance / yr
- $888 – $1,650
Heat risk 2/10 · Minimal
- Hot days now (above 99°F)
- 7 days/yr
- Hot days in 30 yrs
- 14 days/yr
Wind risk 2/10 · Minimal
- Chance of severe wind over 30 yrs
- —
Air-quality risk 2/10 · Minimal
- Unhealthy air days now
- 2 days/yr
- Unhealthy air days in 30 yrs
- 2 days/yr
Risk factors via First Street. Map © Google.
Why this score? — see what drove the D- grade
The composite is a weighted blend of 9 inputs, each scored 0–100. Each bar is that input's sub-score; the figure is the points it added to the 100-point composite (weight × sub-score).
- ARV discount +15.0/15.0
- 1% rule +10.0/10.0
- Rent growth +4.4/5.0
- Livability +4.1/5.0
- Schools +3.0/10.0
- Condition / age +2.5/5.0
- Cash flow +0.0/30.0
- DSCR +0.0/10.0
- Appreciation +0.0/10.0
$94,000
🖨 Deal sheet (PDF) 📄 Offer letter ✓ Due diligence
Listing remarks MLS
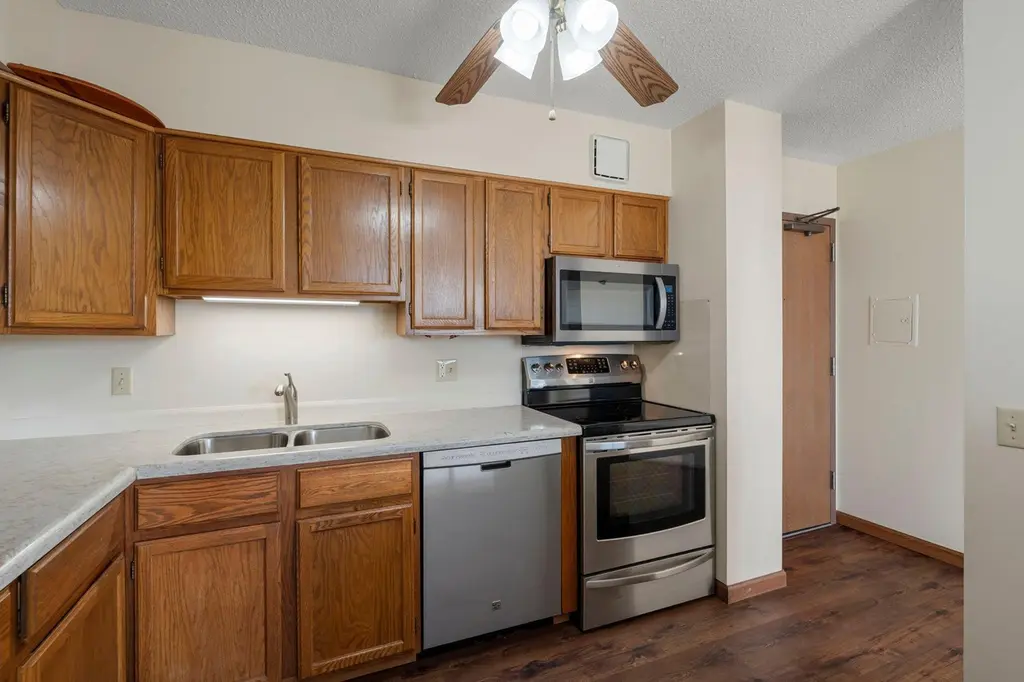
This home features the Fairlawn floor plan, a very practical split room layout with separated bedrooms that feature city views as far as the eye can see. Some very nice upgrades and a well appointed kitchen with stainless steel appliances, LPV flooring, celling fan, stained glass light fixture and a built-in feature in the dining room for your collectable treasures. Enjoy the amenities of the game room, craft room, woodworking shop, fitness center, salon, library and the amazing solarium on the ninth floor. Calvary co-operative is one of those gems not many know about. It's an incredible value with loads of amenities. You'll appreciate the professional on-site property management and maintenance that give you increased peace of mind. This is a great opportunity, make an appointment to see it today!
Key facts
- Lpv flooring
- Split room layout
- Separated bedrooms
Tags
Neighborhood map
What this means for you Summary
Snapshot
- This is a 2-bed/1.0-bath condo listed at $94k.
Deal economics
- At list price, monthly cash flow is $-611 ($-7k/yr) — negative.
- To cash-flow at today's rent, offer at most $1k (98.8% below list).
- Meets the 1% rule at list price ($2k rent vs $94k).
- Recommended offer: $1k (98.8% below list) — sets the bar for cash-flow.
- Cap rate -1.5% vs local median 2.9% in Golden Valley — below-typical yield; the buyer is paying a premium for something (appreciation thesis, condition, location) that the cap rate doesn't capture.
Location & tenants
- Location reads 82/100 on livability (#40 in MN, #1,110 nationally) — a professional / high-income tenant draw. Strengths: crime A+, commute A+, employment A+; Watch: amenities F, cost of living D-.
- Robbinsdale Public School District (suburban): math 24% / reading 44% proficiency, ranked #250 of 301 in MN (top 83%) — families likely to look elsewhere, expect single-tenant / working-renter base with shorter leases.
- Zoned schools: Neill Elementary (math 27% / reading 42%, grade F, #655 of 857 statewide, top 78%, 361 students, 76% FRL); Plymouth Middle (math 18% / reading 55%, grade F, #169 of 258 statewide, top 65%, 836 students, 50% FRL); Robbinsdale Armstrong Senior High (math 37% / reading 58%, grade D, #162 of 471 statewide, top 35%, 1,832 students, 45% FRL) — zoned schools average 57% FRL vs 41% district-wide (16 pts higher); higher-poverty schools than district average — tighter screening recommended.
- Market conditions: Rents rising fast (+7.4%/yr); 126 active listings in the ZIP; 23 comparable units currently listed for rent nearby; rentals leasing fast (median 1d on market — plan ~1-2 weeks tenant-placement turnaround); solid renter incomes; 4,651 units permitted in Hennepin County in 2024 (2,443 in 5+ unit buildings).
Forward outlook
- Local home prices are declining (-3.0%/yr); year-one equity from $650 of loan paydown is wiped out by about $3k of value loss. Plan a longer hold.
- Hennepin County population projected at +30% by 2050 — long-run rental-demand tailwind backs the buy-and-hold thesis.
Negotiation context
- It's been on market 95 days — a 9% lower offer ($86k) is reasonable based on typical stale-listing flexibility.
Risks & watch-outs
- Watch-outs: HOA is 79% of rent.
Questions for the listing agent
- What do current leases actually rent for vs. the listed asking? Can we see a recent rent roll and the last 12 months of T-12 income?
- It's been on market 95 days. Have you received any prior offers? Is the seller open to a 99% concession, seller financing, or rate buy-down credit?
- What does the HOA fee cover, when was the last increase, and are there any pending special assessments or reserve-fund shortfalls?
- Any open or pending special assessments — roof, HVAC, plumbing, elevator, façade? What's the per-unit balance and payoff schedule, and is the seller paying it off at close or rolling it to the buyer?
- Why hasn't it sold? Are there any deal-killer items the seller is aware of (foundation, flood, title, zoning, code violations)?
- Is there a deadline driving the sale (1031 exchange, divorce, estate, relocation)? That informs how much negotiation room exists.
- Schools are B-rated — typically a magnet for longer-tenancy family renters. What's the average tenant stay here, and is there a school-zone premium baked into asking?
- The area grade is low — what's the realistic commute time and amenity access for the typical tenant pool here? Any planned neighborhood developments (good or bad) we should know about?
- What's the average days-on-market for RENTAL listings here right now (not sales)? A rising rental-DOM trend means longer vacancies and softer asking-rent achievability than the comps imply.
- What's the recent tenant-quality profile in this submarket — average credit score on applications, eviction rate, late-payment / NSF rate, and stable-employment percentage? A property-management company in the area should have these aggregated.
- How much new apartment / multifamily construction is in the pipeline within 1–3 miles? Heavy new supply (>2% of stock underway) typically softens rents 12–24 months out; light construction supports rent growth.
Investment metrics
- 1% rule
- 1.99% ✓
- Cap rate
- -1.50%
- Cash-on-cash
- -27.84%
- DSCR
- -0.24
- GRM
- 4.2
CMA / ARV
- ARV (median comp)
- $147,782
- List price
- $94,000
- Delta
- -36.39%
- Verdict
- UNDERPRICED
- Comps
- 2 within 2.0 mi
Projected returns pro-forma
-3.0% appreciation · 7.4% rent growth · sell at horizon
- IRR
- -50.2%
- Equity multiple
- -0.69×
- Total profit
- $-44,556
- Equity at exit
- $14,016
- IRR
- -19.8%
- Equity multiple
- -0.76×
- Total profit
- $-46,276
- Equity at exit
- $8,127
Cash invested: $26,320 (down + closing). Projections, not guarantees.
Landlord ↔ Tenant lean methodology
- Overall (STATE)
- 46 Balanced
- State Minnesota
- 46 Balanced · D+2
- County
- — inherits STATE
- City
- — inherits STATE
ZIP-level market 55427
- Rents YoY
- 7.4%
- Active inventory
- 126
- Price-to-rent
- 4.2×
Monthly cashflow live
- Estimated rent
- $1,872 high interval (Pro) →
- Mortgage (P&I)
- −$493
- Tax from tax record
- −$86 /mo · $1,035/yr
- Insurance
- −$39
- HOA
- −$1,471
- Vacancy / Maint / Mgmt
- −$393
- Net cashflow
- $-611
Break-even live
Sensitivity live
| Price | -10% $-557 | -5% $-584 | +0% $-611 | +5% $-637 | +10% $-664 |
|---|---|---|---|---|---|
| Rent | -10% $-758 | -5% $-685 | +0% $-611 | +5% $-537 | +10% $-463 |
| Rate | -1.0pp $-563 | -0.5pp $-587 | base $-611 | +0.5pp $-635 | +1.0pp $-660 |
UW: 25.0% down · 7.5% · 30yr · 1.5% tax · 5.0% vac · 8.0% maint · 8.0% mgmt
Financing live
Cash to close
- Down payment
- $23,500
- Closing costs
- $2,820
- Reserves months
- —
- Total cash needed
- —
Loan-product check · same deal, 3 products live
Conventional
25% down · 7.5% · 30yr
- Down + closing
- —
- Monthly P&I
- —
- Monthly cashflow
- —
- DSCR
- —
- Eligible?
- —
Personal DTI + credit; lowest rate.
DSCR
20% down · 8.5% · 30yr
- Down + closing
- —
- Monthly P&I
- —
- Monthly cashflow
- —
- DSCR
- —
- Eligible?
- —
No personal income docs; deal must DSCR.
Hard money
10% down · 12.0% · 12mo
- Down + closing
- —
- Monthly P&I
- —
- Monthly cashflow
- —
- DSCR
- —
- Eligible?
- —
Short-term bridge; refi at stabilization.
Rent comps 23 comps
| Address | Beds | Baths | Sqft | Rent | $/sqft | DOM | Units | Dist |
|---|---|---|---|---|---|---|---|---|
| 640 Wisconsin Ave N Golden Valley, MN | 1.0–3.0 | 1.0–2.0 | 1118 | $2,952 | $2.64 | 0d | 93 | 0.36mi |
| 8350 Golden Valley Rd Golden Valley, MN | 1.0–2.0 | 1.0–2.0 | 995 | $2,035 | $2.05 | 1d | 10 | 0.50mi |
| 6537 Golden Valley Rd Golden Valley, MN | 1.0 | 1.0 | 825 | $1,538 | $1.86 | 6d | 9 | 0.73mi |
| 9140 Golden Valley Rd Minneapolis, MN | 1.0–2.0 | 1.0 | 662 | $1,500 | $2.26 | 1d | 6 | 0.92mi |
| 9201 Golden Valley Rd Minneapolis, MN | 1.0–2.0 | 1.0–2.0 | 926 | $2,733 | $2.95 | 0d | 18 | 0.98mi |
| 1370 Douglas Dr N Minneapolis, MN | 2.0 | 1.0–2.0 | 822 | $1,840 | $2.24 | 1d | 1 | 1.00mi |
| 1305 Flag Ave N Unit Labs Golden Valley, MN | 1.0 | 1.0 | 850 | $1,500 | $1.76 | 12d | 1 | 1.01mi |
| 1305 Flag Ave N Unit 2 Golden Valley, MN | 1.0 | 1.0 | 800 | $1,650 | $2.06 | 19d | 1 | 1.01mi |
| 1349 Pennsylvania Ave S Minneapolis, MN | 2.0 | 1.0 | 850 | $1,550 | $1.82 | 45d | 1 | 1.21mi |
| 2448 Winnetka Ave N Golden Valley, MN | 1.0–3.0 | 1.0–2.5 | 1057 | $2,115 | $2.00 | 0d | 19 | 1.24mi |
| 1360 Hampshire Ave S Minneapolis, MN | 2.0 | 1.0 | 800 | $1,330 | $1.66 | 0d | 1 | 1.33mi |
| 1351 Hampshire Ave S Minneapolis, MN | 1.0–2.0 | 1.0 | 920 | $1,675 | $1.82 | 4d | 14 | 1.38mi |
| 5743 Glenwood Ave Unit 5743-06 Golden Valley, MN | 2.0 | 1.0 | 900 | $1,195 | $1.33 | 45d | 1 | 1.38mi |
| 5743 Glenwood Ave Unit 5747-03 Golden Valley, MN | 1.0 | 1.0 | 720 | $995 | $1.38 | 19d | 1 | 1.38mi |
| 200 Nathan Ln N Plymouth, MN | 1.0–2.0 | 1.0–2.0 | 926 | $1,917 | $2.07 | 0d | 5 | 1.40mi |
| 1435 Hampshire Ave S St Louis Park, MN | 1.0–2.0 | 1.0–2.0 | 930 | $1,935 | $2.08 | 0d | 14 | 1.45mi |
| 2710 Rosalyn Ct Minneapolis, MN | 1.0 | 1.0 | 625 | $1,235 | $1.98 | 45d | 1 | 1.46mi |
| 10010 6th Ave N Minneapolis, MN | 1.0–3.0 | 1.0–2.0 | 1100 | $2,980 | $2.71 | 0d | 21 | 1.47mi |
| 770 Xenia Ave S Minneapolis, MN | 2.0 | 1.0–2.0 | 894 | $2,955 | $3.31 | 0d | 29 | 1.48mi |
| 2720 Rosalyn Ct #202 Minneapolis, MN | 2.0 | 1.0 | 780 | $1,395 | $1.79 | 45d | 1 | 1.48mi |
| 2720 Rosalyn Ct New Hope, MN | 1.0–2.0 | 1.0 | 725 | $1,395 | $1.92 | 13d | 2 | 1.48mi |
| 2720 Rosalyn Ct New Hope, MN | 1.0–2.0 | 1.0 | 690 | $1,395 | $2.02 | 46d | 2 | 1.48mi |
| 250 Turners Xrd S Minneapolis, MN | 1.0–3.0 | 1.0–2.0 | 1405 | $2,160 | $1.54 | 1d | 7 | 1.49mi |
HOA detail condo
- Monthly dues
- $1,471 · $17,652/yr
- Likely covers
- gym
- Assessments
- None detected in remarks — confirm with the listing agent.
Listing history 16 events
-
2026-06-21days on market $94,000 Active 95 DOM
-
2026-06-18days on market $94,000 Active 92 DOM
-
2026-06-17days on market $94,000 Active 91 DOM
-
2026-06-16days on market $94,000 Active 90 DOM
-
2026-06-15days on market $94,000 Active 89 DOM
-
2026-06-13days on market $94,000 Active 87 DOM
-
2026-06-13days on market $94,000 Active 86 DOM
-
2026-06-09days on market $94,000 Active 83 DOM
-
2026-06-08days on market $94,000 Active 82 DOM
-
2026-06-07days on market $94,000 Active 81 DOM
-
2026-06-04days on market $94,000 Active 78 DOM
-
2026-06-03days on market $94,000 Active 77 DOM
-
2026-06-02days on market $94,000 Active 76 DOM
-
2026-06-01days on market $94,000 Active 75 DOM
-
2026-05-31days on market $94,000 Active 74 DOM
-
2026-03-17$114,000 Active 809-char remark
Show marketing remark (809 chars)
This home features the Fairlawn floor plan, a very practical split room layout with separated bedrooms that feature city views as far as the eye can see. Some very nice upgrades and a well appointed kitchen with stainless steel appliances, LPV flooring, celling fan, stained glass light fixture and a built-in feature in the dining room for your collectable treasures. Enjoy the amenities of the game room, craft room, woodworking shop, fitness center, salon, library and the amazing solarium on the ninth floor. Calvary co-operative is one of those gems not many know about. It's an incredible value with loads of amenities. You'll appreciate the professional on-site property management and maintenance that give you increased peace of mind. This is a great opportunity, make an appointment to see it today!
ⓘ Source: listings_history table (triggers on properties + properties_extension) + one-shot
backfill from property_details.listing_events for pre-trigger history.
Tax reassessment forecast MN · Partial reset (capped growth)
- Current annual tax
- $1,035 · $86/mo
- Projected year-2 tax
- $1,044 · $87/mo
- Expected delta
- +$9/yr (+$1/mo · 0.9%)
ⓘ Screening estimate from a state-policy table — verify with the county assessor before closing.
Climate risk First Street
- Flood 1/10 Low FEMA zone X (unshaded) · 0% chance over 30 yrs
- Wildfire 1/10 Low
- Heat 2/10 Low 7 d/yr ≥99°F today · 14 d/yr by 30 yrs out
- Wind 2/10 Low
- Air quality 2/10 Low 2 unhealthy d/yr today · 2 by 30 yrs out
Nearby sold comps map
Loading sold comps map…
Walkable amenities ~0.75 mi
Loading nearby amenities…
Taxation est. · year 1
- Rental income
- $22,462
- − Mortgage interest
- −$5,265
- − Property taxes
- −$1,035
- − Insurance
- −$470
- − Repairs & maintenance
- −$1,797
- − Management
- −$1,797
- − HOA
- −$17,652
- − Depreciation
- −$2,735
- Taxable loss
- −$8,289
- Est. tax savings @ 24.0%
- +$1,989
- After-tax cash flow
- $-5,338/yr
For passive investors: Depreciation is non-cash, so a rental often shows a tax loss while cash-flowing — sheltering income. Rental losses are passive: they offset passive income freely, and up to $25,000/yr can offset ordinary (W-2) income if you actively participate and your MAGI is under $100k (phasing out to $0 by $150k); unused losses carry forward. On sale, claimed depreciation is recaptured at up to 25%, and gains may owe capital-gains tax (a 1031 exchange can defer both). Figures are a year-1 estimate at your 24.0% rate — not tax advice; consult a CPA.
Schools (NCES district)
- District
- Robbinsdale Public School District
- NCES district ID
- 2731780
- Math proficiency
- 24% ▼ -11.00%
- Reading proficiency
- 44% ▼ -5.00%
- Median HH income
- $60,234
- Composite
- 30.42/100
- National rank
- #6240
- State rank
- #250 of 301 in MN
Livability — Golden Valley
- Score
- 82/100
- State rank
- #40
- US rank
- #1110
Category grades
Schools grade is shown separately in the Schools card above.
Census & demographics
- Census place
- Golden Valley, MN
- County
- Hennepin County · 1,150,272 people
- City population
- 28,452
- Metro
- Minneapolis-St. Paul-Bloomington, MN-WI
- Population (ZIP)
- 24,764
- Household income
- $92,821
- Rent vs Own
- Severe rent burden
- 663.0
Population outlook (Hennepin County) Hauer SSP2
- Today (2025)
- 1,405,227 people
- By 2030
- 1,492,650 · +6.2%
- By 2040
- 1,660,157 · +18.1%
- By 2050
- 1,823,498 · +29.8%
- By 2075
- 2,221,283 · +58.1%
- By 2100
- 2,509,976 · +78.6%
Race, ethnicity, and origin ACS 2023
- Neighborhood character
- Predominantly White (70%)
- Race & ethnicity
- White 70% Black 13% Two or more races 8% Hispanic / Latino 6% Asian 4%
- Hispanic origin (detail)
- Mexican 4%
- Common ancestry
- Portuguese 12% Scottish 3% Romanian 3%
- Foreign-born
- 13% · Canada, Vietnam
- Languages at home
- 87% English-only · Spanish 5% Russian/Polish/Slavic 2% Other Indo-European 2%
Political lean MEDSL · Hennepin
- 2024 margin
- Solid D (+42.6) · D 70.2% · R 27.5% · Other 2.3%
- 2008→2024 swing
- +14.0pp toward D · 2008: 28.6pp · 2024: 42.6pp
- All cycles
- 2024: D+42.6 2020: D+43.2 2016: D+35.3 2012: D+27.1 2008: D+28.6
Not yet ingested
- Civics
- —
Market trends
- HPI YoY
- ▼ -267.55%
- Current HPI
- 235.3888
- Rent YoY
- ▲ 7.40%
- Metro
- Minneapolis-St. Paul-Bloomington, MN-WI
- State GDP YoY
- ▲ 2.41%
- F500 in state
- 34
Industry mix (Fortune 500 HQ in MN)
| Industry | F500 HQs | Revenue |
|---|---|---|
| Healthcare | 2 | $407B |
|
||
| Retail | 2 | $150B |
|
||
| Consumer Goods | 2 | $32B |
|
||
| Industrial Machinery | 2 | $6B |
|
||
| Agriculture | 1 | $40B |
|
||
| Healthcare / Medical Devices | 1 | $32B |
|
||
Price history
1 event — show timeline
- 2026-03-17 Listed $114,000 NORTHSTARMLS as Distributed by MLS Grid
Property tax history
-1.6%/yrLatest (2025): $1,035 · -5.1% YoY. Source: county tax records.
Cash-flow waterfall
monthlySold comps — $/sqft
last 12 mo · ≤1 miLoading sold comps…