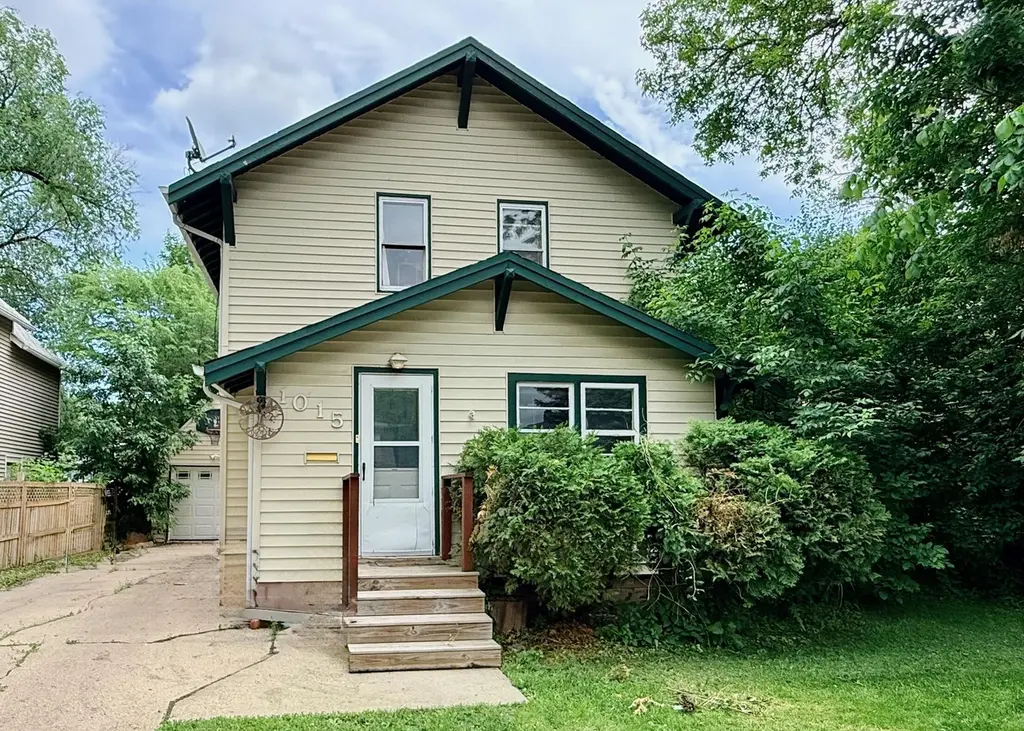
1015 S Lincoln St · Aberdeen, SD
Flood risk 4/10 · Minor
- FEMA flood zone
- X (unshaded)
- Chance of flooding over 30 yrs
- 0.23%
- Est. flood insurance / yr
- $473 – $860
Fire risk 2/10 · Minimal
- Est. fire insurance / yr
- $1,342 – $2,492
Heat risk 2/10 · Minimal
- Hot days now (above 99°F)
- 7 days/yr
- Hot days in 30 yrs
- 13 days/yr
Wind risk 2/10 · Minimal
- Chance of severe wind over 30 yrs
- —
Air-quality risk 2/10 · Minimal
- Unhealthy air days now
- 1 days/yr
- Unhealthy air days in 30 yrs
- 1 days/yr
Risk factors via First Street. Map © Google.
Why this score? — see what drove the D grade
The composite is a weighted blend of 9 inputs, each scored 0–100. Each bar is that input's sub-score; the figure is the points it added to the 100-point composite (weight × sub-score).
- ARV discount +15.0/15.0
- Cash flow +9.1/30.0
- Schools +4.2/10.0
- Livability +4.0/5.0
- 1% rule +2.7/10.0
- DSCR +2.5/10.0
- Rent growth +2.5/5.0
- Condition / age +2.5/5.0
- Appreciation +0.0/10.0
$153,000
🖨 Deal sheet 📄 Offer letter ✓ Due diligence
Listing remarks MLS
Charming home featuring 4 bedrooms, one stall tandem garage and spacious backyard. Updated kitchen, and flooring on main level. Master bedroom and bath located on the main level, deck off of the dining room and original wood working throughout!
Key facts
- 6,969 sq ft lot
- Garage
- Built 1920
Tags
Property features AI
Exterior
- Parking: Garage (1.5 spaces)
- Utilities: Public water; Public sewer; Sewer and water connected
- Home design: Single-family residence; Two levels
- Exterior features: Composition roof; Lot approximately 0.16 acres (50 x 142)
Interior
- Kitchen: Range
- Bedrooms: 13 total rooms (includes bedrooms and living spaces)
- Heating & cooling: Forced air heating (natural gas); Central air conditioning
- Interior features: Full basement; Range Hood; Gas water heater
- Laundry & utility: Washer; Dryer
Neighborhood map
What this means for you Summary
Snapshot
- This is a 2-bed/3.0-bath single-family listed at $153k.
Deal economics
- At list price, monthly cash flow is $-119 ($-1k/yr) — negative.
- To cash-flow at today's rent, offer at most $132k (13.7% below list).
- To meet the 1% rule (rent ≥ 1% of price), the offer needs to be $118k (22.6% below list).
- Recommended offer: $118k (22.6% below list) — sets the bar for 1% rule.
- Cap rate 5.4% vs local median 2.9% in Aberdeen — top-decile yield for the area; either an underpriced asset or a hidden risk that comps aren't pricing in. Stress-test before assuming the spread holds.
Location & tenants
- Location reads 81/100 on livability (#7 in SD, #1,411 nationally) — a professional / high-income tenant draw. Strengths: cost of living A+, housing A+, health & safety A+; Watch: commute F.
- Aberdeen School District 06-1 (town): math 45% / reading 54% proficiency, ranked #33 of 59 in SD (top 56%) — families likely to look elsewhere, expect single-tenant / working-renter base with shorter leases.
- Market conditions: 174 active listings in the ZIP; 1 comparable units currently listed for rent nearby; 86 units permitted in Brown County in 2024 (0 in 5+ unit buildings).
Forward outlook
- Local home prices are declining (-3.0%/yr); year-one equity from $1k of loan paydown is wiped out by about $5k of value loss. Plan a longer hold.
- Brown County population projected at +37% by 2050 — long-run rental-demand tailwind backs the buy-and-hold thesis.
Negotiation context
- Only 13 days on market — expect competitive offers; lowballing is unlikely to land.
- 2 sale attempts since 10y ago with the ask held roughly flat each time — persistent listings suggest the price (not the market) is what's stuck; bring a comps-based counter.
- Current owner paid $110k; 39% above their basis — modest negotiation headroom, anchor on the comps not their cost.
Risks & watch-outs
- Watch-outs: built in 1920 — expect roof / HVAC / electrical / plumbing capex.
Questions for the listing agent
- What do current leases actually rent for vs. the listed asking? Can we see a recent rent roll and the last 12 months of T-12 income?
- Built in 1920 — when were the roof, HVAC, electrical panel, plumbing, and water heater last replaced?
- Is there a deadline driving the sale (1031 exchange, divorce, estate, relocation)? That informs how much negotiation room exists.
- Schools are B-rated — typically a magnet for longer-tenancy family renters. What's the average tenant stay here, and is there a school-zone premium baked into asking?
- The area grade is low — what's the realistic commute time and amenity access for the typical tenant pool here? Any planned neighborhood developments (good or bad) we should know about?
- What's the average days-on-market for RENTAL listings here right now (not sales)? A rising rental-DOM trend means longer vacancies and softer asking-rent achievability than the comps imply.
- What's the recent tenant-quality profile in this submarket — average credit score on applications, eviction rate, late-payment / NSF rate, and stable-employment percentage? A property-management company in the area should have these aggregated.
- How much new for-sale + rental construction is in the pipeline within 1–3 miles? Heavy new supply typically softens prices + rents 12–24 months out; constrained supply supports both.
Investment metrics
- 1% rule
- 0.77% ✗
- Cap rate
- 5.36%
- Cash-on-cash
- -3.32%
- DSCR
- 0.85
- GRM
- 10.8
CMA / ARV
- ARV (on-the-fly)
- $201,690
- Comps found
- 12
Show comp detail 12 sales within ~0.75 mi
| Address | Dist | Beds/Ba | Sqft | Sold | Price | $/sf | Match |
|---|---|---|---|---|---|---|---|
| 201 SW 8th Ave | 0.30mi | 3/2.0 (+1) | 1,480 (-1%) | 1mo | $95,000 | $64 | 75 |
| 209 SE 9th Ave | 0.17mi | 3/2.0 (+1) | 1,494 (0%) | 11mo | $225,000 | $151 | 74 |
| 124 SW 13th Ave | 0.27mi | 3/2.0 (+1) | 1,558 (+4%) | 6mo | $220,000 | $141 | 66 |
| 1514 S Main St | 0.39mi | 3/2.0 (+1) | 1,547 (+4%) | 2mo | $235,000 | $152 | 66 |
| 612 S Arch St | 0.40mi | 3/2.0 (+1) | 1,440 (-4%) | 1mo | $145,000 | $101 | 65 |
| 1404 S 2nd St | 0.36mi | 3/1.0 (+1) | 1,408 (-6%) | 3mo | $179,000 | $127 | 58 |
| 516 SE 10th Ave | 0.31mi | 3/2.0 (+1) | 1,640 (+10%) | 3mo | $210,000 | $128 | 58 |
| 1737 S 3rd St | 0.65mi | 3/2.0 (+1) | 1,486 (-0%) | 8mo | $176,000 | $118 | 54 |
| 1518 S Lincoln St | 0.40mi | 2/1.0 | 1,372 (-8%) | 11mo | $115,000 | $84 | 50 |
| 1431 Dick Dr | 0.62mi | 3/2.0 (+1) | 1,378 (-8%) | 3mo | $297,500 | $216 | 47 |
| 1524 S 1st St | 0.44mi | 3/2.0 (+1) | 1,664 (+11%) | 6mo | $261,500 | $157 | 46 |
| 501 S Dakota St | 0.71mi | 3/2.0 (+1) | 1,538 (+3%) | 10mo | $208,100 | $135 | 45 |
Match score weights: distance 35% · size 25% · config 20% · recency 20%. Top-matched comps best support the ARV.
Projected returns pro-forma
-3.0% appreciation · 3.0% rent growth · sell at horizon
- IRR
- -21.8%
- Equity multiple
- 0.25×
- Total profit
- $-32,331
- Equity at exit
- $22,813
- IRR
- -15.7%
- Equity multiple
- 0.12×
- Total profit
- $-37,816
- Equity at exit
- $13,229
Cash invested: $42,840 (down + closing). Projections, not guarantees.
Landlord ↔ Tenant lean methodology
- Overall (STATE)
- 83 Strongly Landlord-Friendly
- State South Dakota
- 83 Strongly Landlord-Friendly · R+16
- County
- — inherits STATE
- City
- — inherits STATE
ZIP-level market 57401
- Active inventory
- 174
- Price-to-rent
- 10.8×
Monthly cashflow live
- Estimated rent
- $1,185 medium interval (Pro) →
- Mortgage (P&I)
- −$802
- Tax from tax record
- −$188 /mo · $2,262/yr
- Insurance
- −$64
- HOA
- −$0
- Vacancy / Maint / Mgmt
- −$249
- Net cashflow
- $-119
Break-even live
UW: 25.0% down · 7.5% · 30yr · 1.5% tax · 5.0% vac · 8.0% maint · 8.0% mgmt
Financing live
Cash to close
- Down payment
- $38,250
- Closing costs
- $4,590
- Reserves months
- —
- Total cash needed
- —
Loan-product check · same deal, 3 products live
Conventional
25% down · 7.5% · 30yr
- Down + closing
- —
- Monthly P&I
- —
- Monthly cashflow
- —
- DSCR
- —
- Eligible?
- —
Personal DTI + credit; lowest rate.
DSCR
20% down · 8.5% · 30yr
- Down + closing
- —
- Monthly P&I
- —
- Monthly cashflow
- —
- DSCR
- —
- Eligible?
- —
No personal income docs; deal must DSCR.
Hard money
10% down · 12.0% · 12mo
- Down + closing
- —
- Monthly P&I
- —
- Monthly cashflow
- —
- DSCR
- —
- Eligible?
- —
Short-term bridge; refi at stabilization.
Rent comps 1 comps
| Address | Beds | Baths | Sqft | Rent | $/sqft | DOM | Units | Dist |
|---|---|---|---|---|---|---|---|---|
| 1116 S Main St Aberdeen, SD | 2.0 | 1.0 | 930 | $1,020 | $1.10 | 43d | 1 | 0.15mi |
Listing history 9 events
-
2026-06-18days on market $153,000 Active 13 DOM
-
2026-06-17days on market $153,000 Active 12 DOM
-
2026-06-16days on market $153,000 Active 11 DOM
-
2026-06-15days on market $153,000 Active 10 DOM
-
2026-06-14days on market $153,000 Active 8 DOM
-
2026-06-12days on market $153,000 Active 7 DOM
-
2026-06-09days on market $153,000 Active 4 DOM
-
2026-06-08days on market $153,000 Active 3 DOM
-
2026-06-07$153,000 Active 2 DOM
ⓘ Source: listings_history table (triggers on properties + properties_extension) + one-shot
backfill from property_details.listing_events for pre-trigger history.
Tax reassessment forecast SD · Resets to sale price
- Current annual tax
- $2,262 · $188/mo
- Projected year-2 tax
- $2,262 · $188/mo
- Expected delta
- $0/yr ($0/mo · 0.0%)
ⓘ Screening estimate from a state-policy table — verify with the county assessor before closing.
Climate risk First Street
- Flood 4/10 Moderate FEMA zone X (unshaded) · 23% chance over 30 yrs
- Wildfire 2/10 Low
- Heat 2/10 Low 7 d/yr ≥99°F today · 13 d/yr by 30 yrs out
- Wind 2/10 Low
- Air quality 2/10 Low 1 unhealthy d/yr today · 1 by 30 yrs out
Nearby sold comps map
Loading sold comps map…
Walkable amenities ~0.75 mi
Loading nearby amenities…
Taxation est. · year 1
- Rental income
- $14,217
- − Mortgage interest
- −$8,570
- − Property taxes
- −$2,262
- − Insurance
- −$765
- − Repairs & maintenance
- −$1,137
- − Management
- −$1,137
- − Depreciation
- −$4,451
- Taxable loss
- −$4,106
- Est. tax savings @ 24.0%
- +$985
- After-tax cash flow
- $-438/yr
For passive investors: Depreciation is non-cash, so a rental often shows a tax loss while cash-flowing — sheltering income. Rental losses are passive: they offset passive income freely, and up to $25,000/yr can offset ordinary (W-2) income if you actively participate and your MAGI is under $100k (phasing out to $0 by $150k); unused losses carry forward. On sale, claimed depreciation is recaptured at up to 25%, and gains may owe capital-gains tax (a 1031 exchange can defer both). Figures are a year-1 estimate at your 24.0% rate — not tax advice; consult a CPA.
Schools (NCES district)
- District
- Aberdeen School District 06-1
- NCES district ID
- 4602070
- Math proficiency
- 45% ▼ -5.00%
- Reading proficiency
- 54% ▼ -4.00%
- Median HH income
- $49,230
- Composite
- 42.27/100
- National rank
- #3273
- State rank
- #33 of 59 in SD
Livability — Aberdeen
- Score
- 81/100
- State rank
- #7
- US rank
- #1411
Category grades
Schools grade is shown separately in the Schools card above.
Census & demographics
- Census place
- Aberdeen, SD
- County
- Brown County · 31,939 people
- City population
- 31,939
- Metro
- Aberdeen, SD
- Population (ZIP)
- 31,939
- Household income
- $68,835
- Rent vs Own
- Severe rent burden
- 1220.0
Population outlook (Brown County) Hauer SSP2
- Today (2025)
- 43,830 people
- By 2030
- 46,663 · +6.5%
- By 2040
- 52,852 · +20.6%
- By 2050
- 59,898 · +36.7%
- By 2075
- 82,750 · +88.8%
- By 2100
- 112,639 · +157.0%
Race, ethnicity, and origin ACS 2023
- Neighborhood character
- Predominantly White (83%)
- Race & ethnicity
- White 83% Two or more races 6% Native American 5% Hispanic / Latino 5% Asian 3%
- Common ancestry
- Portuguese 12% Scotch-Irish 3% Lithuanian 2%
- Foreign-born
- 4% · Canada, South Korea, Philippines
- Languages at home
- 93% English-only · Spanish 3% Other Asian/Pacific 1% German/W. Germanic 1%
Political lean MEDSL · Brown
- 2024 margin
- Strong R (+26.8) · D 35.6% · R 62.5% · Other 1.9%
- 2008→2024 swing
- -32.4pp toward R · 2008: 5.6pp · 2024: -26.8pp
- All cycles
- 2024: R+26.8 2020: R+23.0 2016: R+25.8 2012: R+6.7 2008: D+5.6
Not yet ingested
- Civics
- —
Market trends
- HPI YoY
- ▼ -224.77%
- Current HPI
- 185.713
- Rent YoY
- —
- Metro
- Aberdeen, SD
- State GDP YoY
- ▲ 0.70%
- F500 in state
- 2
Industry mix (Fortune 500 HQ in SD)
| Industry | F500 HQs | Revenue |
|---|---|---|
| Utilities | 1 | $1B |
|
||
Price history
+33.2% since first listed3 events — show timeline
- 2026-06-05 Listed $153,000 ABOR
- 2016-12-16 Sold (MLS) $110,000 ABOR
- 2016-11-17 Listed $114,900 ABOR
Property tax history
+2.1%/yrLatest (2025): $2,262 · +9.0% YoY. Source: county tax records.
Cash-flow waterfall
monthlySold comps — $/sqft
last 12 mo · ≤1 miLoading sold comps…