 Multi-family
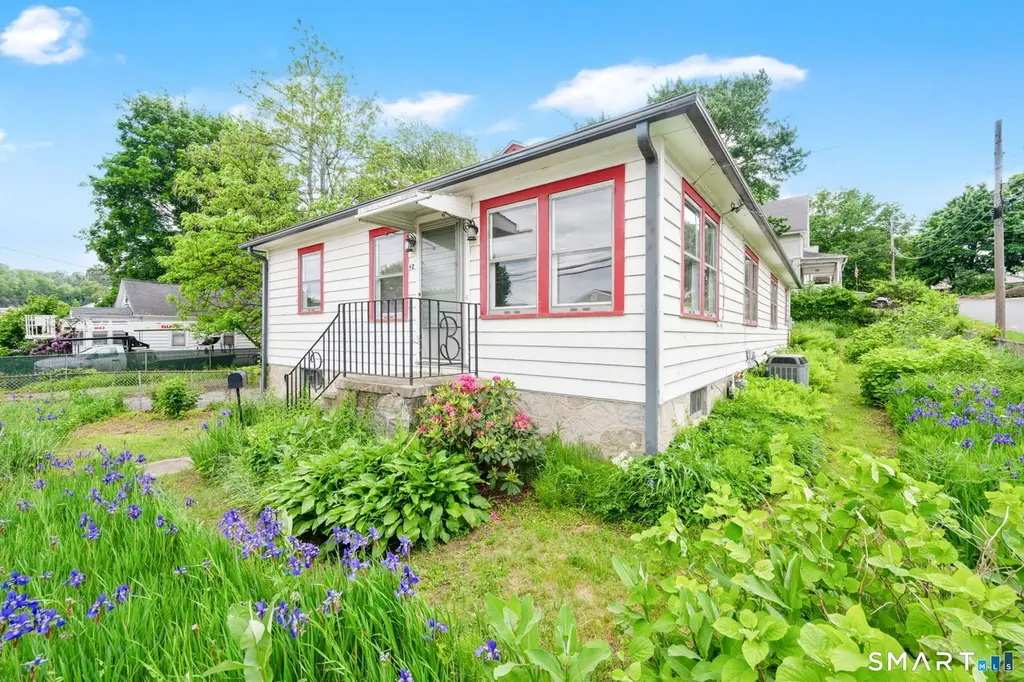
42 Bryan St · Waterbury, CT
Flood risk 1/10 · Minimal
- FEMA flood zone
- X (unshaded)
- Chance of flooding over 30 yrs
- 0.0%
- Est. flood insurance / yr
- $473 – $860
Fire risk 1/10 · Minimal
- Est. fire insurance / yr
- $829 – $1,539
Heat risk 5/10 · Moderate
- Hot days now (above 96°F)
- 7 days/yr
- Hot days in 30 yrs
- 15 days/yr
Wind risk 6/10 · Moderate
- Chance of severe wind over 30 yrs
- 27.0%
Air-quality risk 3/10 · Minor
- Unhealthy air days now
- 2 days/yr
- Unhealthy air days in 30 yrs
- 3 days/yr
Risk factors via First Street. Map © Google.
Why this score? — see what drove the B+ grade
The composite is a weighted blend of 9 inputs, each scored 0–100. Each bar is that input's sub-score; the figure is the points it added to the 100-point composite (weight × sub-score).
- Cash flow +28.9/30.0
- ARV discount +15.0/15.0
- 1% rule +10.0/10.0
- DSCR +10.0/10.0
- Livability +4.0/5.0
- Rent growth +3.3/5.0
- Condition / age +2.5/5.0
- Schools +1.5/10.0
- Appreciation +0.0/10.0
$239,900
🖨 Deal sheet (PDF) 📄 Offer letter ✓ Due diligence
Multi-family units
County records classify this as Multi-Family (2-4 Unit). Listing-text estimate: 1 unit. estimate disagrees with records
Listing remarks
Unique opportunity in this solidly built, one-level ranch located close to highway, shops and restaurants in the East End. Occupied by one multi-generational family since being built as a 2-family home, this property offers multiple opportunities with 3 bedrooms, 2 full baths and 2 kitchens. You can build a wall and have a 2-family with a 1-bedroom and a 2-bedroom apartment. Or use as is with a 1-bedroom in-law section with it's own kitchen and bath. Or combine the 2 kitchens to have a spacious 1-family layout. The interior boasts high ceilings, hardwood floors, large closets and built-in storage. Enjoy the benefits of a new gas furnace, 3-year old roof and central air conditioning. There's
Key facts
- One level ranch
- 2 kitchens
- 3 year old roof
Tags
Property features AI
Exterior
- Parking: Under-house garage; Paved driveway; 3 total parking spaces; 1 garage (attached under house)
- Utilities: Public water connected; Public sewer in street and septic; Natural gas service; Storm doors and storm windows
- Home design: Single-family home
- Construction: Frame construction with clapboard wood siding; Stone foundation; Asphalt shingle roof; White exterior color
- Exterior features: Enclosed porch and additional porch; Garden area; Chain link and full fencing; Corner lot with sloping terrain; Private paved driveway
Interior
- Kitchen: Refrigerator
- Bedrooms: 3 bedrooms
- Bathrooms: 2 full bathrooms
- Heating & cooling: Hot air heating fueled by natural gas; Central air conditioning; 40-gallon natural gas hot water tank
- Interior features: Automatic garage door opener; In-law apartment with first-floor access; Full unfinished walk-out basement with concrete floor, storage and garage access; Attic with floored, walk-up storage space; Central air
- Laundry & utility: Laundry on lower level
Neighborhood map
What this means for you Summary
Snapshot
- This is a 3-bed/2.0-bath multifamily listed at $240k.
Deal economics
- At list price, monthly cash flow is $815 ($10k/yr) — positive.
- The deal already cash-flows at list — no discount required.
- Meets the 1% rule at list price ($4k rent vs $240k).
- Cap rate 10.4% vs local median 3.6% in Waterbury — top-decile yield for the area; either an underpriced asset or a hidden risk that comps aren't pricing in. Stress-test before assuming the spread holds.
Location & tenants
- Location reads 79/100 on livability (#32 in CT, #2,205 nationally) — a middle-class / working-renter tenant base. Strengths: commute A+, cost of living A+, housing A+; Watch: crime D, employment D.
- Waterbury School District (suburban): math 12% / reading 23% proficiency, ranked #148 of 153 in CT (top 97%) — low school quality limits family demand, transient renter base, plan for 1-2y turnover; 73% free/reduced lunch — lower-income household profile, screen leases tightly.
- Zoned schools: Margaret M. Generali Elementary School (math 8% / reading 21%, grade F, #475 of 553 statewide, top 87%, 457 students, 77% FRL); Crosby High School (math 2% / reading 17%, grade F, #187 of 194 statewide, top 96%, 1,400 students, 84% FRL).
- Market conditions: Rents rising (+3.4%/yr); 82 active listings in the ZIP; 11 comparable units currently listed for rent nearby; rentals at typical pace (median 21d on market — plan ~3-4 weeks tenant-placement turnaround); 502 units permitted in Naugatuck Valley Planning Region in 2024 (171 in 5+ unit buildings).
- At $3,640/mo this rent would consume 81% of the median local household income ($54k/yr) (locally 1690% of renters already pay >50% of income on rent) — very limited rent-growth headroom before tenants either downsize or default.
Forward outlook
- Local home prices are declining (-3.0%/yr); year-one equity from $2k of loan paydown is wiped out by about $7k of value loss. Plan a longer hold.
- At projected returns (-3.0% appreciation + 3.4% rent growth), your $67k cash investment doubles in ~8 years — after that, you're playing with house money.
Negotiation context
- Only 9 days on market — expect competitive offers; lowballing is unlikely to land.
Risks & watch-outs
- Watch-outs: property tax is 3.5% of price; built in 1948 — expect roof / HVAC / electrical / plumbing capex.
- Climate carrying-cost: major wind risk, 27% chance of damaging wind over 30y; extreme-heat days projected 7→15/yr by 2055 (HVAC capex compounding) — expect insurance premiums to compound above CPI over the hold.
Questions for the listing agent
- Built in 1948 — when were the roof, HVAC, electrical panel, plumbing, and water heater last replaced?
- Property tax is high relative to price — has the assessment been appealed recently, and will the sale trigger a re-assessment?
- Is there a deadline driving the sale (1031 exchange, divorce, estate, relocation)? That informs how much negotiation room exists.
- Schools are D-rated, which usually means shorter tenancies and higher turnover. Who's the typical renter profile here, and what's been the actual vacancy rate?
- Crime grade is D in this area — have there been break-ins, vandalism, or insurance claims at this property in the last 3 years? What carrier currently insures it and at what premium?
- What's the average days-on-market for RENTAL listings here right now (not sales)? A rising rental-DOM trend means longer vacancies and softer asking-rent achievability than the comps imply.
- What's the recent tenant-quality profile in this submarket — average credit score on applications, eviction rate, late-payment / NSF rate, and stable-employment percentage? A property-management company in the area should have these aggregated.
- How much new apartment / multifamily construction is in the pipeline within 1–3 miles? Heavy new supply (>2% of stock underway) typically softens rents 12–24 months out; light construction supports rent growth.
Investment metrics
- 1% rule
- 1.52% ✓
- Cap rate
- 10.37%
- Cash-on-cash
- 14.55%
- DSCR
- 1.65
- GRM
- 5.5
CMA / ARV
- ARV (on-the-fly)
- $399,330
- Comps found
- 2
Show comp detail 2 sales within ~0.75 mi
| Address | Dist | Beds/Ba | Sqft | Sold | Price | $/sf | Match |
|---|---|---|---|---|---|---|---|
| 2773 E Main St | 0.39mi | 4/2.0 (+1) | 1,600 (+2%) | 24mo | $295,000 | $184 | 54 |
| 171 Moreland Ave | 0.63mi | 4/2.5 (+1) | 1,400 (-11%) | 22mo | $357,000 | $255 | 28 |
Match score weights: distance 35% · size 25% · config 20% · recency 20%. Top-matched comps best support the ARV.
Projected returns pro-forma
-3.0% appreciation · 3.37% rent growth · sell at horizon
- IRR
- 5.6%
- Equity multiple
- 1.22×
- Total profit
- $14,670
- Equity at exit
- $35,770
- IRR
- 15.5%
- Equity multiple
- 2.29×
- Total profit
- $86,432
- Equity at exit
- $20,742
Cash invested: $67,172 (down + closing). Projections, not guarantees.
Landlord ↔ Tenant lean methodology
- Overall (STATE)
- 27 Tenant-Leaning
- State Connecticut
- 27 Tenant-Leaning · D+7
- County
- — inherits STATE
- City
- — inherits STATE
ZIP-level market 06705
- Home prices YoY
- -11.0%
- Rents YoY
- 3.4%
- Active inventory
- 82
- Price-to-rent
- 11.0×
Monthly cashflow live
- Estimated rent
- $3,640 high interval (Pro) →
- Mortgage (P&I)
- −$1,258
- Tax from tax record
- −$703 /mo · $8,436/yr
- Insurance
- −$100
- HOA
- −$0
- Vacancy / Maint / Mgmt
- −$764
- Net cashflow
- $815
Break-even live
Sensitivity live
| Price | -10% $950 | -5% $882 | +0% $815 | +5% $747 | +10% $679 |
|---|---|---|---|---|---|
| Rent | -10% $527 | -5% $671 | +0% $815 | +5% $958 | +10% $1,102 |
| Rate | -1.0pp $935 | -0.5pp $876 | base $815 | +0.5pp $752 | +1.0pp $689 |
2-unit breakdown (identical units grouped — click to expand)
| Units | Beds | Baths | Est. rent |
|---|---|---|---|
| 2× units | 3 | 2 | $3,640 |
| #1 | 3 | 2 | $1,820 |
| #2 | 3 | 2 | $1,820 |
| Total (2 units) | $3,640 | ||
UW: 25.0% down · 7.5% · 30yr · 1.5% tax · 5.0% vac · 8.0% maint · 8.0% mgmt
Financing live
Cash to close
- Down payment
- $59,975
- Closing costs
- $7,197
- Reserves months
- —
- Total cash needed
- —
Loan-product check · same deal, 3 products live
Conventional
25% down · 7.5% · 30yr
- Down + closing
- —
- Monthly P&I
- —
- Monthly cashflow
- —
- DSCR
- —
- Eligible?
- —
Personal DTI + credit; lowest rate.
DSCR
20% down · 8.5% · 30yr
- Down + closing
- —
- Monthly P&I
- —
- Monthly cashflow
- —
- DSCR
- —
- Eligible?
- —
No personal income docs; deal must DSCR.
Hard money
10% down · 12.0% · 12mo
- Down + closing
- —
- Monthly P&I
- —
- Monthly cashflow
- —
- DSCR
- —
- Eligible?
- —
Short-term bridge; refi at stabilization.
Rent comps 11 comps
| Address | Beds | Baths | Sqft | Rent | $/sqft | DOM | Units | Dist |
|---|---|---|---|---|---|---|---|---|
| 82 Middlefield Ave Unit 2nd Floor Waterbury, CT | 3.0 | 1.0 | 1216 | $1,900 | $1.56 | 22d | 1 | 0.42mi |
| 174 Stonefield Dr #41 Waterbury, CT | 3.0 | 1.5 | 1354 | $2,450 | $1.81 | 4d | 1 | 0.59mi |
| 300 Schraffts Dr Waterbury, CT | 1.0–2.0 | 1.0–2.0 | 1075 | $1,850 | $1.72 | 3d | 2 | 0.60mi |
| 188 Moreland Ave Waterbury, CT | 2.0 | 1.0 | 1838 | $1,750 | $0.95 | 3d | 1 | 0.67mi |
| 75 Alma St Waterbury, CT | 3.0 | 1.0 | 1143 | $1,850 | $1.62 | 45d | 1 | 0.69mi |
| 88 Farrell Rd Waterbury, CT | 2.0 | 1.0 | 1568 | $1,700 | $1.08 | 24d | 1 | 0.74mi |
| 81 Woodtick Rd Unit 1 Waterbury, CT | 2.0 | 1.0 | 1902 | $1,200 | $0.63 | 15d | 1 | 0.92mi |
| 18 Manchester Ave Waterbury, CT | 3.0 | 1.5 | 1074 | $3,000 | $2.79 | 22d | 1 | 1.10mi |
| 22 Leaf Ave Unit 2nd Floor Waterbury, CT | 2.0 | 1.0 | 1200 | $1,650 | $1.38 | 3d | 1 | 1.14mi |
| 87 Worcester Ave Waterbury, CT | 3.0 | 1.0 | 1252 | $2,300 | $1.84 | 20d | 1 | 1.18mi |
| 29 Bouley Ave Waterbury, CT | 4.0 | 1.0 | 1267 | $3,000 | $2.37 | 45d | 1 | 1.20mi |
Listing history 6 events
-
2026-06-07statusdays on market $239,900 Under Contract 9 DOM
-
2026-06-05days on market $239,900 Active 6 DOM
-
2026-06-03days on market $239,900 Active 5 DOM
-
2026-06-03days on market $239,900 Active 4 DOM
-
2026-06-01days on market $239,900 Active 3 DOM
-
2026-05-31days on market $239,900 Active 2 DOM
ⓘ Source: listings_history table (triggers on properties + properties_extension) + one-shot
backfill from property_details.listing_events for pre-trigger history.
Tax reassessment forecast CT · Partial reset (capped growth)
- Current annual tax
- $8,436 · $703/mo
- Projected year-2 tax
- $8,436 · $703/mo
- Expected delta
- $0/yr ($0/mo · 0.0%)
ⓘ Screening estimate from a state-policy table — verify with the county assessor before closing.
Climate risk First Street
- Flood 1/10 Low FEMA zone X (unshaded) · 0% chance over 30 yrs
- Wildfire 1/10 Low
- Heat 5/10 Major 7 d/yr ≥96°F today · 15 d/yr by 30 yrs out
- Wind 6/10 Major 27% chance of damaging wind over 30 yrs
- Air quality 3/10 Moderate 2 unhealthy d/yr today · 3 by 30 yrs out
Nearby sold comps map
Loading sold comps map…
Walkable amenities ~0.75 mi
Loading nearby amenities…
Taxation est. · year 1
- Rental income
- $43,680
- − Mortgage interest
- −$13,438
- − Property taxes
- −$8,436
- − Insurance
- −$1,200
- − Repairs & maintenance
- −$3,494
- − Management
- −$3,494
- − Depreciation
- −$6,979
- Taxable income
- $6,639
- Est. tax owed @ 24.0%
- −$1,593
- After-tax cash flow
- $8,182/yr
For passive investors: Depreciation is non-cash, so a rental often shows a tax loss while cash-flowing — sheltering income. Rental losses are passive: they offset passive income freely, and up to $25,000/yr can offset ordinary (W-2) income if you actively participate and your MAGI is under $100k (phasing out to $0 by $150k); unused losses carry forward. On sale, claimed depreciation is recaptured at up to 25%, and gains may owe capital-gains tax (a 1031 exchange can defer both). Figures are a year-1 estimate at your 24.0% rate — not tax advice; consult a CPA.
Schools (NCES district)
- District
- Waterbury School District
- NCES district ID
- 0904830
- Math proficiency
- 12% ▼ -7.00%
- Reading proficiency
- 23% ▼ -8.00%
- Median HH income
- $40,040
- Composite
- 14.85/100
- National rank
- #9380
- State rank
- #148 of 153 in CT
Livability — Waterbury
- Score
- 79/100
- State rank
- #32
- US rank
- #2205
Category grades
Schools grade is shown separately in the Schools card above.
Census & demographics
- Census place
- Waterbury, CT
- County
- New Haven County · 688,236 people
- City population
- 115,012
- Metro
- New Haven-Milford, CT
- Population (ZIP)
- 25,266
- Household income
- $53,954
- Rent vs Own
- Severe rent burden
- 1690.0
Population outlook (Naugatuck Valley County) Hauer SSP2
- By 2040
- 496,846
Race, ethnicity, and origin ACS 2023
- Neighborhood character
- Highly diverse neighborhood (Simpson 0.71)
- Race & ethnicity
- White 34% Hispanic / Latino 34% Black 22% Two or more races 14% Asian 4%
- Hispanic origin (detail)
- Mexican 2% Puerto Rican 22% Dominican 3%
- Common ancestry
- Lithuanian 6% Hispanic 3% Romanian 2%
- Foreign-born
- 19% · Canada, Jamaica, China
- Languages at home
- 66% English-only · Spanish 22% Other Indo-European 6% French/Haitian/Cajun 3%
Political lean MEDSL · Naugatuck Valley
- 2024 margin
- Lean R (+7.4) · D 45.6% · R 53.0% · Other 1.4%
- All cycles
- 2024: R+7.4
Not yet ingested
- Civics
- —
Market trends
- HPI YoY
- ▼ -37.50%
- Current HPI
- 304.4948
- Rent YoY
- ▲ 3.37%
- Metro
- New Haven-Milford, CT
- State GDP YoY
- ▲ 1.06%
- F500 in state
- 38
Industry mix (Fortune 500 HQ in CT)
| Industry | F500 HQs | Revenue |
|---|---|---|
| Industrial Machinery | 4 | $38B |
|
||
| Insurance | 3 | $71B |
|
||
| Financial Services | 2 | $25B |
|
||
| Transportation / Logistics | 2 | $18B |
|
||
| Healthcare | 1 | $247B |
|
||
| Telecommunications | 1 | $55B |
|
||
Price history
1 event — show timeline
- 2026-05-25 Listed $239,900 Smart MLS
Property tax history
+4.7%/yrLatest (2023): $8,436 · +58.7% YoY. Source: county tax records.
Cash-flow waterfall
monthlySold comps — $/sqft
last 12 mo · ≤1 miLoading sold comps…