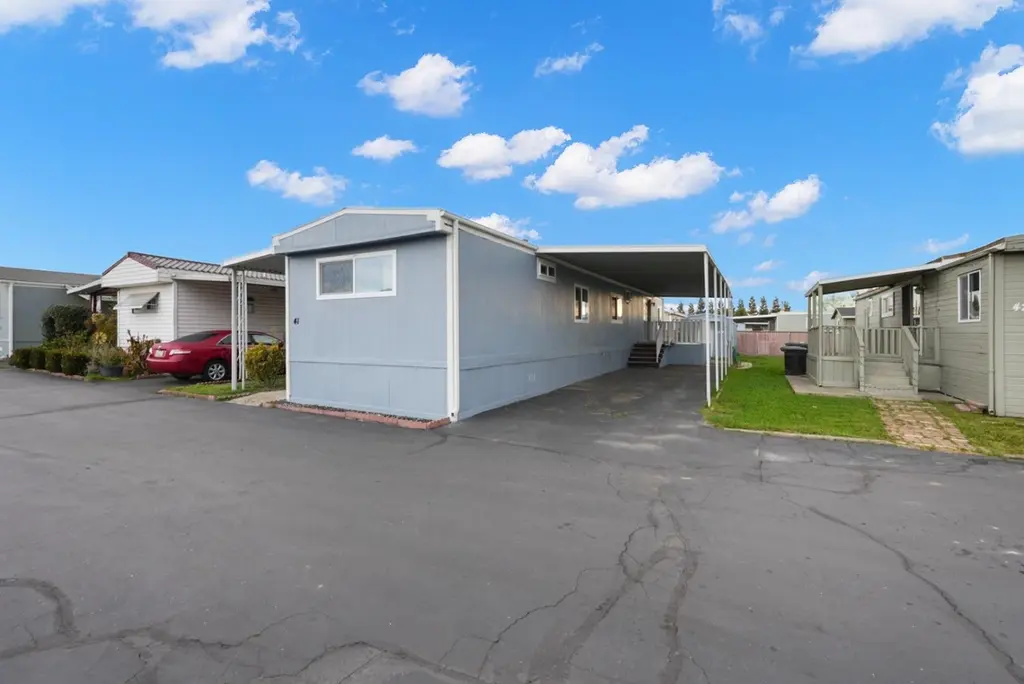
7341 Eleanor Ave #41 · Riverbank, CA
Flood risk 1/10 · Minimal
- FEMA flood zone
- X (unshaded)
- Chance of flooding over 30 yrs
- 0.0%
- Est. flood insurance / yr
- $507 – $1,088
Fire risk 7/10 · Major
- Est. fire insurance / yr
- $659 – $1,223
Heat risk 7/10 · Major
- Hot days now (above 102°F)
- 7 days/yr
- Hot days in 30 yrs
- 15 days/yr
Wind risk 1/10 · Minimal
- Chance of severe wind over 30 yrs
- —
Air-quality risk 10/10 · Severe
- Unhealthy air days now
- 36 days/yr
- Unhealthy air days in 30 yrs
- 39 days/yr
Risk factors via First Street. Map © Google.
Why this score? — see what drove the B- grade
The composite is a weighted blend of 9 inputs, each scored 0–100. Each bar is that input's sub-score; the figure is the points it added to the 100-point composite (weight × sub-score).
- Cash flow +30.0/30.0
- 1% rule +10.0/10.0
- DSCR +10.0/10.0
- ARV discount +7.5/15.0
- Condition / age +4.0/5.0
- Livability +2.9/5.0
- Rent growth +2.5/5.0
- Schools +2.1/10.0
- Appreciation +0.0/10.0
$99,000
🖨 Deal sheet (PDF) 📄 Offer letter ✓ Due diligence
Listing remarks
Welcome to Lazy B Mobile Home Park! This updated 3-bedroom, 2-bath Champion manufactured home offers 924 square feet of comfortable living space. Built in 1983, the home has been thoughtfully updated within the last two years and is move in ready. Inside, you'll find a functional layout with a bright living area, updated finishes, and plenty of space for everyday living. The three bedrooms and two full bathrooms provide flexibility for families, guests, or a home office. Located in the peaceful Lazy B Mobile Home Park, this home offers an affordable opportunity to enjoy comfortable living in a convenient location close to shopping, dining, and other local amenities. Schedule your showing to
Key facts
- 2 parking spots
- Built 1983
- Listed 31 days
Property features AI
Finance
- Financial info: Land lease: No (listing includes a land lease amount of $835 — contact broker for details)
- HOA & community: No association
Exterior
- Parking: Covered parking
- Utilities: Individual gas meter; 220V in kitchen; Septic system; Well water
- Home design: Manufactured home in park; Single-wide; Champion manufactured unit; Built in 1983
- Construction: Wood skirting
- Exterior features: Backyard; Other yard features; Shingle/other roof
Interior
- Kitchen: Free standing gas range; Dishwasher; Microwave
- Bedrooms: 3 bedrooms
- Flooring: Other flooring
- Bathrooms: 2 full bathrooms; Tub with shower over; Shower stall(s)
- Heating & cooling: Central heating; Wall unit(s) for cooling
- Interior features: Great room living area; Kitchen/family room combo; Breakfast area and pantry cabinet
- Laundry & utility: Electric hookup for laundry inside the home
Neighborhood map
What this means for you Summary
Snapshot
- This is a 3-bed/2.0-bath manufactured listed at $99k. Condition is rated good.
Deal economics
- At list price, monthly cash flow is $1k ($15k/yr) — positive.
- The deal already cash-flows at list — no discount required.
- Meets the 1% rule at list price ($2k rent vs $99k).
- Recommended offer: $96k (3.0% below list) — sets the bar for market timing.
- Cap rate 21.1% vs local median 3.0% in Riverbank — top-decile yield for the area; either an underpriced asset or a hidden risk that comps aren't pricing in. Stress-test before assuming the spread holds.
Location & tenants
- Location reads 57/100 on livability (#757 in CA) — a working-class tenant base; expect higher turnover. Strengths: housing A+, crime B+, employment B; Watch: schools F, amenities D-, commute F.
- Riverbank Unified (suburban): math 16% / reading 32% proficiency, ranked #424 of 517 in CA (top 82%) — low school quality limits family demand, transient renter base, plan for 1-2y turnover; 68% free/reduced lunch — lower-income household profile, screen leases tightly.
- Market conditions: 199 active listings in the ZIP; 2 comparable units currently listed for rent nearby; solid renter incomes; 923 units permitted in Stanislaus County in 2024 (63 in 5+ unit buildings).
- This rent runs 31% of the median local income ($93k/yr) — at the standard rent-burdened threshold; future hikes will face affordability resistance.
Forward outlook
- Local home prices are declining (-3.0%/yr); year-one equity from $684 of loan paydown is wiped out by about $3k of value loss. Plan a longer hold.
- Stanislaus County population projected at +14% by 2050 — modest demand growth; plan on rents tracking national, not racing it.
- At projected returns (-3.0% appreciation + 3.0% rent growth), your $28k cash investment doubles in ~3 years — after that, you're playing with house money.
Negotiation context
- It's been on market 31 days — a 3% lower offer ($96k) is reasonable based on typical stale-listing flexibility.
Risks & watch-outs
- Climate carrying-cost: major wildfire risk; extreme-heat days projected 7→15/yr by 2055 (HVAC capex compounding) — expect insurance premiums to compound above CPI over the hold.
Questions for the listing agent
- It's been on market 31 days. Have you received any prior offers? Is the seller open to a 3% concession, seller financing, or rate buy-down credit?
- Is there a deadline driving the sale (1031 exchange, divorce, estate, relocation)? That informs how much negotiation room exists.
- Schools are F-rated, which usually means shorter tenancies and higher turnover. Who's the typical renter profile here, and what's been the actual vacancy rate?
- What's the average days-on-market for RENTAL listings here right now (not sales)? A rising rental-DOM trend means longer vacancies and softer asking-rent achievability than the comps imply.
- What's the recent tenant-quality profile in this submarket — average credit score on applications, eviction rate, late-payment / NSF rate, and stable-employment percentage? A property-management company in the area should have these aggregated.
- How much new for-sale + rental construction is in the pipeline within 1–3 miles? Heavy new supply typically softens prices + rents 12–24 months out; constrained supply supports both.
Investment metrics
- 1% rule
- 2.43% ✓
- Cap rate
- 21.08%
- Cash-on-cash
- 52.81%
- DSCR
- 3.35
- GRM
- 3.4
CMA / ARV
No comps found within radius.
Projected returns pro-forma
-3.0% appreciation · 3.0% rent growth · sell at horizon
- IRR
- 50.8%
- Equity multiple
- 3.23×
- Total profit
- $61,688
- Equity at exit
- $14,761
- IRR
- 56.2%
- Equity multiple
- 6.55×
- Total profit
- $153,907
- Equity at exit
- $8,560
Cash invested: $27,720 (down + closing). Projections, not guarantees.
Landlord ↔ Tenant lean methodology
- Overall (STATE)
- 18 Strongly Tenant-Friendly
- State California
- 18 Strongly Tenant-Friendly · D+13
- County
- — inherits STATE
- City
- — inherits STATE
ZIP-level market 95361
- Active inventory
- 199
- Price-to-rent
- 3.4×
Monthly cashflow live
- Estimated rent
- $2,410 medium interval (Pro) →
- Mortgage (P&I)
- −$519
- Tax est. 1.5%
- −$124 /mo · $1,485/yr
- Insurance
- −$41
- HOA
- −$0
- Vacancy / Maint / Mgmt
- −$506
- Net cashflow
- $1,220
Break-even live
Sensitivity live
| Price | -10% $1,288 | -5% $1,254 | +0% $1,220 | +5% $1,186 | +10% $1,151 |
|---|---|---|---|---|---|
| Rent | -10% $1,029 | -5% $1,125 | +0% $1,220 | +5% $1,315 | +10% $1,410 |
| Rate | -1.0pp $1,270 | -0.5pp $1,245 | base $1,220 | +0.5pp $1,194 | +1.0pp $1,168 |
UW: 25.0% down · 7.5% · 30yr · 1.5% tax · 5.0% vac · 8.0% maint · 8.0% mgmt
Financing live
Cash to close
- Down payment
- $24,750
- Closing costs
- $2,970
- Reserves months
- —
- Total cash needed
- —
Loan-product check · same deal, 3 products live
Conventional
25% down · 7.5% · 30yr
- Down + closing
- —
- Monthly P&I
- —
- Monthly cashflow
- —
- DSCR
- —
- Eligible?
- —
Personal DTI + credit; lowest rate.
DSCR
20% down · 8.5% · 30yr
- Down + closing
- —
- Monthly P&I
- —
- Monthly cashflow
- —
- DSCR
- —
- Eligible?
- —
No personal income docs; deal must DSCR.
Hard money
10% down · 12.0% · 12mo
- Down + closing
- —
- Monthly P&I
- —
- Monthly cashflow
- —
- DSCR
- —
- Eligible?
- —
Short-term bridge; refi at stabilization.
Rent comps 2 comps
| Address | Beds | Baths | Sqft | Rent | $/sqft | DOM | Units | Dist |
|---|---|---|---|---|---|---|---|---|
| 4516 Santa Fe St Riverbank, CA | 3.0 | 2.0 | 1122 | $2,250 | $2.01 | 14d | 1 | 0.74mi |
| 4408 Santa Fe St Riverbank, CA | 3.0 | 2.0 | 1122 | $2,250 | $2.01 | 14d | 1 | 0.78mi |
Listing history 16 events
-
2026-06-18days on market $99,000 Active 31 DOM
-
2026-06-17days on market $99,000 Active 30 DOM
-
2026-06-16days on market $99,000 Active 29 DOM
-
2026-06-15days on market $99,000 Active 28 DOM
-
2026-06-14days on market $99,000 Active 26 DOM
-
2026-06-13days on market $99,000 Active 25 DOM
-
2026-06-10days on market $99,000 Active 23 DOM
-
2026-06-09days on market $99,000 Active 22 DOM
-
2026-06-08days on market $99,000 Active 21 DOM
-
2026-06-07days on market $99,000 Active 20 DOM
-
2026-06-05days on market $99,000 Active 17 DOM
-
2026-06-03days on market $99,000 Active 16 DOM
-
2026-06-02days on market $99,000 Active 15 DOM
-
2026-06-01days on market $99,000 Active 14 DOM
-
2026-05-31days on market $99,000 Active 13 DOM
-
2026-05-30days on market $99,000 Active 12 DOM
ⓘ Source: listings_history table (triggers on properties + properties_extension) + one-shot
backfill from property_details.listing_events for pre-trigger history.
Climate risk First Street
- Flood 1/10 Low FEMA zone X (unshaded) · 0% chance over 30 yrs
- Wildfire 7/10 Severe
- Heat 7/10 Severe 7 d/yr ≥102°F today · 15 d/yr by 30 yrs out
- Wind 1/10 Low
- Air quality 10/10 Extreme 36 unhealthy d/yr today · 39 by 30 yrs out
Nearby sold comps map
Loading sold comps map…
Walkable amenities ~0.75 mi
Loading nearby amenities…
Taxation est. · year 1
- Rental income
- $28,922
- − Mortgage interest
- −$5,546
- − Property taxes
- −$1,485
- − Insurance
- −$495
- − Repairs & maintenance
- −$2,314
- − Management
- −$2,314
- − Depreciation
- −$2,880
- Taxable income
- $13,889
- Est. tax owed @ 24.0%
- −$3,333
- After-tax cash flow
- $11,305/yr
For passive investors: Depreciation is non-cash, so a rental often shows a tax loss while cash-flowing — sheltering income. Rental losses are passive: they offset passive income freely, and up to $25,000/yr can offset ordinary (W-2) income if you actively participate and your MAGI is under $100k (phasing out to $0 by $150k); unused losses carry forward. On sale, claimed depreciation is recaptured at up to 25%, and gains may owe capital-gains tax (a 1031 exchange can defer both). Figures are a year-1 estimate at your 24.0% rate — not tax advice; consult a CPA.
Condition & rehab AI · 12 photos
This updated 3-bedroom, 2-bath Champion manufactured home in Lazy B Mobile Home Park is move-in ready with fresh paint and updated finishes. It offers a good condition score and is ready for a new owner.
Value-add opportunities
- Both paint exterior — enhances curb appeal and value
- Both landscaping — improves curb appeal and rental value
- Both replace sliding glass doors — increases natural light and value
Renovation cost estimate screening
Value-add ROI direction
- Both paint exterior — enhances curb appeal and value ↑
- Both landscaping — improves curb appeal and rental value ↑
- Both replace sliding glass doors — increases natural light and value ↑
ⓘ Cost ranges are severity-bucket heuristics (US national rule-of-thumb). Get contractor quotes + a written scope before underwriting a rehab budget.
Schools (NCES district)
- District
- Riverbank Unified
- NCES district ID
- 0600061
- Math proficiency
- 16% ▼ -11.00%
- Reading proficiency
- 32% ▼ -7.00%
- Median HH income
- $46,066
- Composite
- 20.79/100
- National rank
- #8511
- State rank
- #424 of 517 in CA
Livability — Riverbank
- Score
- 57/100
- State rank
- #757
- US rank
- #22107
Category grades
Schools grade is shown separately in the Schools card above.
Census & demographics
- County
- Stanislaus County · 445,786 people
- City population
- 25,593
- Metro
- Modesto, CA
- Population (ZIP)
- 34,810
- Household income
- $92,963
- Rent vs Own
- Severe rent burden
- 1276.0
Population outlook (Stanislaus County) Hauer SSP2
- Today (2025)
- 579,493 people
- By 2030
- 598,000 · +3.2%
- By 2040
- 630,930 · +8.9%
- By 2050
- 658,300 · +13.6%
- By 2075
- 712,363 · +22.9%
- By 2100
- 719,805 · +24.2%
Race, ethnicity, and origin ACS 2023
- Neighborhood character
- Majority White (61%)
- Race & ethnicity
- White 61% Hispanic / Latino 30% Two or more races 18% Asian 2%
- Hispanic origin (detail)
- Mexican 25%
- Common ancestry
- Russian 5% Italian 4% Iranian 2%
- Foreign-born
- 11% · Canada, China
- Languages at home
- 80% English-only · Spanish 18% German/W. Germanic 1% Other Indo-European 1%
Political lean MEDSL · Stanislaus
- 2024 margin
- R (+11.0) · D 43.2% · R 54.2% · Other 2.6%
- 2008→2024 swing
- -12.7pp toward R · 2008: 1.7pp · 2024: -11.0pp
- All cycles
- 2024: R+11.0 2020: D+0.8 2016: D+0.6 2012: D+0.7 2008: D+1.7
Not yet ingested
- Civics
- —
Market trends
- HPI YoY
- ▼ -507.52%
- Current HPI
- 283.0924
- Rent YoY
- —
- Metro
- Modesto, CA
- State GDP YoY
- ▲ 3.21%
- F500 in state
- 116
Industry mix (Fortune 500 HQ in CA)
| Industry | F500 HQs | Revenue |
|---|---|---|
| Technology | 27 | $1,492B |
|
||
| Financial Services | 3 | $174B |
|
||
| Retail | 3 | $44B |
|
||
| Insurance | 3 | $26B |
|
||
| Media / Entertainment | 2 | $115B |
|
||
| Pharmaceuticals / Biotech | 2 | $62B |
|
||
Cash-flow waterfall
monthlySold comps — $/sqft
last 12 mo · ≤1 miLoading sold comps…