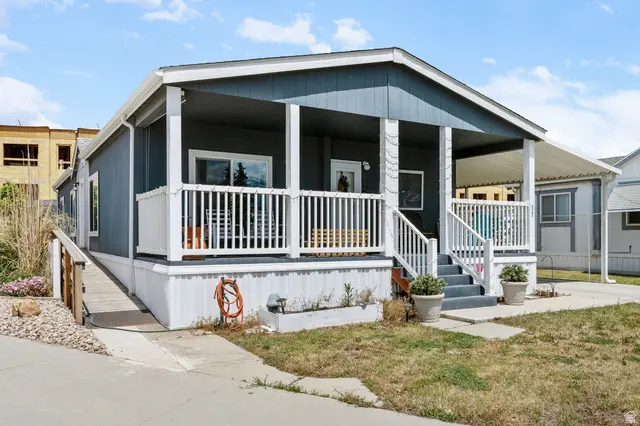
150 W 7500 S #13 · Midvale, UT
Flood risk 1/10 · Minimal
- FEMA flood zone
- X (unshaded)
- Chance of flooding over 30 yrs
- 0.0%
- Est. flood insurance / yr
- $507 – $1,088
Fire risk 1/10 · Minimal
- Est. fire insurance / yr
- $453 – $841
Heat risk 4/10 · Minor
- Hot days now (above 95°F)
- 7 days/yr
- Hot days in 30 yrs
- 18 days/yr
Wind risk 1/10 · Minimal
- Chance of severe wind over 30 yrs
- —
Air-quality risk 3/10 · Minor
- Unhealthy air days now
- 3 days/yr
- Unhealthy air days in 30 yrs
- 5 days/yr
Risk factors via First Street. Map © Google.
Why this score? — see what drove the C- grade
The composite is a weighted blend of 9 inputs, each scored 0–100. Each bar is that input's sub-score; the figure is the points it added to the 100-point composite (weight × sub-score).
- Cash flow +16.2/30.0
- 1% rule +9.4/10.0
- ARV discount +7.5/15.0
- DSCR +5.0/10.0
- Schools +4.6/10.0
- Livability +4.0/5.0
- Condition / age +2.5/5.0
- Rent growth +2.4/5.0
- Appreciation +0.0/10.0
$155,000
🖨 Deal sheet (PDF) 📄 Offer letter ✓ Due diligence
Listing remarks
Tucked into a quaint and welcoming 55+ community in Midvale, this spacious newer doublewide offers comfortable living with a modern feel and thoughtful finishes throughout. Built in 2019, the home features an open-concept layout filled with natural light, creating an inviting space perfect for both relaxing and entertaining. Stylish finishes, generous living areas, and a well-designed floor plan make this home feel both functional and refined. The spacious kitchen flows seamlessly into the main living area, while the private primary suite provides a peaceful retreat from the day. With newer construction, buyers can enjoy the benefits of updated systems, contemporary design, and low-maintena
Key facts
- Newer construction
- Open-concept layout
- Parking
Tags
Property features AI
Finance
- Other: Subdivision: APPLEWOOD; Zoning: TOD
- HOA & community: Homeowners association (PMSI); Monthly association fee of $615; Association covers sewer, trash, and water; Community permits pets and has pet rules; Snow removal provided
Exterior
- Parking: Covered parking; Uncovered parking; Carport (1 space); Total of 1 parking space
- Utilities: Natural gas connected; Electricity connected; Sewer connected; Culinary (municipal) water
- Home design: Mobile home style; Built and currently standing (effective year 2019); Facing south
- Construction: Clapboard/Masonite siding; Asphalt roof; Built/standing construction; Effective year built 2019
- Exterior features: Partially fenced lot; Paved road access; Storage shed(s); Window coverings; Faces south; Flat terrain
Interior
- Kitchen: Range/oven (free standing); Garbage disposal
- Bedrooms: Three main-level bedrooms; Primary bedroom on the 1st floor
- Flooring: Carpet
- Bathrooms: Two full bathrooms
- Heating & cooling: Gas central heating; Central air conditioning
- Interior features: Primary bath; Walk-in closet; Garbage disposal; Free-standing range/oven; Blinds; Ceiling fan
- Laundry & utility: Electric dryer hookup
Neighborhood map
What this means for you Summary
Snapshot
- This is a 3-bed/2.0-bath manufactured listed at $155k.
Deal economics
- At list price, monthly cash flow is $81 ($972/yr) — positive.
- The deal already cash-flows at list — no discount required.
- Meets the 1% rule at list price ($2k rent vs $155k).
- Recommended offer: $150k (3.0% below list) — sets the bar for market timing.
Location & tenants
- Location reads 80/100 on livability (#35 in UT, #1,704 nationally) — a professional / high-income tenant draw. Strengths: amenities A+, commute A+, housing A+.
- Canyons District (suburban): math 49% / reading 53% proficiency, ranked #12 of 80 in UT (top 15%) — acceptable for families but not a draw, mixed tenant base, ~2y average lease.
- Zoned schools: Midvale School (math 17% / reading 17%, grade F, #542 of 585 statewide, top 93%, 722 students, 99% FRL); Midvale Middle (math 24% / reading 28%, grade F, #119 of 138 statewide, top 87%, 907 students, 98% FRL); Hillcrest High (math 23% / reading 50%, grade F, #86 of 171 statewide, top 52%, 2,296 students, 37% FRL) — zoned schools average 78% FRL vs 27% district-wide (51 pts higher); higher-poverty schools than district average — tighter screening recommended.
- Zoned-school proficiency averages 26% at this address vs 51% district-wide (-24 pts) — the specific schools serving this property underperform the Canyons District average; the district grade overstates school quality for this exact location.
- Market conditions: Rents soft (-0.3%/yr); 208 active listings in the ZIP; 40 comparable units currently listed for rent nearby; rentals leasing fast (median 6d on market — plan ~1-2 weeks tenant-placement turnaround); solid renter incomes; 4,970 units permitted in Salt Lake County in 2024 (1,963 in 5+ unit buildings).
- This rent runs 35% of the median local income ($76k/yr) — at the standard rent-burdened threshold; future hikes will face affordability resistance.
Forward outlook
- Local home prices are declining (-3.0%/yr); year-one equity from $1k of loan paydown is wiped out by about $5k of value loss. Plan a longer hold.
- Salt Lake County population projected at +37% by 2050 — long-run rental-demand tailwind backs the buy-and-hold thesis.
Negotiation context
- It's been on market 31 days — a 3% lower offer ($150k) is reasonable based on typical stale-listing flexibility.
- 4 sale attempts since 13y ago with the ask held roughly flat each time — persistent listings suggest the price (not the market) is what's stuck; bring a comps-based counter.
Risks & watch-outs
- Watch-outs: HOA is 27% of rent.
Questions for the listing agent
- It's been on market 31 days. Have you received any prior offers? Is the seller open to a 3% concession, seller financing, or rate buy-down credit?
- What does the HOA fee cover, when was the last increase, and are there any pending special assessments or reserve-fund shortfalls?
- Is there a deadline driving the sale (1031 exchange, divorce, estate, relocation)? That informs how much negotiation room exists.
- Schools are D-rated, which usually means shorter tenancies and higher turnover. Who's the typical renter profile here, and what's been the actual vacancy rate?
- What's the average days-on-market for RENTAL listings here right now (not sales)? A rising rental-DOM trend means longer vacancies and softer asking-rent achievability than the comps imply.
- What's the recent tenant-quality profile in this submarket — average credit score on applications, eviction rate, late-payment / NSF rate, and stable-employment percentage? A property-management company in the area should have these aggregated.
- How much new for-sale + rental construction is in the pipeline within 1–3 miles? Heavy new supply typically softens prices + rents 12–24 months out; constrained supply supports both.
Investment metrics
- 1% rule
- 1.44% ✓
- Cap rate
- 6.92%
- Cash-on-cash
- 2.24%
- DSCR
- 1.10
- GRM
- 5.8
CMA / ARV
No comps found within radius.
Projected returns pro-forma
-3.0% appreciation · 0.0% rent growth · sell at horizon
- IRR
- -17.8%
- Equity multiple
- 0.40×
- Total profit
- $-26,101
- Equity at exit
- $23,111
- IRR
- -23.2%
- Equity multiple
- 0.08×
- Total profit
- $-39,747
- Equity at exit
- $13,402
Cash invested: $43,400 (down + closing). Projections, not guarantees.
Landlord ↔ Tenant lean methodology
- Overall (STATE)
- 86 Strongly Landlord-Friendly
- State Utah
- 86 Strongly Landlord-Friendly · R+15
- County
- — inherits STATE
- City
- — inherits STATE
ZIP-level market 84047
- Rents YoY
- -0.3%
- Active inventory
- 208
- Price-to-rent
- 5.8×
Monthly cashflow live
- Estimated rent
- $2,237 high interval (Pro) →
- Mortgage (P&I)
- −$813
- Tax est. 1.5%
- −$194 /mo · $2,325/yr
- Insurance
- −$65
- HOA
- −$615
- Vacancy / Maint / Mgmt
- −$470
- Net cashflow
- $81
Break-even live
Sensitivity live
| Price | -10% $188 | -5% $135 | +0% $81 | +5% $27 | +10% $-26 |
|---|---|---|---|---|---|
| Rent | -10% $-96 | -5% $-7 | +0% $81 | +5% $169 | +10% $258 |
| Rate | -1.0pp $159 | -0.5pp $120 | base $81 | +0.5pp $41 | +1.0pp $0 |
UW: 25.0% down · 7.5% · 30yr · 1.5% tax · 5.0% vac · 8.0% maint · 8.0% mgmt
Financing live
Cash to close
- Down payment
- $38,750
- Closing costs
- $4,650
- Reserves months
- —
- Total cash needed
- —
Loan-product check · same deal, 3 products live
Conventional
25% down · 7.5% · 30yr
- Down + closing
- —
- Monthly P&I
- —
- Monthly cashflow
- —
- DSCR
- —
- Eligible?
- —
Personal DTI + credit; lowest rate.
DSCR
20% down · 8.5% · 30yr
- Down + closing
- —
- Monthly P&I
- —
- Monthly cashflow
- —
- DSCR
- —
- Eligible?
- —
No personal income docs; deal must DSCR.
Hard money
10% down · 12.0% · 12mo
- Down + closing
- —
- Monthly P&I
- —
- Monthly cashflow
- —
- DSCR
- —
- Eligible?
- —
Short-term bridge; refi at stabilization.
Rent comps 40 comps
| Address | Beds | Baths | Sqft | Rent | $/sqft | DOM | Units | Dist |
|---|---|---|---|---|---|---|---|---|
| 7309 S 180 W Midvale, UT | 2.0–3.0 | 2.5–3.0 | 1311 | $3,440 | $2.62 | 3d | 25 | 0.09mi |
| 7400 S State St Midvale, UT | 1.0–3.0 | 1.0–2.0 | 876 | $2,315 | $2.64 | 3d | 36 | 0.16mi |
| 7525 S Birch St Midvale, UT | 2.0 | 1.0 | 1200 | $1,600 | $1.33 | 5d | 1 | 0.24mi |
| 7531 S Birch St Midvale, UT | 2.0 | 1.0 | 1700 | $1,600 | $0.94 | 4d | 1 | 0.25mi |
| 7304 S 300 W Midvale, UT | 1.0–2.0 | 1.0–2.0 | 807 | $1,640 | $2.03 | 3d | 16 | 0.30mi |
| 7669 Birch St Midvale, UT | 4.0 | 2.0 | 1441 | $2,150 | $1.49 | 25d | 1 | 0.38mi |
| 7669 Birch St Midvale, UT | 4.0 | 2.0 | 1441 | $2,150 | $1.49 | 15d | 1 | 0.38mi |
| 135 W Plumtree Ln Unit 9E Midvale, UT | 3.0 | 2.0 | 1108 | $1,668 | $1.51 | 25d | 1 | 0.63mi |
| 135 W Plumtree Ln Midvale, UT | 1.0–3.0 | 1.0–2.0 | 1007 | $1,738 | $1.73 | 3d | 47 | 0.63mi |
| 38 Autumn Station Way Unit 1 Midvale, UT | 4.0 | 3.5 | 2100 | $2,475 | $1.18 | 25d | 1 | 0.72mi |
| 7680 S 375 E Midvale, UT | 3.0 | 2.0 | 1500 | $2,500 | $1.67 | 5d | 1 | 0.90mi |
| 8157 S Coolidge St Midvale, UT | 3.0 | 2.0 | 1466 | $1,950 | $1.33 | 5d | 1 | 0.94mi |
| 8166 S Monroe St Midvale, UT | 2.0 | 1.0 | 1133 | $1,395 | $1.23 | 5d | 1 | 0.95mi |
| 7533 S Vinci Pl Midvale, UT | 3.0 | 4.0 | 1698 | $2,295 | $1.35 | 16d | 1 | 0.96mi |
| 7497 Siena Vista Ln Midvale, UT | 1.0–3.0 | 1.0–2.0 | 1037 | $1,808 | $1.74 | 3d | 11 | 0.97mi |
| 7706 S Founders Point Ln Midvale, UT | 4.0 | 2.5 | 2151 | $2,600 | $1.21 | 5d | 1 | 1.05mi |
| 7588 S San Savino Way Midvale, UT | 3.0 | 2.5 | 2247 | $2,550 | $1.13 | 25d | 1 | 1.06mi |
| 7661 S 520 E Midvale, UT | 4.0 | 2.0 | 1870 | $2,375 | $1.27 | 5d | 1 | 1.09mi |
| 834 Lennox St Midvale, UT | 3.0 | 2.5 | 1305 | $2,190 | $1.68 | 22d | 1 | 1.10mi |
| 104 E Resaca Dr Unit E2 Sandy, UT | 3.0 | 2.0 | 1247 | $1,850 | $1.48 | 5d | 1 | 1.12mi |
| 485 E Rena Ave Midvale, UT | 2.0 | 1.0 | 1100 | $1,550 | $1.41 | 17d | 1 | 1.14mi |
| 6941 S Village River Ln Midvale, UT | 3.0 | 2.0 | 1237 | $1,888 | $1.53 | 17d | 2 | 1.17mi |
| 8311 S Hayes St Midvale, UT | 4.0 | 2.0 | 1896 | $2,350 | $1.24 | 5d | 1 | 1.18mi |
| 8255 Ivy Dr Midvale, UT | 2.0 | 1.5 | 1150 | $1,700 | $1.48 | 25d | 1 | 1.19mi |
| 674 Union Pines Ct Sandy, UT | 3.0 | 2.5 | 1500 | $2,495 | $1.66 | 25d | 1 | 1.20mi |
| 24 E Opequon Rd Sandy, UT | 3.0 | 3.5 | 1986 | $2,350 | $1.18 | 5d | 1 | 1.21mi |
| 954 W Village Bend Ln Midvale, UT | 3.0 | 2.5 | 1500 | $2,450 | $1.63 | 18d | 1 | 1.22mi |
| 999 W Village River Ln Unit B8 Midvale, UT | 3.0 | 2.0 | 1215 | $1,995 | $1.64 | 4d | 1 | 1.22mi |
| 999 W Village River Ln Unit B10 Midvale, UT | 3.0 | 2.0 | 1075 | $1,800 | $1.67 | 25d | 1 | 1.22mi |
| 1014 Village River Ln Midvale, UT | 3.0 | 2.5 | 1630 | $2,700 | $1.66 | 5d | 1 | 1.23mi |
| 1014 Village River Ln Midvale, UT | 3.0 | 2.5 | 1630 | $2,700 | $1.66 | 3d | 1 | 1.23mi |
| 7701 Navarro View Ct Midvale, UT | 3.0 | 3.0 | 1675 | $3,000 | $1.79 | 14d | 1 | 1.26mi |
| 230 W Foxbridge Dr Midvale, UT | 2.0 | 1.5 | 1084 | $1,397 | $1.29 | 4d | 1 | 1.29mi |
| 220 W Foxbridge Dr Midvale, UT | 2.0 | 1.5 | 1084 | $1,450 | $1.34 | 5d | 1 | 1.29mi |
| 32 E Princeton Dr Sandy, UT | 1.0–3.0 | 1.0–2.0 | 1086 | $2,200 | $2.03 | 3d | 34 | 1.29mi |
| 228 W Foxbridge Dr Midvale, UT | 2.0 | 1.5 | 1084 | $1,450 | $1.34 | 25d | 1 | 1.29mi |
| 8357 S Durham St Sandy, UT | 3.0 | 3.0 | 2173 | $2,600 | $1.20 | 18d | 1 | 1.30mi |
| 735 Zekes Ct Midvale, UT | 3.0 | 2.5 | 1704 | $2,695 | $1.58 | 5d | 1 | 1.31mi |
| 6972 River Reserve Ct Midvale, UT | 1.0–3.0 | 1.0–2.0 | 1013 | $2,299 | $2.27 | 3d | 12 | 1.31mi |
| 754 W Blue Magic Ln Midvale, UT | 3.0 | 2.0 | 1440 | $2,300 | $1.60 | 5d | 1 | 1.42mi |
HOA detail
- Monthly dues
- $615 · $7,380/yr
Listing history 21 events
-
2026-06-21days on market $155,000 Active 31 DOM
-
2026-06-18days on market $155,000 Active 28 DOM
-
2026-06-17days on market $155,000 Active 27 DOM
-
2026-06-16days on market $155,000 Active 26 DOM
-
2026-06-15days on market $155,000 Active 25 DOM
-
2026-06-13days on market $155,000 Active 23 DOM
-
2026-06-09days on market $155,000 Active 19 DOM
-
2026-06-08days on market $155,000 Active 18 DOM
-
2026-06-07days on market $155,000 Active 17 DOM
-
2026-06-05days on market $155,000 Active 14 DOM
-
2026-06-03days on market $155,000 Active 13 DOM
-
2026-06-02days on market $155,000 Active 12 DOM
-
2026-06-01days on market $155,000 Active 11 DOM
-
2026-05-31days on market $155,000 Active 10 DOM
-
2026-05-21$155,000 Active
-
2014-06-13historical
-
2014-05-20historical
-
2014-05-07$31,000
-
2014-05-07$39,000
-
2013-09-14historical
-
2013-08-20$37,450
ⓘ Source: listings_history table (triggers on properties + properties_extension) + one-shot
backfill from property_details.listing_events for pre-trigger history.
Climate risk First Street
- Flood 1/10 Low FEMA zone X (unshaded) · 0% chance over 30 yrs
- Wildfire 1/10 Low
- Heat 4/10 Moderate 7 d/yr ≥95°F today · 18 d/yr by 30 yrs out
- Wind 1/10 Low
- Air quality 3/10 Moderate 3 unhealthy d/yr today · 5 by 30 yrs out
Nearby sold comps map
Loading sold comps map…
Walkable amenities ~0.75 mi
Loading nearby amenities…
Taxation est. · year 1
- Rental income
- $26,843
- − Mortgage interest
- −$8,682
- − Property taxes
- −$2,325
- − Insurance
- −$775
- − Repairs & maintenance
- −$2,147
- − Management
- −$2,147
- − HOA
- −$7,380
- − Depreciation
- −$4,509
- Taxable loss
- −$1,123
- Est. tax savings @ 24.0%
- +$270
- After-tax cash flow
- $1,242/yr
For passive investors: Depreciation is non-cash, so a rental often shows a tax loss while cash-flowing — sheltering income. Rental losses are passive: they offset passive income freely, and up to $25,000/yr can offset ordinary (W-2) income if you actively participate and your MAGI is under $100k (phasing out to $0 by $150k); unused losses carry forward. On sale, claimed depreciation is recaptured at up to 25%, and gains may owe capital-gains tax (a 1031 exchange can defer both). Figures are a year-1 estimate at your 24.0% rate — not tax advice; consult a CPA.
Schools (NCES district)
- District
- Canyons District
- NCES district ID
- 4900142
- Math proficiency
- 49% ▼ -5.00%
- Reading proficiency
- 53% ▼ -3.00%
- Median HH income
- $74,107
- Composite
- 45.91/100
- National rank
- #2548
- State rank
- #12 of 80 in UT
Livability — Midvale
- Score
- 80/100
- State rank
- #35
- US rank
- #1704
Category grades
Schools grade is shown separately in the Schools card above.
Census & demographics
- Census place
- Midvale, UT
- County
- Salt Lake County · 1,195,750 people
- City population
- 37,411
- Metro
- Salt Lake City, UT
- Population (ZIP)
- 37,411
- Household income
- $75,954
- Rent vs Own
- Severe rent burden
- 2050.0
Population outlook (Salt Lake County) Hauer SSP2
- Today (2025)
- 1,305,860 people
- By 2030
- 1,402,611 · +7.4%
- By 2040
- 1,594,533 · +22.1%
- By 2050
- 1,787,244 · +36.9%
- By 2075
- 2,224,138 · +70.3%
- By 2100
- 2,551,390 · +95.4%
Race, ethnicity, and origin ACS 2023
- Neighborhood character
- Predominantly White (66%)
- Race & ethnicity
- White 66% Hispanic / Latino 17% Two or more races 13% Asian 4% Pacific Islander 3% Black 2% Native American 1%
- Hispanic origin (detail)
- Mexican 12%
- Common ancestry
- Italian 4% Slovak 4% Portuguese 2%
- Foreign-born
- 13% · Canada, China
- Languages at home
- 80% English-only · Spanish 10% Russian/Polish/Slavic 2% Other Asian/Pacific 2%
Political lean MEDSL · Salt Lake
- 2024 margin
- D (+10.2) · D 53.7% · R 43.5% · Other 2.8%
- 2008→2024 swing
- +10.1pp toward D · 2008: 0.1pp · 2024: 10.2pp
- All cycles
- 2024: D+10.2 2020: D+11.0 2016: D+10.2 2012: R+19.3 2008: D+0.1
Not yet ingested
- Civics
- —
Market trends
- HPI YoY
- ▼ -175.42%
- Current HPI
- 313.2184
- Rent YoY
- ▼ -0.30%
- Metro
- Salt Lake City, UT
- State GDP YoY
- ▲ 3.54%
- F500 in state
- 2
Industry mix (Fortune 500 HQ in UT)
| Industry | F500 HQs | Revenue |
|---|---|---|
| Financial Services | 1 | $3B |
|
||
Price history
+313.9% since first listed7 events — show timeline
- 2026-05-21 Listed $155,000 WFRMLS
- 2014-06-13 Listing Removed — WFRMLS
- 2014-05-20 Listing Removed — WFRMLS
- 2014-05-07 Listed $39,000 WFRMLS
- 2014-05-07 Listed $31,000 WFRMLS
- 2013-09-14 Listing Removed — WFRMLS
- 2013-08-20 Listed $37,450 WFRMLS
Cash-flow waterfall
monthlySold comps — $/sqft
last 12 mo · ≤1 miLoading sold comps…