1901 S Ocean Dr #303 · Hollywood, FL
Flood risk No data
- FEMA flood zone
- —
- Chance of flooding over 30 yrs
- —
- Est. flood insurance / yr
- —
Fire risk No data
- Est. fire insurance / yr
- —
Heat risk No data
- Hot days now (above threshold)
- —
- Hot days in 30 yrs
- —
Wind risk No data
- Chance of severe wind over 30 yrs
- —
Air-quality risk No data
- Unhealthy air days now
- —
- Unhealthy air days in 30 yrs
- —
Risk factors via First Street. Map © Google.
Why this score? — see what drove the C- grade
The composite is a weighted blend of 9 inputs, each scored 0–100. Each bar is that input's sub-score; the figure is the points it added to the 100-point composite (weight × sub-score).
- Cash flow +15.4/30.0
- 1% rule +10.0/10.0
- ARV discount +7.5/15.0
- DSCR +4.7/10.0
- Schools +4.1/10.0
- Livability +3.8/5.0
- Rent growth +3.2/5.0
- Condition / age +2.5/5.0
- Appreciation +0.0/10.0
$268,000
🖨 Deal sheet 📄 Offer letter ✓ Due diligence
Listing remarks
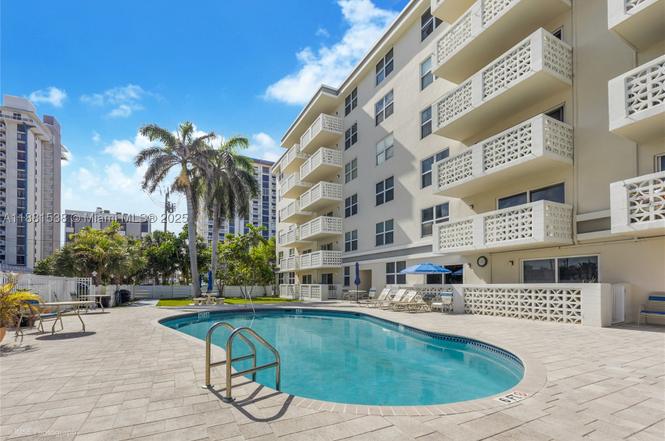
Own a slice of paradise at this stunning condo, just steps from the world-famous Hollywood Beach! A seaside oasis in a Beachfront location. Renovated guest and master bathrooms. The Open-concept kitchen is perfect for entertaining or casual meals. Versatile space, dining area or breakfast nook? You decide! Spacious living room for relaxing in style together with a quiet residential building. Beautiful wood floors throughout, Impact windows and sliding glass door, Enjoy the view worry-free. Private storage area. Unwind and connect at the sparkling pool. BBQ area. Ideal place for full time living or seasonal escape. Make it your permanent home or vacation getaway. Small pets are welcome, brin
Key facts
- Beachfront location
- Open-concept kitchen
- Bbq area
Tags
Property features AI
Finance
- Financial info: Pets allowed with size limit (maximum 20 lbs)
- HOA & community: Monthly association fee; Association amenities include clubhouse, laundry, pool, and elevators; Association fee covers amenities, common areas, structure maintenance, pool(s), and water
Exterior
- Parking: Detached garage; 1 covered garage space
- Security: Lobby secured; Phone entry
- Utilities: Has cooling; Has heating
- Home design: 6-story building; Entry located on level 3; Attached property; Has a view
- Construction: Block construction; Resale property
- Exterior features: Balcony; Barbecue; Open balcony/patio; Association pool
Interior
- Kitchen: Dishwasher; Refrigerator
- Bedrooms: Bedroom on main level
- Flooring: Laminate
- Bathrooms: 1 full bathroom; 1 half bathroom
- Heating & cooling: Central heating; Central air conditioning
- Interior features: Unfurnished; Eat-in kitchen; Kitchen island; Kitchen/dining combo; Living/dining room; Other; Walk-in closet(s)
- Laundry & utility: Common area laundry
Neighborhood map
What this means for you Summary
Snapshot
- This is a 1-bed/2.0-bath condo listed at $268k.
Deal economics
- At list price, monthly cash flow is $101 ($1k/yr) — positive.
- The deal already cash-flows at list — no discount required.
- Meets the 1% rule at list price ($4k rent vs $268k).
- Recommended offer: $236k (12.0% below list) — sets the bar for market timing.
- Cap rate 6.7% vs local median 3.2% in Hollywood — top-decile yield for the area; either an underpriced asset or a hidden risk that comps aren't pricing in. Stress-test before assuming the spread holds.
Location & tenants
- Location reads 76/100 on livability (#232 in FL, #3,548 nationally) — a middle-class / working-renter tenant base. Strengths: commute A+, housing A+, crime B+; Watch: amenities D.
- Broward (suburban): math 42% / reading 53% proficiency, ranked #46 of 73 in FL (top 63%) — families likely to look elsewhere, expect single-tenant / working-renter base with shorter leases.
- Market conditions: Rents rising (+2.9%/yr); 828 active listings in the ZIP; 40 comparable units currently listed for rent nearby; rentals at typical pace (median 17d on market — plan ~3-4 weeks tenant-placement turnaround); solid renter incomes; 2,111 units permitted in Broward County in 2024 (1,265 in 5+ unit buildings).
- At $4,013/mo this rent would consume 50% of the median local household income ($96k/yr) (locally 563% of renters already pay >50% of income on rent) — very limited rent-growth headroom before tenants either downsize or default.
Forward outlook
- Local home prices are declining (-3.0%/yr); year-one equity from $2k of loan paydown is wiped out by about $8k of value loss. Plan a longer hold.
- Broward County population projected at +34% by 2050 — long-run rental-demand tailwind backs the buy-and-hold thesis.
Negotiation context
- It's been on market 272 days — a 12% lower offer ($236k) is reasonable based on typical stale-listing flexibility.
- 8 sale attempts since 12y ago; this cycle's ask has dropped $16k (6%) from the opening price — seller is motivated, your offer sets the floor, not the list.
Risks & watch-outs
- Watch-outs: HOA is 27% of rent.
Questions for the listing agent
- It's been on market 272 days. Have you received any prior offers? Is the seller open to a 12% concession, seller financing, or rate buy-down credit?
- Built in 1966 — when were the roof, HVAC, electrical panel, plumbing, and water heater last replaced?
- What does the HOA fee cover, when was the last increase, and are there any pending special assessments or reserve-fund shortfalls?
- Any open or pending special assessments — roof, HVAC, plumbing, elevator, façade? What's the per-unit balance and payoff schedule, and is the seller paying it off at close or rolling it to the buyer?
- Why hasn't it sold? Are there any deal-killer items the seller is aware of (foundation, flood, title, zoning, code violations)?
- Is there a deadline driving the sale (1031 exchange, divorce, estate, relocation)? That informs how much negotiation room exists.
- What's the average days-on-market for RENTAL listings here right now (not sales)? A rising rental-DOM trend means longer vacancies and softer asking-rent achievability than the comps imply.
- What's the recent tenant-quality profile in this submarket — average credit score on applications, eviction rate, late-payment / NSF rate, and stable-employment percentage? A property-management company in the area should have these aggregated.
- How much new apartment / multifamily construction is in the pipeline within 1–3 miles? Heavy new supply (>2% of stock underway) typically softens rents 12–24 months out; light construction supports rent growth.
Investment metrics
- 1% rule
- 1.50% ✓
- Cap rate
- 6.75%
- Cash-on-cash
- 1.62%
- DSCR
- 1.07
- GRM
- 5.6
CMA / ARV
No comps found within radius.
Projected returns pro-forma
-3.0% appreciation · 2.92% rent growth · sell at horizon
- IRR
- -13.5%
- Equity multiple
- 0.51×
- Total profit
- $-36,480
- Equity at exit
- $39,960
- IRR
- -4.3%
- Equity multiple
- 0.71×
- Total profit
- $-21,484
- Equity at exit
- $23,172
Cash invested: $75,040 (down + closing). Projections, not guarantees.
Landlord ↔ Tenant lean methodology
- Overall (STATE)
- 87 Strongly Landlord-Friendly
- State Florida
- 87 Strongly Landlord-Friendly · R+3
- County
- — inherits STATE
- City
- — inherits STATE
ZIP-level market 33019
- Rents YoY
- 2.9%
- Active inventory
- 828
- Price-to-rent
- 5.6×
Monthly cashflow live
- Estimated rent
- $4,013 high interval (Pro) →
- Mortgage (P&I)
- −$1,405
- Tax from tax record
- −$468 /mo · $5,614/yr
- Insurance
- −$112
- HOA
- −$1,084
- Vacancy / Maint / Mgmt
- −$843
- Net cashflow
- $101
Break-even live
UW: 25.0% down · 7.5% · 30yr · 1.5% tax · 5.0% vac · 8.0% maint · 8.0% mgmt
Financing live
Cash to close
- Down payment
- $67,000
- Closing costs
- $8,040
- Reserves months
- —
- Total cash needed
- —
Loan-product check · same deal, 3 products live
Conventional
25% down · 7.5% · 30yr
- Down + closing
- —
- Monthly P&I
- —
- Monthly cashflow
- —
- DSCR
- —
- Eligible?
- —
Personal DTI + credit; lowest rate.
DSCR
20% down · 8.5% · 30yr
- Down + closing
- —
- Monthly P&I
- —
- Monthly cashflow
- —
- DSCR
- —
- Eligible?
- —
No personal income docs; deal must DSCR.
Hard money
10% down · 12.0% · 12mo
- Down + closing
- —
- Monthly P&I
- —
- Monthly cashflow
- —
- DSCR
- —
- Eligible?
- —
Short-term bridge; refi at stabilization.
Rent comps 40 comps
| Address | Beds | Baths | Sqft | Rent | $/sqft | DOM | Units | Dist |
|---|---|---|---|---|---|---|---|---|
| 2501 S Ocean Dr Hollywood, FL | 1.0–2.0 | 1.0–2.0 | 971 | $3,800 | $3.91 | 19d | 8 | 0.26mi |
| 2501 S Ocean Dr Hollywood, FL | 1.0–2.0 | 1.0–2.0 | 971 | $4,000 | $4.12 | 7d | 7 | 0.26mi |
| 2501 S Ocean Dr Hollywood, FL | 1.0–2.0 | 1.0–2.0 | 971 | $4,200 | $4.32 | 14d | 7 | 0.26mi |
| 2501 S Ocean Dr Hollywood, FL | 1.0–2.0 | 1.0–2.0 | 971 | $4,400 | $4.53 | 10d | 6 | 0.26mi |
| 809 S Ocean Dr Unit 1227349P Hollywood, FL | 2.0 | 1.0 | 990 | $3,768 | $3.81 | 14d | 1 | 0.43mi |
| 3505 S Ocean Dr Hollywood, FL | 1.0–2.0 | 1.5–2.0 | 1085 | $3,600 | $3.32 | 10d | 18 | 0.53mi |
| 3505 S Ocean Dr Hollywood, FL | 1.0–2.0 | 1.5–2.0 | 1085 | $3,900 | $3.59 | 12d | 17 | 0.53mi |
| 3505 S Ocean Dr Unit 1049820P Hollywood, FL | 1.0 | 1.0 | 785 | $4,827 | $6.15 | 3d | 1 | 0.53mi |
| 300 Oregon St #601 Hollywood, FL | 2.0 | 2.0 | 1050 | $4,000 | $3.81 | 24d | 1 | 0.53mi |
| 3725 S Ocean Dr Hollywood, FL | 2.0–3.0 | 2.0 | 1377 | $4,000 | $2.90 | 2d | 7 | 0.76mi |
| 3725 S Ocean Dr Hollywood, FL | 2.0–3.0 | 2.0 | 1377 | $4,000 | $2.90 | 14d | 8 | 0.76mi |
| 101 N Ocean Dr Unit 1227219P Hollywood, FL | 2.0 | 2.0 | 990 | $4,444 | $4.49 | 7d | 1 | 0.80mi |
| 3801 S Ocean Dr Unit 4R Hollywood, FL | 1.0 | 1.0 | 812 | $3,850 | $4.74 | 24d | 1 | 0.81mi |
| 3901 S Ocean Dr Unit 1227197P Hollywood, FL | 1.0–2.0 | 1.0–2.0 | 1054 | $2,727 | $2.59 | 1d | 2 | 0.88mi |
| 3901 S Ocean Dr Unit 10Z Hollywood, FL | 1.0 | 1.0 | 874 | $4,000 | $4.58 | 3d | 1 | 0.88mi |
| 3901 S Ocean Dr Unit 11M Hollywood, FL | 1.0 | 1.0 | 874 | $4,400 | $5.03 | 24d | 1 | 0.88mi |
| 3901 S Ocean Dr Unit 10M Hollywood, FL | 1.0 | 1.0 | 874 | $5,000 | $5.72 | 24d | 1 | 0.88mi |
| 3901 S Ocean Dr Unit 10Z Hollywood, FL | 1.0 | 1.0 | 874 | $4,000 | $4.58 | 24d | 1 | 0.88mi |
| 3901 S Ocean Dr Unit 11M Hollywood, FL | 1.0 | 1.0 | 874 | $4,400 | $5.03 | 3d | 1 | 0.88mi |
| 4001 S Ocean Dr Hollywood, FL | 2.0–3.0 | 1.5–3.0 | 1471 | $4,000 | $2.72 | 22d | 4 | 0.94mi |
| 4001 S Ocean Dr Hollywood, FL | 2.0–3.0 | 1.5–3.0 | 1471 | $4,800 | $3.26 | 24d | 3 | 0.94mi |
| 4010 S Ocean Dr Unit 1227485P Hollywood, FL | 2.0–3.0 | 2.0 | 1118 | $5,049 | $4.51 | 15d | 2 | 0.97mi |
| 4010 S Ocean Dr Unit T3509 Hollywood, FL | 2.0 | 2.0 | 1060 | $6,000 | $5.66 | 22d | 1 | 0.97mi |
| 4010 S Ocean Dr Unit T3609 Hollywood, FL | 2.0 | 2.0 | 1060 | $6,300 | $5.94 | 24d | 1 | 0.97mi |
| 4010 S Ocean Dr Unit R2102 Hollywood, FL | 2.0 | 2.0 | 1075 | $6,500 | $6.05 | 24d | 1 | 0.97mi |
| 4010 S Ocean Dr Unit T3609 Hollywood, FL | 2.0 | 2.0 | 1060 | $6,300 | $5.94 | 3d | 1 | 0.97mi |
| 4010 S Ocean Dr Unit 1388506P Hollywood, FL | 2.0 | 2.0 | 1097 | $4,881 | $4.45 | 7d | 1 | 0.97mi |
| 4010 S Ocean Dr Hollywood, FL | 1.0–3.0 | 1.0–3.5 | 1078 | $5,000 | $4.64 | 24d | 5 | 0.98mi |
| 4111 S Ocean Dr Unit 1557596P Hollywood, FL | 1.0 | 1.0 | 796 | $5,356 | $6.73 | 7d | 1 | 0.98mi |
| 4111 S Ocean Dr Unit 1022181P Hollywood, FL | 1.0–2.0 | 1.0–2.0 | 968 | $4,407 | $4.55 | 16d | 2 | 0.98mi |
| 4111 S Ocean Dr #1810 Hollywood, FL | 1.0 | 1.0 | 1000 | $5,500 | $5.50 | 24d | 1 | 0.98mi |
| 2721 E Hallandale Beach Blvd Unit 1049818P Hollywood, FL | 1.0–2.0 | 1.0–2.0 | 946 | $3,355 | $3.54 | 3d | 2 | 1.01mi |
| 1800 S Ocean Dr #4209 Hallandale Beach, FL | 2.0 | 1.0 | 1086 | $4,000 | $3.68 | 20d | 1 | 1.06mi |
| 1800 S Ocean Dr #4209 Hallandale Beach, FL | 2.0 | 1.0 | 1086 | $4,000 | $3.68 | 1d | 1 | 1.06mi |
| 1800 S Ocean Dr #909 Hallandale Beach, FL | 2.0 | 1.0 | 1086 | $4,000 | $3.68 | 24d | 1 | 1.06mi |
| 2601 E Hallandale Beach Blvd Unit 1227344P Hallandale Beach, FL | 1.0–2.0 | 1.0–2.0 | 844 | $2,465 | $2.92 | 1d | 2 | 1.08mi |
| 2600 E Hallandale Beach Blvd Unit T3208 Hallandale Beach, FL | 2.0 | 2.0 | 1030 | $6,950 | $6.75 | 24d | 1 | 1.08mi |
| 2600 E Hallandale Beach Blvd Unit T3307 Hallandale Beach, FL | 2.0 | 2.0 | 1030 | $4,500 | $4.37 | 24d | 1 | 1.08mi |
| 2600 E Hallandale Beach Blvd Unit T3110 Hallandale Beach, FL | 2.0 | 2.0 | 1028 | $3,650 | $3.55 | 24d | 1 | 1.08mi |
| 2602 E Hallandale Beach Blvd Hallandale Beach, FL | 1.0–2.0 | 1.0–2.0 | 1070 | $4,219 | $3.94 | 20d | 4 | 1.08mi |
HOA detail condo
- Monthly dues
- $1,084 · $13,008/yr
- Likely covers
- pool
- Assessments
- None detected in remarks — confirm with the listing agent.
Listing history 50 events
-
2026-06-18days on market $268,000 Active 272 DOM
-
2026-06-17pricedays on market $268,000 Active 271 DOM
-
2026-06-16days on market $269,000 Active 270 DOM
-
2026-06-15days on market $269,000 Active 269 DOM
-
2026-06-13days on market $269,000 Active 267 DOM
-
2026-06-09days on market $269,000 Active 263 DOM
-
2026-06-07days on market $269,000 Active 261 DOM
-
2026-06-04days on market $269,000 Active 258 DOM
-
2026-06-03days on market $269,000 Active 257 DOM
-
2026-06-02days on market $269,000 Active 256 DOM
-
2026-06-01days on market $269,000 Active 255 DOM
-
2026-05-31days on market $269,000 Active 254 DOM
-
2026-04-27price $269,000
-
2026-03-21price $271,900
-
2026-02-23price $272,500
-
2026-01-13price $275,000
-
2025-11-24price $279,500
-
2025-11-12price $279,800
-
2025-09-19$284,500 Active
-
2025-08-31historical
-
2025-07-13price $287,900
-
2025-04-07price $288,500
-
2025-03-24price $289,500
-
2025-01-05price $290,000
-
2024-12-16price $343,500
-
2024-12-02price $344,900
-
2024-11-04price $345,900
-
2024-09-23price $346,900
-
2024-08-21$347,500 Active
-
2024-08-21historical
-
2024-08-08price $347,900
-
2024-06-17price $348,400
-
2024-05-15price $348,900
-
2024-04-24$349,500 Active
-
2022-10-12soldstatus $310,000
-
2022-10-11soldstatus $310,000 Closed
-
2022-09-06historical Active Under Contract
-
2022-08-19price $319,999
-
2022-08-01price $325,000
-
2022-07-04status Active
-
2022-06-21$350,000 Active
-
2021-09-28soldstatus $279,500
-
2016-12-19historical
-
2016-02-03$285,000 Active
-
2015-08-27historical
-
2015-05-13price $274,500
-
2015-03-16price $279,500
-
2015-02-27$299,000 Active
-
2014-04-20historical
-
2014-03-19$275,000 Active
ⓘ Source: listings_history table (triggers on properties + properties_extension) + one-shot
backfill from property_details.listing_events for pre-trigger history.
Tax reassessment forecast FL · Resets to sale price
- Current annual tax
- $5,614 · $468/mo
- Projected year-2 tax
- $5,614 · $468/mo
- Expected delta
- $0/yr ($0/mo · 0.0%)
ⓘ Screening estimate from a state-policy table — verify with the county assessor before closing.
Nearby sold comps map
Loading sold comps map…
Walkable amenities ~0.75 mi
Loading nearby amenities…
Taxation est. · year 1
- Rental income
- $48,158
- − Mortgage interest
- −$15,012
- − Property taxes
- −$5,614
- − Insurance
- −$1,340
- − Repairs & maintenance
- −$3,853
- − Management
- −$3,853
- − HOA
- −$13,008
- − Depreciation
- −$7,796
- Taxable loss
- −$2,318
- Est. tax savings @ 24.0%
- +$556
- After-tax cash flow
- $1,774/yr
For passive investors: Depreciation is non-cash, so a rental often shows a tax loss while cash-flowing — sheltering income. Rental losses are passive: they offset passive income freely, and up to $25,000/yr can offset ordinary (W-2) income if you actively participate and your MAGI is under $100k (phasing out to $0 by $150k); unused losses carry forward. On sale, claimed depreciation is recaptured at up to 25%, and gains may owe capital-gains tax (a 1031 exchange can defer both). Figures are a year-1 estimate at your 24.0% rate — not tax advice; consult a CPA.
Schools (NCES district)
- District
- Broward
- NCES district ID
- 1200180
- Math proficiency
- 42% ▼ -18.00%
- Reading proficiency
- 53% ▼ -5.00%
- Median HH income
- $52,139
- Composite
- 40.88/100
- National rank
- #3621
- State rank
- #46 of 73 in FL
Livability — Hollywood
- Score
- 76/100
- State rank
- #232
- US rank
- #3548
Category grades
Schools grade is shown separately in the Schools card above.
Census & demographics
- Census place
- Hollywood, FL
- County
- Broward County · 1,963,430 people
- City population
- 109,079
- Metro
- Miami-Fort Lauderdale-Pompano Beach, FL
- Population (ZIP)
- 14,293
- Household income
- $96,497
- Rent vs Own
- Severe rent burden
- 563.0
Population outlook (Broward County) Hauer SSP2
- Today (2025)
- 2,207,033 people
- By 2030
- 2,360,704 · +7.0%
- By 2040
- 2,661,208 · +20.6%
- By 2050
- 2,946,698 · +33.5%
- By 2075
- 3,602,273 · +63.2%
- By 2100
- 3,970,984 · +79.9%
Race, ethnicity, and origin ACS 2023
- Neighborhood character
- Majority White (61%)
- Race & ethnicity
- White 61% Hispanic / Latino 32% Two or more races 25% Black 2%
- Hispanic origin (detail)
- Puerto Rican 2% Cuban 6% Salvadoran 2%
- Common ancestry
- Scotch-Irish 7% Romanian 4% Lithuanian 4%
- Foreign-born
- 43% · Canada, Jamaica, Dominican Republic
- Languages at home
- 53% English-only · Spanish 30% Russian/Polish/Slavic 6% Other Indo-European 4%
Political lean MEDSL · Broward
- 2024 margin
- D (+17.0) · D 58.0% · R 41.0%
- 2008→2024 swing
- -17.8pp toward R · 2008: 34.7pp · 2024: 17.0pp
- All cycles
- 2024: D+17.0 2020: D+29.8 2016: D+35.0 2012: D+34.9 2008: D+34.7
Not yet ingested
- Civics
- —
Market trends
- HPI YoY
- ▼ -434.82%
- Current HPI
- 307.2922
- Rent YoY
- ▲ 2.92%
- Metro
- Miami-Fort Lauderdale-Pompano Beach, FL
- State GDP YoY
- ▲ 3.28%
- F500 in state
- 36
Industry mix (Fortune 500 HQ in FL)
| Industry | F500 HQs | Revenue |
|---|---|---|
| Industrial Technology | 2 | $29B |
|
||
| Insurance | 2 | $17B |
|
||
| Retail | 1 | $60B |
|
||
| Technology Distribution | 1 | $58B |
|
||
| Homebuilding | 1 | $35B |
|
||
| Technology Manufacturing | 1 | $35B |
|
||
Price history
+1193.3% since first listed41 events — show timeline
- 2026-04-27 Price Changed $269,000 MARMLS
- 2026-03-21 Price Changed $271,900 MARMLS
- 2026-02-23 Price Changed $272,500 MARMLS
- 2026-01-13 Price Changed $275,000 MARMLS
- 2025-11-24 Price Changed $279,500 MARMLS
- 2025-11-12 Price Changed $279,800 MARMLS
- 2025-09-19 Listed $284,500 MARMLS
- 2025-08-31 Listing Removed — MARMLS
- 2025-07-13 Price Changed $287,900 MARMLS
- 2025-04-07 Price Changed $288,500 MARMLS
- 2025-03-24 Price Changed $289,500 MARMLS
- 2025-01-05 Price Changed $290,000 MARMLS
- 2024-12-16 Price Changed $343,500 MARMLS
- 2024-12-02 Price Changed $344,900 MARMLS
- 2024-11-04 Price Changed $345,900 MARMLS
- 2024-09-23 Price Changed $346,900 MARMLS
- 2024-08-21 Listing Removed — MARMLS
- 2024-08-21 Listed $347,500 MARMLS
- 2024-08-08 Price Changed $347,900 MARMLS
- 2024-06-17 Price Changed $348,400 MARMLS
- 2024-05-15 Price Changed $348,900 MARMLS
- 2024-04-24 Listed $349,500 MARMLS
- 2022-10-12 Sold (Public Records) $310,000 Public Records
- 2022-10-11 Sold (MLS) $310,000 MARMLS
- 2022-09-06 Contingent — MARMLS
- 2022-08-19 Price Changed $319,999 MARMLS
- 2022-08-01 Price Changed $325,000 MARMLS
- 2022-07-04 Relisted — MARMLS
- 2022-06-21 Listed $350,000 MARMLS
- 2021-09-28 Sold (Public Records) $279,500 Public Records
- 2016-12-19 Listing Removed — MARMLS
- 2016-02-03 Listed $285,000 MARMLS
- 2015-08-27 Listing Removed — MARMLS
- 2015-05-13 Price Changed $274,500 MARMLS
- 2015-03-16 Price Changed $279,500 MARMLS
- 2015-02-27 Listed $299,000 MARMLS
- 2014-04-20 Listing Removed — MARMLS
- 2014-03-19 Listed $275,000 MARMLS
- 2007-10-08 Sold (Public Records) $176,500 Public Records
- 1993-05-07 Sold (Public Records) $60,000 Public Records
- 1969-03-01 Sold (Public Records) $20,800 Public Records
Property tax history
+6.2%/yrLatest (2025): $5,614 · +2.1% YoY. Source: county tax records.
Cash-flow waterfall
monthlySold comps — $/sqft
last 12 mo · ≤1 miLoading sold comps…