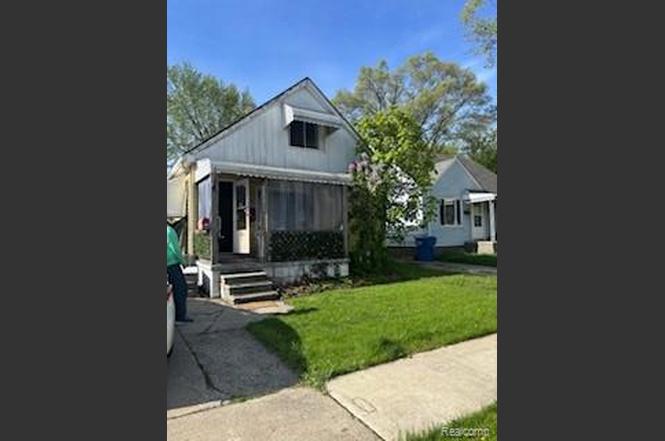
7204 Hudson Ave · Warren, MI
Flood risk 3/10 · Minor
- FEMA flood zone
- X (unshaded)
- Chance of flooding over 30 yrs
- 0.2%
- Est. flood insurance / yr
- $507 – $1,088
Fire risk 1/10 · Minimal
- Est. fire insurance / yr
- $784 – $1,456
Heat risk 3/10 · Minor
- Hot days now (above 97°F)
- 7 days/yr
- Hot days in 30 yrs
- 15 days/yr
Wind risk 1/10 · Minimal
- Chance of severe wind over 30 yrs
- —
Air-quality risk 3/10 · Minor
- Unhealthy air days now
- 3 days/yr
- Unhealthy air days in 30 yrs
- 4 days/yr
Risk factors via First Street. Map © Google.
Why this score? — see what drove the B- grade
The composite is a weighted blend of 9 inputs, each scored 0–100. Each bar is that input's sub-score; the figure is the points it added to the 100-point composite (weight × sub-score).
- Cash flow +30.0/30.0
- 1% rule +10.0/10.0
- DSCR +10.0/10.0
- ARV discount +7.5/15.0
- Livability +3.7/5.0
- Rent growth +3.1/5.0
- Condition / age +2.5/5.0
- Schools +1.0/10.0
- Appreciation +0.0/10.0
$72,000
🖨 Deal sheet 📄 Offer letter ✓ Due diligence
Listing remarks MLS
Opportunity knocks!! Great potential! Four bedroom bungalow on a basement in Center Line schools at a really great price!! Price reflects needed repairs and or updates. Enclosed front porch. Eat-in kitchen with stove & fridge. Upper large primary bedroom with private half bath. Basement with washer, dryer, toilet and 90+ furnace. Being sold strictly as-is. .. seller will do no cleanout nor any repairs. No FHA or VA offers please. All sizes shown are strictly estimates. Information contained in this listing is deemed reliable but not guaranteed. .. .. .buyer or buyer's agent to verify all information. Seller will not consider offers where purchaser has not viewed the property first. Owner is a licensed broker in the state of Michigan. A licensed agent must be physically present for all showings…NO EXCEPTIONS.
Key facts
- Private half bath
- Eat-in kitchen
- Bungalow
Tags
Property features AI
Exterior
- Parking: No garage
- Utilities: Public water; Public sewer
- Home design: Single family residence; One and one half stories; Ground-level entry with steps; Aluminum and vinyl siding
- Construction: Built on block foundation
- Exterior features: Enclosed porch; Porch; Paved road access
Interior
- Kitchen: Built-in gas range; Refrigerator
- Bathrooms: 1 full bathroom; 1 half bathroom
- Heating & cooling: Forced air heating (natural gas); No cooling
- Interior features: Gas water heater; Built-in gas range; Free-standing refrigerator
- Laundry & utility: Washer; Dryer
Neighborhood map
What this means for you Summary
Snapshot
- This is a 4-bed/1.5-bath single-family listed at $72k.
Deal economics
- At list price, monthly cash flow is $738 ($9k/yr) — positive.
- The deal already cash-flows at list — no discount required.
- Meets the 1% rule at list price ($2k rent vs $72k).
- Cap rate 18.6% vs local median 5.3% in Warren — top-decile yield for the area; either an underpriced asset or a hidden risk that comps aren't pricing in. Stress-test before assuming the spread holds.
Location & tenants
- Location reads 74/100 on livability (#171 in MI, #4,491 nationally) — a middle-class / working-renter tenant base. Strengths: commute A+, cost of living A+, housing A+; Watch: schools D, amenities D, employment D.
- Van Dyke Public Schools (urban): math 7% / reading 19% proficiency, ranked #512 of 540 in MI (top 95%) — low school quality limits family demand, transient renter base, plan for 1-2y turnover; 80% free/reduced lunch — lower-income household profile, screen leases tightly.
- Market conditions: Rents rising (+2.4%/yr); 168 active listings in the ZIP; 30 comparable units currently listed for rent nearby; rentals at typical pace (median 24d on market — plan ~3-4 weeks tenant-placement turnaround); 1,321 units permitted in Macomb County in 2024 (86 in 5+ unit buildings).
- This rent runs 35% of the median local income ($54k/yr) — at the standard rent-burdened threshold; future hikes will face affordability resistance.
Forward outlook
- Local home prices are declining (-3.0%/yr); year-one equity from $498 of loan paydown is wiped out by about $2k of value loss. Plan a longer hold.
- Macomb County population projected at +9% by 2050 — modest demand growth; plan on rents tracking national, not racing it.
- At projected returns (-3.0% appreciation + 2.4% rent growth), your $20k cash investment doubles in ~3 years — after that, you're playing with house money.
Negotiation context
- Only 1 days on market — expect competitive offers; lowballing is unlikely to land.
- 2 sale attempts with the ask held roughly flat each time — persistent listings suggest the price (not the market) is what's stuck; bring a comps-based counter.
Risks & watch-outs
- Watch-outs: built in 1940 — expect roof / HVAC / electrical / plumbing capex.
Questions for the listing agent
- Built in 1940 — when were the roof, HVAC, electrical panel, plumbing, and water heater last replaced?
- Is there a deadline driving the sale (1031 exchange, divorce, estate, relocation)? That informs how much negotiation room exists.
- Schools are D-rated, which usually means shorter tenancies and higher turnover. Who's the typical renter profile here, and what's been the actual vacancy rate?
- Crime grade is D in this area — have there been break-ins, vandalism, or insurance claims at this property in the last 3 years? What carrier currently insures it and at what premium?
- What's the average days-on-market for RENTAL listings here right now (not sales)? A rising rental-DOM trend means longer vacancies and softer asking-rent achievability than the comps imply.
- What's the recent tenant-quality profile in this submarket — average credit score on applications, eviction rate, late-payment / NSF rate, and stable-employment percentage? A property-management company in the area should have these aggregated.
- How much new for-sale + rental construction is in the pipeline within 1–3 miles? Heavy new supply typically softens prices + rents 12–24 months out; constrained supply supports both.
Investment metrics
- 1% rule
- 2.17% ✓
- Cap rate
- 18.59%
- Cash-on-cash
- 43.91%
- DSCR
- 2.95
- GRM
- 3.8
CMA / ARV
- ARV (on-the-fly)
- $162,237
- Comps found
- 12
Show comp detail 12 sales within ~0.75 mi
| Address | Dist | Beds/Ba | Sqft | Sold | Price | $/sf | Match |
|---|---|---|---|---|---|---|---|
| 7519 Packard Ave | 0.12mi | 3/2.0 (-1) | 1,291 (-2%) | 3mo | $224,500 | $174 | 81 |
| 7052 Studebaker Ave | 0.06mi | 3/2.0 (-1) | 1,242 (-6%) | 1mo | $152,500 | $123 | 80 |
| 7641 Westminster Ave | 0.41mi | 4/1.5 | 1,415 (+7%) | 0mo | $155,000 | $110 | 68 |
| 8244 Hupp Ave | 0.43mi | 3/2.0 (-1) | 1,300 (-1%) | 3mo | $188,500 | $145 | 68 |
| 8316 Hudson Ave | 0.48mi | 3/1.0 (-1) | 1,300 (-1%) | 1mo | $94,000 | $72 | 67 |
| 7051 Maxwell Ave | 0.28mi | 3/1.0 (-1) | 1,234 (-6%) | 3mo | $135,000 | $109 | 67 |
| 8268 Hudson Ave | 0.44mi | 3/2.0 (-1) | 1,258 (-5%) | 2mo | $145,000 | $115 | 63 |
| 23555 Peters Ave | 0.69mi | 4/2.0 | 1,338 (+1%) | 5mo | $190,000 | $142 | 59 |
| 8286 Westminster Ave | 0.63mi | 3/2.5 (-1) | 1,250 (-5%) | 2mo | $250,000 | $200 | 51 |
| 7551 Westminister Avenue Ave | 0.38mi | 3/1.0 (-1) | 1,128 (-14%) | 6mo | $78,000 | $69 | 46 |
| 8404 Westminster Ave | 0.64mi | 3/1.0 (-1) | 1,473 (+12%) | 2mo | $115,000 | $78 | 42 |
| 8301 Dodge Ave | 0.57mi | 3/3.0 (-1) | 1,510 (+14%) | 7mo | $200,000 | $132 | 33 |
Match score weights: distance 35% · size 25% · config 20% · recency 20%. Top-matched comps best support the ARV.
Projected returns pro-forma
-3.0% appreciation · 2.35% rent growth · sell at horizon
- IRR
- 40.1%
- Equity multiple
- 2.70×
- Total profit
- $34,322
- Equity at exit
- $10,735
- IRR
- 46.1%
- Equity multiple
- 5.28×
- Total profit
- $86,364
- Equity at exit
- $6,225
Cash invested: $20,160 (down + closing). Projections, not guarantees.
Landlord ↔ Tenant lean methodology
- Overall (STATE)
- 62 Landlord-Friendly
- State Michigan
- 62 Landlord-Friendly · EVEN
- County
- — inherits STATE
- City
- — inherits STATE
ZIP-level market 48091
- Rents YoY
- 2.4%
- Active inventory
- 168
- Price-to-rent
- 3.8×
Monthly cashflow live
- Estimated rent
- $1,561 high interval (Pro) →
- Mortgage (P&I)
- −$378
- Tax from tax record
- −$88 /mo · $1,059/yr
- Insurance
- −$30
- HOA
- −$0
- Vacancy / Maint / Mgmt
- −$328
- Net cashflow
- $738
Break-even live
UW: 25.0% down · 7.5% · 30yr · 1.5% tax · 5.0% vac · 8.0% maint · 8.0% mgmt
Financing live
Cash to close
- Down payment
- $18,000
- Closing costs
- $2,160
- Reserves months
- —
- Total cash needed
- —
Loan-product check · same deal, 3 products live
Conventional
25% down · 7.5% · 30yr
- Down + closing
- —
- Monthly P&I
- —
- Monthly cashflow
- —
- DSCR
- —
- Eligible?
- —
Personal DTI + credit; lowest rate.
DSCR
20% down · 8.5% · 30yr
- Down + closing
- —
- Monthly P&I
- —
- Monthly cashflow
- —
- DSCR
- —
- Eligible?
- —
No personal income docs; deal must DSCR.
Hard money
10% down · 12.0% · 12mo
- Down + closing
- —
- Monthly P&I
- —
- Monthly cashflow
- —
- DSCR
- —
- Eligible?
- —
Short-term bridge; refi at stabilization.
Rent comps 30 comps
| Address | Beds | Baths | Sqft | Rent | $/sqft | DOM | Units | Dist |
|---|---|---|---|---|---|---|---|---|
| 7044 Hudson Ave Warren, MI | 3.0 | 1.5 | 1730 | $1,700 | $0.98 | 24d | 1 | 0.03mi |
| 7568 Hudson Ave Unit 1 Warren, MI | 3.0 | 1.0 | 1415 | $1,100 | $0.78 | 5d | 1 | 0.17mi |
| 7584 Hudson Ave Warren, MI | 5.0 | 1.0 | 1554 | $1,800 | $1.16 | 24d | 1 | 0.18mi |
| 7511 Toepfer Rd Warren, MI | 3.0 | 1.0 | 1032 | $1,199 | $1.16 | 22d | 1 | 0.19mi |
| 7060 Victory Ave Warren, MI | 3.0 | 1.0 | 945 | $1,450 | $1.53 | 11d | 1 | 0.35mi |
| 8251 Hudson Ave Warren, MI | 3.0 | 1.0 | 908 | $1,400 | $1.54 | 24d | 1 | 0.44mi |
| 7256 Ready Ave Warren, MI | 3.0 | 2.0 | 1300 | $1,500 | $1.15 | 24d | 1 | 0.69mi |
| 8125 Timken Ave Warren, MI | 3.0 | 1.0 | 948 | $1,270 | $1.34 | 5d | 1 | 0.72mi |
| 8509 Paige Ave Warren, MI | 3.0 | 1.0 | 950 | $1,300 | $1.37 | 24d | 1 | 0.74mi |
| 8285 Rivard Ave Warren, MI | 3.0 | 1.0 | 902 | $1,549 | $1.72 | 24d | 1 | 0.78mi |
| 8693 Paige Ave Warren, MI | 3.0 | 1.0 | 900 | $1,300 | $1.44 | 24d | 1 | 0.85mi |
| 21456 Syracuse Ave Warren, MI | 3.0 | 1.0 | 1160 | $1,595 | $1.38 | 43d | 1 | 0.85mi |
| 21456 Syracuse Ave Warren, MI | 3.0 | 1.0 | 1152 | $1,595 | $1.38 | 2d | 1 | 0.85mi |
| 11076 Hudson Ave Warren, MI | 3.0 | 1.0 | 936 | $1,395 | $1.49 | 3d | 1 | 0.87mi |
| 21465 Syracuse Ave Warren, MI | 3.0 | 1.0 | 990 | $1,375 | $1.39 | 43d | 1 | 0.88mi |
| 8707 Continental Ave Warren, MI | 3.0 | 1.0 | 968 | $1,200 | $1.24 | 18d | 1 | 0.89mi |
| 8707 Continental Ave Warren, MI | 3.0 | 1.0 | 1100 | $1,200 | $1.09 | 5d | 1 | 0.89mi |
| 22622 Panama Ave Warren, MI | 3.0 | 1.5 | 920 | $1,395 | $1.52 | 11d | 1 | 0.93mi |
| 21410 Panama St Warren, MI | 3.0 | 1.0 | 900 | $1,600 | $1.78 | 24d | 1 | 0.97mi |
| 8716 Timken Ave Warren, MI | 3.0 | 1.0 | 1008 | $1,400 | $1.39 | 24d | 1 | 0.98mi |
| 20042 Rogge St Detroit, MI | 4.0 | 2.0 | 1232 | $1,394 | $1.13 | 43d | 1 | 1.02mi |
| 11319 Chalmers Ave Warren, MI | 3.0 | 1.0 | 975 | $1,500 | $1.54 | 24d | 1 | 1.03mi |
| 11076 Essex Ave Warren, MI | 4.0 | 1.0 | 1072 | $1,400 | $1.31 | 43d | 1 | 1.09mi |
| 11332 Republic Ave Warren, MI | 3.0 | 1.0 | 1140 | $1,500 | $1.32 | 24d | 1 | 1.15mi |
| 11377 Sherman Ave Warren, MI | 3.0 | 1.0 | 1200 | $1,400 | $1.17 | 24d | 1 | 1.16mi |
| 20263 Caldwell St Detroit, MI | 3.0 | 1.0 | 909 | $1,350 | $1.49 | 16d | 1 | 1.22mi |
| 20794 Audrey Ave Warren, MI | 3.0 | 1.0 | 954 | $1,350 | $1.42 | 43d | 1 | 1.29mi |
| 22580 Masch Ave Warren, MI | 3.0 | 1.0 | 988 | $1,450 | $1.47 | 24d | 1 | 1.31mi |
| 20058 Bloom St Detroit, MI | 4.0 | 1.0 | 1350 | $1,450 | $1.07 | 16d | 1 | 1.38mi |
| 23378 Cunningham Ave Warren, MI | 3.0 | 1.0 | 1140 | $1,500 | $1.32 | 3d | 1 | 1.48mi |
Listing history 2 events
-
2026-06-18remarks 695-char remark
-
2026-06-18$72,000 Active 1 DOM
ⓘ Source: listings_history table (triggers on properties + properties_extension) + one-shot
backfill from property_details.listing_events for pre-trigger history.
Tax reassessment forecast MI · Partial reset (capped growth)
- Current annual tax
- $1,059 · $88/mo
- Projected year-2 tax
- $1,084 · $90/mo
- Expected delta
- +$25/yr (+$2/mo · 2.4%)
ⓘ Screening estimate from a state-policy table — verify with the county assessor before closing.
Climate risk First Street
- Flood 3/10 Moderate FEMA zone X (unshaded) · 20% chance over 30 yrs
- Wildfire 1/10 Low
- Heat 3/10 Moderate 7 d/yr ≥97°F today · 15 d/yr by 30 yrs out
- Wind 1/10 Low
- Air quality 3/10 Moderate 3 unhealthy d/yr today · 4 by 30 yrs out
Nearby sold comps map
Loading sold comps map…
Walkable amenities ~0.75 mi
Loading nearby amenities…
Taxation est. · year 1
- Rental income
- $18,736
- − Mortgage interest
- −$4,033
- − Property taxes
- −$1,059
- − Insurance
- −$360
- − Repairs & maintenance
- −$1,499
- − Management
- −$1,499
- − Depreciation
- −$2,095
- Taxable income
- $8,192
- Est. tax owed @ 24.0%
- −$1,966
- After-tax cash flow
- $6,886/yr
For passive investors: Depreciation is non-cash, so a rental often shows a tax loss while cash-flowing — sheltering income. Rental losses are passive: they offset passive income freely, and up to $25,000/yr can offset ordinary (W-2) income if you actively participate and your MAGI is under $100k (phasing out to $0 by $150k); unused losses carry forward. On sale, claimed depreciation is recaptured at up to 25%, and gains may owe capital-gains tax (a 1031 exchange can defer both). Figures are a year-1 estimate at your 24.0% rate — not tax advice; consult a CPA.
Schools (NCES district)
- District
- Van Dyke Public Schools
- NCES district ID
- 2634680
- Math proficiency
- 7% ▼ -11.00%
- Reading proficiency
- 19% ▼ -5.00%
- Median HH income
- $33,231
- Composite
- 10.46/100
- National rank
- #9784
- State rank
- #512 of 540 in MI
Livability — Warren
- Score
- 74/100
- State rank
- #171
- US rank
- #4491
Category grades
Schools grade is shown separately in the Schools card above.
Census & demographics
- Census place
- Warren, MI
- County
- Macomb County · 638,552 people
- City population
- 114,937
- Metro
- Detroit-Warren-Dearborn, MI
- Population (ZIP)
- 30,696
- Household income
- $54,230
- Rent vs Own
- Severe rent burden
- 1296.0
Population outlook (Macomb County) Hauer SSP2
- Today (2025)
- 925,296 people
- By 2030
- 948,226 · +2.5%
- By 2040
- 983,961 · +6.3%
- By 2050
- 1,010,200 · +9.2%
- By 2075
- 1,076,222 · +16.3%
- By 2100
- 1,077,065 · +16.4%
Race, ethnicity, and origin ACS 2023
- Neighborhood character
- Diverse neighborhood (Simpson 0.68)
- Race & ethnicity
- White 47% Black 25% Asian 19% Two or more races 5% Hispanic / Latino 3% Native American 2%
- Common ancestry
- Romanian 7% Lithuanian 2% Slovak 1%
- Foreign-born
- 16% · Canada
- Languages at home
- 77% English-only · Other Indo-European 14% Other Asian/Pacific 3% Russian/Polish/Slavic 2%
Political lean MEDSL · Macomb
- 2024 margin
- R (+13.7) · D 42.2% · R 55.9% · Other 1.9%
- 2008→2024 swing
- -22.3pp toward R · 2008: 8.6pp · 2024: -13.7pp
- All cycles
- 2024: R+13.7 2020: R+8.1 2016: R+11.6 2012: D+4.0 2008: D+8.6
Not yet ingested
- Civics
- —
Market trends
- HPI YoY
- ▼ -199.66%
- Current HPI
- 177.9273
- Rent YoY
- ▲ 2.35%
- Metro
- Detroit-Warren-Dearborn, MI
- State GDP YoY
- ▲ 1.37%
- F500 in state
- 28
Industry mix (Fortune 500 HQ in MI)
| Industry | F500 HQs | Revenue |
|---|---|---|
| Automotive Parts | 3 | $48B |
|
||
| Automotive | 2 | $372B |
|
||
| Chemicals | 1 | $45B |
|
||
| Automotive Retail | 1 | $29B |
|
||
| Healthcare / Medical Devices | 1 | $23B |
|
||
| Automotive Technology | 1 | $20B |
|
||
Price history
+0.0% since first listed2 events — show timeline
- 2026-06-17 Listed $72,000 MiRealSource-MiMLS
- 2026-06-17 Listed $72,000 REALCOMP
Property tax history
+1.8%/yrLatest (2025): $1,059 · +1.7% YoY. Source: county tax records.
Cash-flow waterfall
monthlySold comps — $/sqft
last 12 mo · ≤1 miLoading sold comps…