 Fourplex
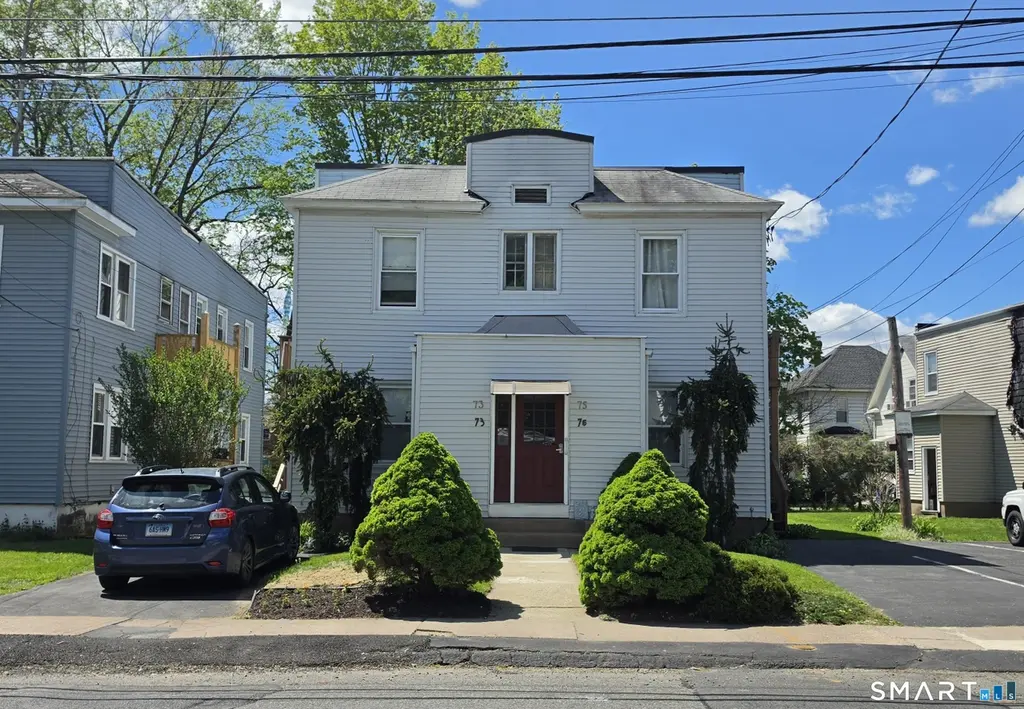
73-75 Hanmer St · East Hartford, CT
Flood risk 1/10 · Minimal
- FEMA flood zone
- X (unshaded)
- Chance of flooding over 30 yrs
- 0.0%
- Est. flood insurance / yr
- $507 – $1,088
Fire risk 1/10 · Minimal
- Est. fire insurance / yr
- $829 – $1,539
Heat risk 5/10 · Moderate
- Hot days now (above 97°F)
- 7 days/yr
- Hot days in 30 yrs
- 17 days/yr
Wind risk 6/10 · Moderate
- Chance of severe wind over 30 yrs
- 27.0%
Air-quality risk 3/10 · Minor
- Unhealthy air days now
- 3 days/yr
- Unhealthy air days in 30 yrs
- 4 days/yr
Risk factors via First Street. Map © Google.
Why this score? — see what drove the B- grade
The composite is a weighted blend of 9 inputs, each scored 0–100. Each bar is that input's sub-score; the figure is the points it added to the 100-point composite (weight × sub-score).
- Cash flow +30.0/30.0
- 1% rule +10.0/10.0
- DSCR +10.0/10.0
- ARV discount +4.7/15.0
- Condition / age +4.0/5.0
- Livability +3.7/5.0
- Rent growth +2.5/5.0
- Schools +2.1/10.0
- Appreciation +0.0/10.0
$419,900
🖨 Deal sheet (PDF) 📄 Offer letter ✓ Due diligence
Multi-family units
County records classify this as Multi-Family (2-4 Unit). Listing-text estimate: 4 units. confirmed
Listing remarks
HIGHEST AND BEST OFFERS DUE BY 5PM 5/11. Welcome to this well-maintained 4-family property at 73-75 Hanmer Street in East Hartford offering a fantastic investment opportunity. Each unit features a consistent 1-bedroom, 1-bath layout across two levels, including a spacious living room with closet, full kitchen with breakfast nook and access to a private balcony, full bath, and generously sized bedroom. The property includes a clean, dry basement with ample storage, separate utilities and mechanicals for each unit, as well as plenty of off-street parking. Newer roof and windows adds to the overall value and peace of mind. Fully tenant-occupied, providing immediate cash flow for both seasoned
Key facts
- 4,356 sq ft lot
- 4 parking spots
- Built 1900
Property features AI
Exterior
- Parking: Paved off-street parking; 4 total parking spaces
- Utilities: Public water connected; Public sewer connected; Natural gas
- Home design: Multi-family property (4-family)
- Construction: Frame construction; Concrete foundation; Asphalt shingle roof
- Exterior features: Level lot; Vinyl siding; White exterior
Interior
- Bedrooms: 4 bedrooms
- Bathrooms: 4 full bathrooms
- Heating & cooling: Hot water heating; Natural gas hot water supply
- Interior features: 12 total rooms; Full, unfinished basement with storage
- Laundry & utility: Basement laundry hook-ups
Neighborhood map
What this means for you Summary
Snapshot
- This is a 4 × 4-bed/4.0-bath units multifamily listed at $420k. Condition is rated good.
Deal economics
- At list price, monthly cash flow is $3k ($39k/yr) — positive. Per door: $822/mo.
- The deal already cash-flows at list — no discount required.
- Meets the 1% rule at list price ($8k rent vs $420k).
- Cap rate 15.7% vs local median 4.1% in East Hartford — top-decile yield for the area; either an underpriced asset or a hidden risk that comps aren't pricing in. Stress-test before assuming the spread holds.
Location & tenants
- Location reads 73/100 on livability (#76 in CT) — a middle-class / working-renter tenant base. Strengths: housing A+, crime A, commute A-; Watch: amenities F, health & safety F.
- East Hartford School District (urban): math 17% / reading 30% proficiency, ranked #140 of 153 in CT (top 92%) — low school quality limits family demand, transient renter base, plan for 1-2y turnover.
- Zoned schools: Dr. John A. Langford School (math 22% / reading 32%, grade F, #401 of 553 statewide, top 74%, 320 students, 69% FRL); East Hartford Middle School (math 12% / reading 26%, grade F, #163 of 175 statewide, top 94%, 890 students, 70% FRL); East Hartford High School (math 11% / reading 33%, grade F, #156 of 194 statewide, top 82%, 1,698 students, 63% FRL).
- Market conditions: 53 active listings in the ZIP; 1,867 units permitted in Capitol Planning Region in 2024 (1,399 in 5+ unit buildings).
- At $7,834/mo this rent would consume 166% of the median local household income ($57k/yr) (locally 1205% of renters already pay >50% of income on rent) — very limited rent-growth headroom before tenants either downsize or default.
Forward outlook
- Local home prices are declining (-3.0%/yr); year-one equity from $3k of loan paydown is wiped out by about $13k of value loss. Plan a longer hold.
- At projected returns (-3.0% appreciation + 3.0% rent growth), your $118k cash investment doubles in ~4 years — after that, you're playing with house money.
Negotiation context
- Only 5 days on market — expect competitive offers; lowballing is unlikely to land.
Risks & watch-outs
- Watch-outs: built in 1900 — expect roof / HVAC / electrical / plumbing capex.
- Climate carrying-cost: major wind risk, 27% chance of damaging wind over 30y; extreme-heat days projected 7→17/yr by 2055 (HVAC capex compounding) — expect insurance premiums to compound above CPI over the hold.
Questions for the listing agent
- Can we see the unit-by-unit rent roll, current vacancy, and any below-market leases? What's the average tenancy length?
- What capital expenditures (roof, boiler, parking lot, exteriors) have been made in the last 5 years, and what's planned in the next 2?
- Built in 1900 — when were the roof, HVAC, electrical panel, plumbing, and water heater last replaced?
- Is there a deadline driving the sale (1031 exchange, divorce, estate, relocation)? That informs how much negotiation room exists.
- Schools are D-rated, which usually means shorter tenancies and higher turnover. Who's the typical renter profile here, and what's been the actual vacancy rate?
- What's the average days-on-market for RENTAL listings here right now (not sales)? A rising rental-DOM trend means longer vacancies and softer asking-rent achievability than the comps imply.
- What's the recent tenant-quality profile in this submarket — average credit score on applications, eviction rate, late-payment / NSF rate, and stable-employment percentage? A property-management company in the area should have these aggregated.
- How much new apartment / multifamily construction is in the pipeline within 1–3 miles? Heavy new supply (>2% of stock underway) typically softens rents 12–24 months out; light construction supports rent growth.
Investment metrics
- 1% rule
- 1.87% ✓
- Cap rate
- 15.69%
- Cash-on-cash
- 33.55%
- DSCR
- 2.49
- GRM
- 4.5
CMA / ARV
- ARV (median comp)
- $395,197
- List price
- $419,900
- Delta
- 6.25%
- Verdict
- FAIR
- Comps
- 20 within 1.0 mi
Projected returns pro-forma
-3.0% appreciation · 3.0% rent growth · sell at horizon
- IRR
- 28.8%
- Equity multiple
- 2.20×
- Total profit
- $141,429
- Equity at exit
- $62,608
- IRR
- 36.2%
- Equity multiple
- 4.34×
- Total profit
- $393,209
- Equity at exit
- $36,305
Cash invested: $117,572 (down + closing). Projections, not guarantees.
Landlord ↔ Tenant lean methodology
- Overall (STATE)
- 27 Tenant-Leaning
- State Connecticut
- 27 Tenant-Leaning · D+7
- County
- — inherits STATE
- City
- — inherits STATE
ZIP-level market 06108
- Home prices YoY
- -17.6%
- Active inventory
- 53
- Price-to-rent
- 17.9×
Monthly cashflow live
- Estimated rent
- $7,834 medium interval (Pro) →
- Mortgage (P&I)
- −$2,202
- Tax est. 1.5%
- −$525 /mo · $6,298/yr
- Insurance
- −$175
- HOA
- −$0
- Vacancy / Maint / Mgmt
- −$1,645
- Net cashflow
- $3,287
Break-even live
Sensitivity live
| Price | -10% $3,577 | -5% $3,432 | +0% $3,287 | +5% $3,142 | +10% $2,997 |
|---|---|---|---|---|---|
| Rent | -10% $2,668 | -5% $2,978 | +0% $3,287 | +5% $3,596 | +10% $3,906 |
| Rate | -1.0pp $3,498 | -0.5pp $3,394 | base $3,287 | +0.5pp $3,178 | +1.0pp $3,068 |
4-unit breakdown (identical units grouped — click to expand)
| Units | Beds | Baths | Est. rent |
|---|---|---|---|
| 4× units | 4 | 4 | $7,832 |
| #1 | 4 | 4 | $1,958 |
| #2 | 4 | 4 | $1,958 |
| #3 | 4 | 4 | $1,958 |
| #4 | 4 | 4 | $1,958 |
| Total (4 units) | $7,834 | ||
UW: 25.0% down · 7.5% · 30yr · 1.5% tax · 5.0% vac · 8.0% maint · 8.0% mgmt
Financing live
Cash to close
- Down payment
- $104,975
- Closing costs
- $12,597
- Reserves months
- —
- Total cash needed
- —
Loan-product check · same deal, 3 products live
Conventional
25% down · 7.5% · 30yr
- Down + closing
- —
- Monthly P&I
- —
- Monthly cashflow
- —
- DSCR
- —
- Eligible?
- —
Personal DTI + credit; lowest rate.
DSCR
20% down · 8.5% · 30yr
- Down + closing
- —
- Monthly P&I
- —
- Monthly cashflow
- —
- DSCR
- —
- Eligible?
- —
No personal income docs; deal must DSCR.
Hard money
10% down · 12.0% · 12mo
- Down + closing
- —
- Monthly P&I
- —
- Monthly cashflow
- —
- DSCR
- —
- Eligible?
- —
Short-term bridge; refi at stabilization.
Listing history 3 events
-
2026-05-12status Under Contract 885-char remark
-
2026-05-07$419,900 Active 885-char remark
-
2026-05-04historical $419,900 885-char remark
ⓘ Source: listings_history table (triggers on properties + properties_extension) + one-shot
backfill from property_details.listing_events for pre-trigger history.
Climate risk First Street
- Flood 1/10 Low FEMA zone X (unshaded) · 0% chance over 30 yrs
- Wildfire 1/10 Low
- Heat 5/10 Major 7 d/yr ≥97°F today · 17 d/yr by 30 yrs out
- Wind 6/10 Major 27% chance of damaging wind over 30 yrs
- Air quality 3/10 Moderate 3 unhealthy d/yr today · 4 by 30 yrs out
Nearby sold comps map
Loading sold comps map…
Walkable amenities ~0.75 mi
Loading nearby amenities…
Taxation est. · year 1
- Rental income
- $94,008
- − Mortgage interest
- −$23,521
- − Property taxes
- −$6,298
- − Insurance
- −$2,100
- − Repairs & maintenance
- −$7,521
- − Management
- −$7,521
- − Depreciation
- −$12,215
- Taxable income
- $34,833
- Est. tax owed @ 24.0%
- −$8,360
- After-tax cash flow
- $31,084/yr
For passive investors: Depreciation is non-cash, so a rental often shows a tax loss while cash-flowing — sheltering income. Rental losses are passive: they offset passive income freely, and up to $25,000/yr can offset ordinary (W-2) income if you actively participate and your MAGI is under $100k (phasing out to $0 by $150k); unused losses carry forward. On sale, claimed depreciation is recaptured at up to 25%, and gains may owe capital-gains tax (a 1031 exchange can defer both). Figures are a year-1 estimate at your 24.0% rate — not tax advice; consult a CPA.
Condition & rehab AI · 3 photos
This 4-family property is in excellent condition with no visible repairs needed. It offers a great investment opportunity with immediate cash flow and potential for value appreciation through minor cosmetic upgrades.
Value-add opportunities
- Both Painting exterior and interior walls — Enhances curb appeal and interior aesthetics
- Both Reorganizing and decluttering interiors — Improves flow and makes spaces more inviting
- Both Upgrading kitchen appliances — Modernizes the space and attracts more buyers/renters
Renovation cost estimate screening
Value-add ROI direction
- Both Painting exterior and interior walls — Enhances curb appeal and interior aesthetics ↑
- Both Reorganizing and decluttering interiors — Improves flow and makes spaces more inviting ↑
- Both Upgrading kitchen appliances — Modernizes the space and attracts more buyers/renters ↑
ⓘ Cost ranges are severity-bucket heuristics (US national rule-of-thumb). Get contractor quotes + a written scope before underwriting a rehab budget.
Schools (NCES district)
- District
- East Hartford School District
- NCES district ID
- 0901260
- Math proficiency
- 17% ▼ -5.00%
- Reading proficiency
- 30% ▼ -7.00%
- Median HH income
- $49,691
- Composite
- 20.74/100
- National rank
- #8519
- State rank
- #140 of 153 in CT
Livability — East Hartford
- Score
- 73/100
- State rank
- #76
- US rank
- #5527
Category grades
Schools grade is shown separately in the Schools card above.
Census & demographics
- Census place
- East Hartford, CT
- County
- Hartford County · 754,208 people
- City population
- 50,918
- Metro
- Hartford-East Hartford-Middletown, CT
- Population (ZIP)
- 23,499
- Household income
- $56,663
- Rent vs Own
- Severe rent burden
- 1205.0
Population outlook (Capitol County) Hauer SSP2
- By 2040
- 1,063,519
Race, ethnicity, and origin ACS 2023
- Neighborhood character
- Diverse neighborhood (Simpson 0.68)
- Race & ethnicity
- Hispanic / Latino 44% Black 26% White 23% Two or more races 18% Asian 2%
- Hispanic origin (detail)
- Mexican 2% Puerto Rican 28% Dominican 2% Salvadoran 1%
- Common ancestry
- Romanian 4% Lithuanian 4% Estonian 2%
- Foreign-born
- 22% · Canada, Jamaica, Vietnam
- Languages at home
- 55% English-only · Spanish 35% Other Indo-European 3% French/Haitian/Cajun 2%
Political lean MEDSL · Capitol
- 2024 margin
- Strong D (+21.9) · D 60.1% · R 38.2% · Other 1.7%
- All cycles
- 2024: D+21.9
Not yet ingested
- Civics
- —
Market trends
- HPI YoY
- ▼ -65.15%
- Current HPI
- 306.0426
- Rent YoY
- —
- Metro
- Hartford-East Hartford-Middletown, CT
- State GDP YoY
- ▲ 1.06%
- F500 in state
- 38
Industry mix (Fortune 500 HQ in CT)
| Industry | F500 HQs | Revenue |
|---|---|---|
| Industrial Machinery | 4 | $38B |
|
||
| Insurance | 3 | $71B |
|
||
| Financial Services | 2 | $25B |
|
||
| Transportation / Logistics | 2 | $18B |
|
||
| Healthcare | 1 | $247B |
|
||
| Telecommunications | 1 | $55B |
|
||
Price history
+7.2% since first listed4 events — show timeline
- 2026-06-04 Sold (MLS) $450,000 Smart MLS
- 2026-05-12 Pending — Smart MLS
- 2026-05-07 Listed $419,900 Smart MLS
- 2026-05-04 Coming Soon $419,900 Smart MLS
Cash-flow waterfall
monthlySold comps — $/sqft
last 12 mo · ≤1 miLoading sold comps…