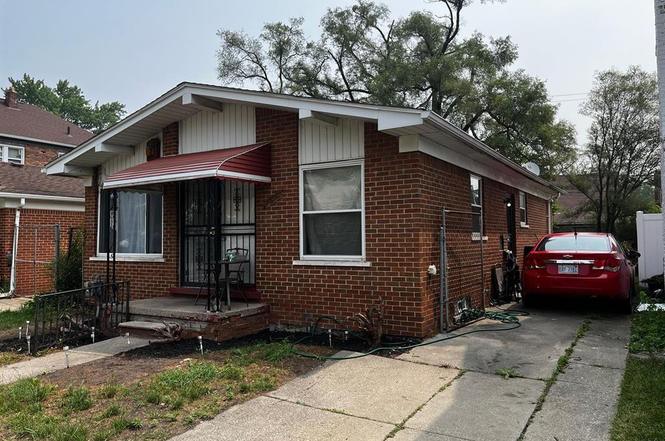
16816 Pinehurst St · Detroit, MI
Flood risk 1/10 · Minimal
- FEMA flood zone
- X (unshaded)
- Chance of flooding over 30 yrs
- 0.0%
- Est. flood insurance / yr
- $473 – $860
Fire risk 1/10 · Minimal
- Est. fire insurance / yr
- $784 – $1,456
Heat risk 3/10 · Minor
- Hot days now (above 97°F)
- 7 days/yr
- Hot days in 30 yrs
- 15 days/yr
Wind risk 2/10 · Minimal
- Chance of severe wind over 30 yrs
- —
Air-quality risk 3/10 · Minor
- Unhealthy air days now
- 2 days/yr
- Unhealthy air days in 30 yrs
- 5 days/yr
Risk factors via First Street. Map © Google.
Why this score? — see what drove the B- grade
The composite is a weighted blend of 9 inputs, each scored 0–100. Each bar is that input's sub-score; the figure is the points it added to the 100-point composite (weight × sub-score).
- Cash flow +30.0/30.0
- 1% rule +10.0/10.0
- DSCR +10.0/10.0
- ARV discount +7.6/15.0
- Livability +3.7/5.0
- Rent growth +3.4/5.0
- Condition / age +2.5/5.0
- Schools +1.3/10.0
- Appreciation +0.0/10.0
$69,000
🖨 Deal sheet 📄 Offer letter ✓ Due diligence
Listing remarks MLS
* * * CALLING ALL INVESTORS-TENANT OCCUPIED * * * * FULLY RENOVATED / FULLY COMPLIANT high performing single-family unit with over $35,000 in new upgrades including, NEW FLOORING, new kitchen, new paint, new furnace, partial new roof, new fixtures/ Current owner just took on a new and qualified tenant paying $1150 per month on a one-year lease. this property has a fantastic ROI and Property is located in a quiet and well-maintained neighborhood. Showings will be limited based on tenant availability. 2024 appraisal has been done * * * * * * * *
Key facts
- Fully renovated
- New furnace
- New kitchen
Tags
Property features AI
Finance
- Other: Subdivision: Arcadia Park No 1; Cross streets: west of McNichols, north of Wyoming; Directions: Head north on Wyoming Rd, onto McNichols Rd to Pinehurst
Exterior
- Parking: No garage
- Utilities: Public water; Public sewer
- Home design: Single-family residence; One level; Ground-level entry with steps; Brick exterior
- Construction: Brick construction; Brick/mortar foundation; Built area above grade: 975 square feet
- Exterior features: Paved road access; Lot roughly 36 x 108 (0.09 acres)
Interior
- Bathrooms: 1 full bathroom; 1 half bathroom
- Heating & cooling: Forced air heating (natural gas); No central cooling
- Interior features: Unfinished basement; Total of 4 rooms
Neighborhood map
What this means for you Summary
Snapshot
- This is a 3-bed/1.0-bath single-family listed at $69k.
Deal economics
- At list price, monthly cash flow is $510 ($6k/yr) — positive.
- The deal already cash-flows at list — no discount required.
- Meets the 1% rule at list price ($1k rent vs $69k).
- Cap rate 15.2% vs local median 10.2% in Detroit — top-decile yield for the area; either an underpriced asset or a hidden risk that comps aren't pricing in. Stress-test before assuming the spread holds.
Location & tenants
- Location reads 73/100 on livability (#218 in MI) — a middle-class / working-renter tenant base. Strengths: amenities A+, commute A+, cost of living A+; Watch: schools F, crime F, employment F.
- Detroit Public Schools Community District (urban): math 10% / reading 24% proficiency, ranked #499 of 540 in MI (top 92%) — low school quality limits family demand, transient renter base, plan for 1-2y turnover; 90% free/reduced lunch — lower-income household profile, screen leases tightly.
- Market conditions: Rents rising (+3.4%/yr); 349 active listings in the ZIP; 36 comparable units currently listed for rent nearby; rentals at typical pace (median 25d on market — plan ~3-4 weeks tenant-placement turnaround); 2,639 units permitted in Wayne County in 2024 (1,216 in 5+ unit buildings).
Forward outlook
- Local home prices are declining (-3.0%/yr); year-one equity from $477 of loan paydown is wiped out by about $2k of value loss. Plan a longer hold.
- Wayne County population projected at -17% by 2050 — secular population decline; favor cash flow + early exit over multi-decade hold.
- At projected returns (-3.0% appreciation + 3.4% rent growth), your $19k cash investment doubles in ~4 years — after that, you're playing with house money.
Negotiation context
- Only 8 days on market — expect competitive offers; lowballing is unlikely to land.
- 14 sale attempts since 21y ago with the ask held roughly flat each time — persistent listings suggest the price (not the market) is what's stuck; bring a comps-based counter.
- Current owner paid $50k; 38% above their basis — modest negotiation headroom, anchor on the comps not their cost.
Questions for the listing agent
- Built in 1965 — when were the roof, HVAC, electrical panel, plumbing, and water heater last replaced?
- Is there a deadline driving the sale (1031 exchange, divorce, estate, relocation)? That informs how much negotiation room exists.
- Schools are F-rated, which usually means shorter tenancies and higher turnover. Who's the typical renter profile here, and what's been the actual vacancy rate?
- Crime grade is F in this area — have there been break-ins, vandalism, or insurance claims at this property in the last 3 years? What carrier currently insures it and at what premium?
- What's the average days-on-market for RENTAL listings here right now (not sales)? A rising rental-DOM trend means longer vacancies and softer asking-rent achievability than the comps imply.
- What's the recent tenant-quality profile in this submarket — average credit score on applications, eviction rate, late-payment / NSF rate, and stable-employment percentage? A property-management company in the area should have these aggregated.
- How much new for-sale + rental construction is in the pipeline within 1–3 miles? Heavy new supply typically softens prices + rents 12–24 months out; constrained supply supports both.
Investment metrics
- 1% rule
- 1.81% ✓
- Cap rate
- 15.16%
- Cash-on-cash
- 31.69%
- DSCR
- 2.41
- GRM
- 4.6
CMA / ARV
- ARV (on-the-fly)
- $69,225
- Comps found
- 12
Show comp detail 12 sales within ~0.75 mi
| Address | Dist | Beds/Ba | Sqft | Sold | Price | $/sf | Match |
|---|---|---|---|---|---|---|---|
| 16503 Ilene St | 0.27mi | 2/1.0 (-1) | 1,048 (+8%) | 0mo | $115,000 | $110 | 70 |
| 17365 Meyers Rd | 0.39mi | 2/1.0 (-1) | 942 (-3%) | 4mo | $49,000 | $52 | 68 |
| 16919 Littlefield St | 0.53mi | 3/2.0 | 980 (+0%) | 5mo | $199,900 | $204 | 66 |
| 15775 Indiana St | 0.67mi | 3/1.5 | 967 (-1%) | 1mo | $45,000 | $47 | 64 |
| 15732 Manor St | 0.58mi | 3/1.0 | 930 (-5%) | 3mo | $50,000 | $54 | 63 |
| 15756 Meyers Rd | 0.56mi | 2/1.0 (-1) | 946 (-3%) | 4mo | $65,000 | $69 | 61 |
| 15754 Meyers Rd | 0.56mi | 2/1.0 (-1) | 946 (-3%) | 4mo | $65,000 | $69 | 61 |
| 17147 Appoline St | 0.32mi | 3/2.0 | 1,100 (+13%) | 1mo | $170,000 | $155 | 59 |
| 15856 Monte Vista St | 0.42mi | 3/1.0 | 848 (-13%) | 3mo | $59,900 | $71 | 56 |
| 18000 Ilene St | 0.57mi | 3/2.0 | 1,057 (+8%) | 2mo | $135,000 | $128 | 54 |
| 18081 Meyers Rd | 0.64mi | 2/1.5 (-1) | 946 (-3%) | 6mo | $75,000 | $79 | 53 |
| 16510 Littlefield St | 0.52mi | 2/1.0 (-1) | 861 (-12%) | 4mo | $45,000 | $52 | 48 |
Match score weights: distance 35% · size 25% · config 20% · recency 20%. Top-matched comps best support the ARV.
Projected returns pro-forma
-3.0% appreciation · 3.44% rent growth · sell at horizon
- IRR
- 27.1%
- Equity multiple
- 2.13×
- Total profit
- $21,885
- Equity at exit
- $10,288
- IRR
- 34.9%
- Equity multiple
- 4.27×
- Total profit
- $63,271
- Equity at exit
- $5,966
Cash invested: $19,320 (down + closing). Projections, not guarantees.
Landlord ↔ Tenant lean methodology
- Overall (STATE)
- 62 Landlord-Friendly
- State Michigan
- 62 Landlord-Friendly · EVEN
- County
- — inherits STATE
- City
- — inherits STATE
ZIP-level market 48221
- Rents YoY
- 3.4%
- Active inventory
- 349
- Price-to-rent
- 4.6×
Monthly cashflow live
- Estimated rent
- $1,249 high interval (Pro) →
- Mortgage (P&I)
- −$362
- Tax est. 1.5%
- −$86 /mo · $1,035/yr
- Insurance
- −$29
- HOA
- −$0
- Vacancy / Maint / Mgmt
- −$262
- Net cashflow
- $510
Break-even live
UW: 25.0% down · 7.5% · 30yr · 1.5% tax · 5.0% vac · 8.0% maint · 8.0% mgmt
Financing live
Cash to close
- Down payment
- $17,250
- Closing costs
- $2,070
- Reserves months
- —
- Total cash needed
- —
Loan-product check · same deal, 3 products live
Conventional
25% down · 7.5% · 30yr
- Down + closing
- —
- Monthly P&I
- —
- Monthly cashflow
- —
- DSCR
- —
- Eligible?
- —
Personal DTI + credit; lowest rate.
DSCR
20% down · 8.5% · 30yr
- Down + closing
- —
- Monthly P&I
- —
- Monthly cashflow
- —
- DSCR
- —
- Eligible?
- —
No personal income docs; deal must DSCR.
Hard money
10% down · 12.0% · 12mo
- Down + closing
- —
- Monthly P&I
- —
- Monthly cashflow
- —
- DSCR
- —
- Eligible?
- —
Short-term bridge; refi at stabilization.
Rent comps 36 comps
| Address | Beds | Baths | Sqft | Rent | $/sqft | DOM | Units | Dist |
|---|---|---|---|---|---|---|---|---|
| 17150 Meyers Rd Detroit, MI | 1.0–2.0 | 1.0 | 775 | $975 | $1.26 | 43d | 2 | 0.21mi |
| 16204 Steel St Detroit, MI | 3.0 | 1.0 | 969 | $1,150 | $1.19 | 43d | 1 | 0.36mi |
| 16503 Ward Ave Unit 2 Detroit, MI | 2.0 | 1.0 | 700 | $850 | $1.21 | 43d | 1 | 0.43mi |
| 16230 Indiana St Unit 2 Detroit, MI | 2.0 | 1.0 | 1050 | $1,200 | $1.14 | 18d | 1 | 0.53mi |
| 15760 Monte Vista St Detroit, MI | 2.0 | 1.0 | 1080 | $1,250 | $1.16 | 43d | 1 | 0.56mi |
| 15878 Kentucky St Detroit, MI | 2.0 | 1.0 | 800 | $900 | $1.12 | 43d | 1 | 0.59mi |
| 15839 Kentucky St Detroit, MI | 2.0 | 1.0 | 800 | $1,200 | $1.50 | 17d | 1 | 0.60mi |
| 15765 Washburn St Detroit, MI | 2.0 | 1.0 | 1093 | $950 | $0.87 | 43d | 1 | 0.63mi |
| 15512 Mendota St Apt 2 Detroit, MI | 2.0 | 1.0 | 1000 | $1,200 | $1.20 | 43d | 1 | 0.64mi |
| 15512 Mendota St Detroit, MI | 2.0 | 1.0 | 931 | $1,200 | $1.29 | 5d | 1 | 0.64mi |
| 15738 Sorrento Ave Detroit, MI | 3.0 | 1.0 | 762 | $1,175 | $1.54 | 43d | 1 | 0.65mi |
| 17159 Northlawn St Unit 17161 Detroit, MI | 2.0 | 1.0 | 1122 | $975 | $0.87 | 5d | 1 | 0.70mi |
| 15777 Wisconsin St Unit 77 Detroit, MI | 2.0 | 1.0 | 900 | $950 | $1.06 | 5d | 1 | 0.74mi |
| 15388 Appoline St #203 Detroit, MI | 2.0 | 1.0 | 900 | $850 | $0.94 | 43d | 1 | 0.79mi |
| 16505 Stansbury St Detroit, MI | 3.0 | 1.0 | 1100 | $1,250 | $1.14 | 11d | 1 | 0.85mi |
| 18010 Lesure St Detroit, MI | 3.0 | 1.0 | 1010 | $1,550 | $1.53 | 24d | 1 | 0.92mi |
| 18675 Meyers Rd Unit 18677 Detroit, MI | 2.0 | 1.0 | 942 | $1,100 | $1.17 | 43d | 1 | 0.97mi |
| 16722 Tuller St Detroit, MI | 3.0 | 1.5 | 1100 | $1,500 | $1.36 | 16d | 1 | 0.98mi |
| 15517 Lesure St Unit BDRM1A Detroit, MI | 2.0 | 1.0 | 1000 | $850 | $0.85 | 24d | 1 | 0.99mi |
| 15340 Hartwell St Detroit, MI | 2.0 | 1.0 | 900 | $1,300 | $1.44 | 16d | 1 | 1.01mi |
| 15771 Turner St Detroit, MI | 2.0 | 1.0 | 1000 | $1,049 | $1.05 | 43d | 1 | 1.07mi |
| 18512 Schaefer Hwy Detroit, MI | 2.0 | 1.0 | 962 | $1,200 | $1.25 | 24d | 1 | 1.08mi |
| 15387 Lesure St Detroit, MI | 3.0 | 1.0 | 1064 | $1,350 | $1.27 | 12d | 1 | 1.09mi |
| 14881 Mendota St Detroit, MI | 3.0 | 1.0 | 1026 | $1,100 | $1.07 | 24d | 1 | 1.11mi |
| 17147 Monica St Unit 2 1 Detroit, MI | 2.0 | 1.0 | 900 | $975 | $1.08 | 24d | 1 | 1.17mi |
| 17145 Santa Rosa Dr Unit 1 Detroit, MI | 3.0 | 1.0 | 1050 | $1,400 | $1.33 | 18d | 1 | 1.23mi |
| 14847 Cheyenne St Detroit, MI | 3.0 | 2.0 | 849 | $1,150 | $1.35 | 18d | 1 | 1.24mi |
| 14891 Hartwell St Detroit, MI | 3.0 | 1.0 | 1000 | $1,150 | $1.15 | 43d | 1 | 1.27mi |
| 7350 Globe St Detroit, MI | 3.0 | 1.0 | 1000 | $1,550 | $1.55 | 3d | 1 | 1.27mi |
| 17551 Santa Rosa Dr Detroit, MI | 2.0 | 1.0 | 1036 | $1,095 | $1.06 | 43d | 1 | 1.29mi |
| 14903 Tracey St Detroit, MI | 3.0 | 1.0 | 1004 | $1,100 | $1.10 | 16d | 1 | 1.31mi |
| 17215 Warrington Dr Detroit, MI | 2.0 | 1.0 | 1015 | $2,000 | $1.97 | 43d | 1 | 1.40mi |
| 14570 Cherrylawn St Detroit, MI | 3.0 | 1.0 | 840 | $1,250 | $1.49 | 12d | 1 | 1.45mi |
| 15073 Strathmoor St Detroit, MI | 2.0 | 1.0 | 860 | $1,350 | $1.57 | 16d | 1 | 1.46mi |
| 14656 Roselawn St Detroit, MI | 3.0 | 1.0 | 1000 | $1,200 | $1.20 | 17d | 1 | 1.46mi |
| 14550 Northlawn St Detroit, MI | 3.0 | 2.0 | 950 | $1,200 | $1.26 | 16d | 1 | 1.49mi |
Listing history 7 events
-
2026-06-18days on market $69,000 Active 8 DOM
-
2026-06-17days on market $69,000 Active 7 DOM
-
2026-06-16days on market $69,000 Active 6 DOM
-
2026-06-15days on market $69,000 Active 5 DOM
-
2026-06-13days on market $69,000 Active 3 DOM
-
2026-06-13remarks 563-char remark
-
2026-06-13$69,000 Active 2 DOM
ⓘ Source: listings_history table (triggers on properties + properties_extension) + one-shot
backfill from property_details.listing_events for pre-trigger history.
Climate risk First Street
- Flood 1/10 Low FEMA zone X (unshaded) · 0% chance over 30 yrs
- Wildfire 1/10 Low
- Heat 3/10 Moderate 7 d/yr ≥97°F today · 15 d/yr by 30 yrs out
- Wind 2/10 Low
- Air quality 3/10 Moderate 2 unhealthy d/yr today · 5 by 30 yrs out
Nearby sold comps map
Loading sold comps map…
Walkable amenities ~0.75 mi
Loading nearby amenities…
Taxation est. · year 1
- Rental income
- $14,992
- − Mortgage interest
- −$3,865
- − Property taxes
- −$1,035
- − Insurance
- −$345
- − Repairs & maintenance
- −$1,199
- − Management
- −$1,199
- − Depreciation
- −$2,007
- Taxable income
- $5,341
- Est. tax owed @ 24.0%
- −$1,282
- After-tax cash flow
- $4,840/yr
For passive investors: Depreciation is non-cash, so a rental often shows a tax loss while cash-flowing — sheltering income. Rental losses are passive: they offset passive income freely, and up to $25,000/yr can offset ordinary (W-2) income if you actively participate and your MAGI is under $100k (phasing out to $0 by $150k); unused losses carry forward. On sale, claimed depreciation is recaptured at up to 25%, and gains may owe capital-gains tax (a 1031 exchange can defer both). Figures are a year-1 estimate at your 24.0% rate — not tax advice; consult a CPA.
Schools (NCES district)
- District
- Detroit Public Schools Community District
- NCES district ID
- 2601103
- Math proficiency
- 10% ▼ -2.00%
- Reading proficiency
- 24% ▲ 6.00%
- Median HH income
- $25,815
- Composite
- 13.06/100
- National rank
- #9564
- State rank
- #499 of 540 in MI
Livability — Detroit
- Score
- 73/100
- State rank
- #218
- US rank
- #5427
Category grades
Schools grade is shown separately in the Schools card above.
Census & demographics
- Census place
- Detroit, MI
- County
- Wayne County · 1,562,939 people
- City population
- 572,865
- Metro
- Detroit-Warren-Dearborn, MI
- Population (ZIP)
- 41,392
- Household income
- $57,878
- Rent vs Own
- Severe rent burden
- 1646.0
Population outlook (Wayne County) Hauer SSP2
- Today (2025)
- 1,675,273 people
- By 2030
- 1,620,300 · -3.3%
- By 2040
- 1,502,341 · -10.3%
- By 2050
- 1,384,039 · -17.4%
- By 2075
- 1,124,592 · -32.9%
- By 2100
- 881,193 · -47.4%
Race, ethnicity, and origin ACS 2023
- Neighborhood character
- Predominantly Black (85%)
- Race & ethnicity
- Black 85% White 8% Two or more races 4% Asian 1%
- Common ancestry
- Romanian 1% Lithuanian 1%
- Foreign-born
- 2% · Canada
- Languages at home
- 97% English-only · Spanish 1% Other Indo-European 1%
Political lean MEDSL · Wayne
- 2024 margin
- Strong D (+29.0) · D 62.7% · R 33.7% · Other 3.6%
- 2008→2024 swing
- -20.5pp toward R · 2008: 49.5pp · 2024: 29.0pp
- All cycles
- 2024: D+29.0 2020: D+38.1 2016: D+37.3 2012: D+46.9 2008: D+49.5
Not yet ingested
- Civics
- —
Market trends
- HPI YoY
- ▼ -433.14%
- Current HPI
- 280.5434
- Rent YoY
- ▲ 3.44%
- Metro
- Detroit-Warren-Dearborn, MI
- State GDP YoY
- ▲ 1.37%
- F500 in state
- 28
Industry mix (Fortune 500 HQ in MI)
| Industry | F500 HQs | Revenue |
|---|---|---|
| Automotive Parts | 3 | $48B |
|
||
| Automotive | 2 | $372B |
|
||
| Chemicals | 1 | $45B |
|
||
| Automotive Retail | 1 | $29B |
|
||
| Healthcare / Medical Devices | 1 | $23B |
|
||
| Automotive Technology | 1 | $20B |
|
||
Price history
+57.2% since first listed27 events — show timeline
- 2026-06-10 Listed $69,000 REALCOMP
- 2026-06-10 Listed $69,000 MiRealSource-MiMLS
- 2025-11-02 Listing Removed — REALCOMP
- 2025-11-02 Listing Removed — MiRealSource-MiMLS
- 2025-08-08 Listed $89,000 REALCOMP
- 2025-08-08 Listing Removed — MiRealSource-MiMLS
- 2025-08-08 Listing Removed — REALCOMP
- 2025-08-08 Listed $89,000 MiRealSource-MiMLS
- 2025-06-27 Listed $99,000 MiRealSource-MiMLS
- 2025-06-27 Listed $99,000 REALCOMP
- 2025-06-24 Listing Removed — REALCOMP
- 2025-06-24 Listing Removed — MiRealSource-MiMLS
- 2025-03-06 Listed $115,000 REALCOMP
- 2025-03-06 Listed $115,000 MiRealSource-MiMLS
- 2023-08-31 Listing Removed — MiRealSource-MiMLS
- 2023-08-31 Listing Removed — REALCOMP
- 2023-07-01 Listed $115,000 MiRealSource-MiMLS
- 2023-07-01 Listed $115,000 REALCOMP
- 2023-03-13 Listing Removed — MiRealSource-MiMLS
- 2023-03-13 Listing Removed — REALCOMP
- 2022-12-13 Listed $65,000 MiRealSource-MiMLS
- 2022-12-13 Listed $65,000 REALCOMP
- 2021-05-27 Sold (Public Records) $50,000 Public Records
- 2008-12-02 Sold (MLS) $7,850 REALCOMP
- 2008-08-22 Listed $8,900 REALCOMP
- 2005-12-29 Sold (MLS) $43,500 REALCOMP
- 2005-09-27 Listed $43,900 REALCOMP
Property tax history
+17.8%/yrLatest (2025): $4,309 · +32.2% YoY. Source: county tax records.
Cash-flow waterfall
monthlySold comps — $/sqft
last 12 mo · ≤1 miLoading sold comps…