142 Cape Horn Dr · Columbia, SC
Flood risk 1/10 · Minimal
- FEMA flood zone
- X (shaded)
- Chance of flooding over 30 yrs
- 0.0%
- Est. flood insurance / yr
- $507 – $1,088
Fire risk 5/10 · Moderate
- Est. fire insurance / yr
- $783 – $1,453
Heat risk 6/10 · Moderate
- Hot days now (above 108°F)
- 7 days/yr
- Hot days in 30 yrs
- 16 days/yr
Wind risk 6/10 · Moderate
- Chance of severe wind over 30 yrs
- 67.0%
Air-quality risk 2/10 · Minimal
- Unhealthy air days now
- 2 days/yr
- Unhealthy air days in 30 yrs
- 2 days/yr
Risk factors via First Street. Map © Google.
Why this score? — see what drove the D grade
The composite is a weighted blend of 9 inputs, each scored 0–100. Each bar is that input's sub-score; the figure is the points it added to the 100-point composite (weight × sub-score).
- Cash flow +12.3/30.0
- ARV discount +7.5/15.0
- Condition / age +5.0/5.0
- Livability +3.9/5.0
- 1% rule +3.7/10.0
- DSCR +3.7/10.0
- Rent growth +3.0/5.0
- Schools +2.6/10.0
- Appreciation +0.0/10.0
$240,610
🖨 Deal sheet (PDF) 📄 Offer letter ✓ Due diligence
Listing remarks
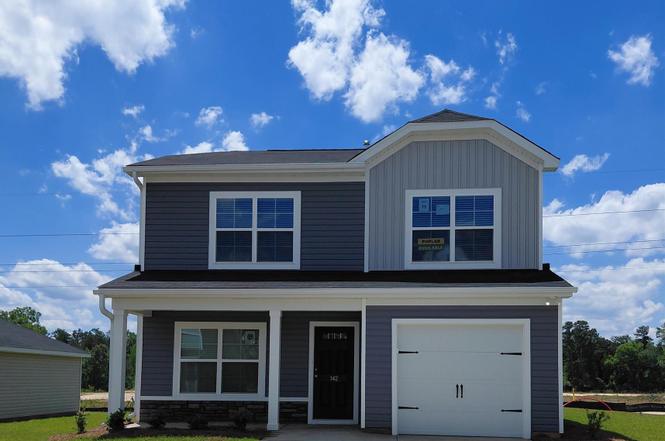
Welcome to the Poplar plan at the Reserve at Millcreek! A thoughtfully designed 1,404 sq. ft. two story home offering 3 bedrooms with 2.5 baths. Designed for easy, modern living. All bedrooms are located upstairs, including the primary suite and a conveniently placed laundry room. The main level features a comfortable living room and dining area, a functional kitchen layout including a half bath for guests. A 1 car garage and efficient design make this floor plan a great fit for modern living. (stock photos used) Disclaimer: CMLS has not reviewed and, therefore, does not endorse vendors who may appear in listings.
Key facts
- 7,840 sq ft lot
- Garage
- Built 2026
Property features AI
Finance
- HOA & community: Has homeowners association
Exterior
- Parking: Attached garage with 1 garage space
- Utilities: Public water; Public sewer
- Home design: Two-story home
- Construction: Slab foundation
- Exterior features: Vinyl exterior; Paved road access
Interior
- Kitchen: Granite countertops
- Bedrooms: Master bedroom on second level; Additional bedrooms on second level
- Bathrooms: Two full bathrooms; One partial bathroom; One half bathroom
- Heating & cooling: Central heating; Gas heating on first level; Gas heating on second level; Central cooling; Split system cooling
- Interior features: Walk-in closet in master bedroom; Granite countertops in kitchen; Electric laundry
- Laundry & utility: Electric laundry located on second level
Neighborhood map
What this means for you Summary
Snapshot
- This is a 3-bed/2.5-bath single-family listed at $241k. Condition is rated excellent.
Deal economics
- At list price, monthly cash flow is $-44 ($-529/yr) — negative.
- To cash-flow at today's rent, offer at most $234k (2.7% below list).
- To meet the 1% rule (rent ≥ 1% of price), the offer needs to be $209k (13.2% below list).
- Recommended offer: $209k (13.2% below list) — sets the bar for 1% rule.
- Cap rate 6.1% vs local median 5.1% in Columbia — meaningfully above typical; check what's discounted (condition, days-on-market, listing class) to confirm the premium yield is real.
Location & tenants
- Location reads 78/100 on livability (#18 in SC, #2,436 nationally) — a middle-class / working-renter tenant base. Strengths: amenities A+, commute A+, cost of living A+; Watch: employment D, crime F.
- Richland 01 (urban): math 26% / reading 36% proficiency, ranked #54 of 80 in SC (top 68%) — families likely to look elsewhere, expect single-tenant / working-renter base with shorter leases; 64% free/reduced lunch — lower-income household profile, screen leases tightly.
- Zoned schools: Mill Creek Elementary (math 22% / reading 22%, grade F, #475 of 597 statewide, top 81%, 339 students, 100% FRL); Hopkins Middle (math 8% / reading 17%, grade F, #213 of 229 statewide, top 94%, 493 students, 100% FRL); Lower Richland High (math 5% / reading 64%, grade F, #185 of 196 statewide, top 94%, 1,244 students, 100% FRL) — zoned schools average 100% FRL vs 64% district-wide (36 pts higher); higher-poverty schools than district average — tighter screening recommended.
- Market conditions: Rents rising (+2.1%/yr); 298 active listings in the ZIP; 3 comparable units currently listed for rent nearby; rentals at typical pace (median 26d on market — plan ~3-4 weeks tenant-placement turnaround); 3,472 units permitted in Richland County in 2024 (1,096 in 5+ unit buildings).
- This rent runs 43% of the median local income ($59k/yr) — at the standard rent-burdened threshold; future hikes will face affordability resistance.
Forward outlook
- Local home prices are declining (-3.0%/yr); year-one equity from $2k of loan paydown is wiped out by about $7k of value loss. Plan a longer hold.
- Richland County population projected at +30% by 2050 — long-run rental-demand tailwind backs the buy-and-hold thesis.
Negotiation context
- It's been on market 63 days — a 6% lower offer ($226k) is reasonable based on typical stale-listing flexibility.
- 3 sale attempts with the ask held roughly flat each time — persistent listings suggest the price (not the market) is what's stuck; bring a comps-based counter.
Risks & watch-outs
- Climate carrying-cost: major wind risk, 67% chance of damaging wind over 30y; moderate wildfire risk; extreme-heat days projected 7→16/yr by 2055 (HVAC capex compounding) — expect insurance premiums to compound above CPI over the hold.
Questions for the listing agent
- What do current leases actually rent for vs. the listed asking? Can we see a recent rent roll and the last 12 months of T-12 income?
- It's been on market 63 days. Have you received any prior offers? Is the seller open to a 13% concession, seller financing, or rate buy-down credit?
- What does the HOA fee cover, when was the last increase, and are there any pending special assessments or reserve-fund shortfalls?
- Why hasn't it sold? Are there any deal-killer items the seller is aware of (foundation, flood, title, zoning, code violations)?
- Is there a deadline driving the sale (1031 exchange, divorce, estate, relocation)? That informs how much negotiation room exists.
- Schools are D-rated, which usually means shorter tenancies and higher turnover. Who's the typical renter profile here, and what's been the actual vacancy rate?
- Crime grade is F in this area — have there been break-ins, vandalism, or insurance claims at this property in the last 3 years? What carrier currently insures it and at what premium?
- The area grade is low — what's the realistic commute time and amenity access for the typical tenant pool here? Any planned neighborhood developments (good or bad) we should know about?
- What's the average days-on-market for RENTAL listings here right now (not sales)? A rising rental-DOM trend means longer vacancies and softer asking-rent achievability than the comps imply.
- What's the recent tenant-quality profile in this submarket — average credit score on applications, eviction rate, late-payment / NSF rate, and stable-employment percentage? A property-management company in the area should have these aggregated.
- How much new for-sale + rental construction is in the pipeline within 1–3 miles? Heavy new supply typically softens prices + rents 12–24 months out; constrained supply supports both.
Investment metrics
- 1% rule
- 0.87% ✗
- Cap rate
- 6.07%
- Cash-on-cash
- -0.79%
- DSCR
- 0.97
- GRM
- 9.6
CMA / ARV
No comps found within radius.
Projected returns pro-forma
-3.0% appreciation · 2.08% rent growth · sell at horizon
- IRR
- -18.6%
- Equity multiple
- 0.35×
- Total profit
- $-43,661
- Equity at exit
- $35,876
- IRR
- -13.0%
- Equity multiple
- 0.27×
- Total profit
- $-49,145
- Equity at exit
- $20,804
Cash invested: $67,371 (down + closing). Projections, not guarantees.
Landlord ↔ Tenant lean methodology
- Overall (STATE)
- 90 Strongly Landlord-Friendly
- State South Carolina
- 90 Strongly Landlord-Friendly · R+6
- County
- — inherits STATE
- City
- — inherits STATE
ZIP-level market 29209
- Rents YoY
- 2.1%
- Active inventory
- 298
- Price-to-rent
- 9.6×
Monthly cashflow live
- Estimated rent
- $2,088 medium interval (Pro) →
- Mortgage (P&I)
- −$1,262
- Tax est. 1.5%
- −$301 /mo · $3,609/yr
- Insurance
- −$100
- HOA
- −$31
- Vacancy / Maint / Mgmt
- −$439
- Net cashflow
- $-44
Break-even live
Sensitivity live
| Price | -10% $122 | -5% $39 | +0% $-44 | +5% $-127 | +10% $-210 |
|---|---|---|---|---|---|
| Rent | -10% $-209 | -5% $-127 | +0% $-44 | +5% $38 | +10% $121 |
| Rate | -1.0pp $77 | -0.5pp $17 | base $-44 | +0.5pp $-106 | +1.0pp $-170 |
UW: 25.0% down · 7.5% · 30yr · 1.5% tax · 5.0% vac · 8.0% maint · 8.0% mgmt
Financing live
Cash to close
- Down payment
- $60,152
- Closing costs
- $7,218
- Reserves months
- —
- Total cash needed
- —
Loan-product check · same deal, 3 products live
Conventional
25% down · 7.5% · 30yr
- Down + closing
- —
- Monthly P&I
- —
- Monthly cashflow
- —
- DSCR
- —
- Eligible?
- —
Personal DTI + credit; lowest rate.
DSCR
20% down · 8.5% · 30yr
- Down + closing
- —
- Monthly P&I
- —
- Monthly cashflow
- —
- DSCR
- —
- Eligible?
- —
No personal income docs; deal must DSCR.
Hard money
10% down · 12.0% · 12mo
- Down + closing
- —
- Monthly P&I
- —
- Monthly cashflow
- —
- DSCR
- —
- Eligible?
- —
Short-term bridge; refi at stabilization.
Rent comps 3 comps
| Address | Beds | Baths | Sqft | Rent | $/sqft | DOM | Units | Dist |
|---|---|---|---|---|---|---|---|---|
| 448 Red Poll Way Columbia, SC | 4.0 | 2.5 | 1783 | $2,183 | $1.22 | 25d | 1 | 1.17mi |
| 425 Red Poll Way Columbia, SC | 4.0 | 2.5 | 1783 | $2,133 | $1.20 | 25d | 1 | 1.18mi |
| 320 Beacons Field Rd Columbia, SC | 3.0 | 2.5 | 1663 | $2,183 | $1.31 | 16d | 1 | 1.23mi |
HOA detail
- Monthly dues
- $31 · $372/yr
Listing history 20 events
-
2026-06-21days on market $240,610 Active 63 DOM
-
2026-06-18days on market $240,610 Active 60 DOM
-
2026-06-17days on market $240,610 Active 59 DOM
-
2026-06-16days on market $240,610 Active 58 DOM
-
2026-06-15days on market $240,610 Active 57 DOM
-
2026-06-14days on market $240,610 Active 55 DOM
-
2026-06-10days on market $240,610 Active 52 DOM
-
2026-06-09days on market $240,610 Active 51 DOM
-
2026-06-08days on market $240,610 Active 50 DOM
-
2026-06-07days on market $240,610 Active 49 DOM
-
2026-06-03days on market $240,610 Active 45 DOM
-
2026-06-03days on market $240,610 Active 44 DOM
-
2026-06-01days on market $240,610 Active 43 DOM
-
2026-05-31days on market $240,610 Active 42 DOM
-
2026-05-05status Active
-
2026-04-03price $239,610
-
2026-04-03price $239,290
-
2026-04-02status Active
-
2026-03-06status Pending
-
2026-03-05$238,290 Active
ⓘ Source: listings_history table (triggers on properties + properties_extension) + one-shot
backfill from property_details.listing_events for pre-trigger history.
Climate risk First Street
- Flood 1/10 Low FEMA zone X (shaded) · 0% chance over 30 yrs
- Wildfire 5/10 Major
- Heat 6/10 Major 7 d/yr ≥108°F today · 16 d/yr by 30 yrs out
- Wind 6/10 Major 67% chance of damaging wind over 30 yrs
- Air quality 2/10 Low 2 unhealthy d/yr today · 2 by 30 yrs out
Nearby sold comps map
Loading sold comps map…
Walkable amenities ~0.75 mi
Loading nearby amenities…
Taxation est. · year 1
- Rental income
- $25,059
- − Mortgage interest
- −$13,478
- − Property taxes
- −$3,609
- − Insurance
- −$1,203
- − Repairs & maintenance
- −$2,005
- − Management
- −$2,005
- − HOA
- −$372
- − Depreciation
- −$7,000
- Taxable loss
- −$4,612
- Est. tax savings @ 24.0%
- +$1,107
- After-tax cash flow
- $578/yr
For passive investors: Depreciation is non-cash, so a rental often shows a tax loss while cash-flowing — sheltering income. Rental losses are passive: they offset passive income freely, and up to $25,000/yr can offset ordinary (W-2) income if you actively participate and your MAGI is under $100k (phasing out to $0 by $150k); unused losses carry forward. On sale, claimed depreciation is recaptured at up to 25%, and gains may owe capital-gains tax (a 1031 exchange can defer both). Figures are a year-1 estimate at your 24.0% rate — not tax advice; consult a CPA.
Condition & rehab AI · 13 photos
This home is in excellent condition with no visible repairs or maintenance needed. It is move-in ready and would benefit from some exterior painting and landscaping to enhance its curb appeal.
Value-add opportunities
- Resale Painting the exterior siding and roof — Painting the exterior can enhance the curb appeal and make the home look more attractive to potential buyers.
- Rental Landscaping the front yard — Landscaping can improve the curb appeal and make the home more attractive to potential renters.
Renovation cost estimate screening
Value-add ROI direction
- Resale Painting the exterior siding and roof — Painting the exterior can enhance the curb appeal and make the home look more attractive to potential buyers. ↑
- Rental Landscaping the front yard — Landscaping can improve the curb appeal and make the home more attractive to potential renters. ↑
ⓘ Cost ranges are severity-bucket heuristics (US national rule-of-thumb). Get contractor quotes + a written scope before underwriting a rehab budget.
Schools (NCES district)
- District
- Richland 01
- NCES district ID
- 4503360
- Math proficiency
- 26% ▼ -7.00%
- Reading proficiency
- 36% ▼ -5.00%
- Median HH income
- $38,931
- Composite
- 25.94/100
- National rank
- #7335
- State rank
- #54 of 80 in SC
Livability — Columbia
- Score
- 78/100
- State rank
- #18
- US rank
- #2436
Category grades
Schools grade is shown separately in the Schools card above.
Census & demographics
- County
- Richland County · 389,530 people
- City population
- 335,994
- Metro
- Columbia, SC
- Population (ZIP)
- 38,041
- Household income
- $58,772
- Rent vs Own
- Severe rent burden
- 1716.0
Population outlook (Richland County) Hauer SSP2
- Today (2025)
- 459,667 people
- By 2030
- 487,524 · +6.1%
- By 2040
- 542,035 · +17.9%
- By 2050
- 595,371 · +29.5%
- By 2075
- 732,998 · +59.5%
- By 2100
- 820,415 · +78.5%
Race, ethnicity, and origin ACS 2023
- Neighborhood character
- Diverse neighborhood (Simpson 0.62)
- Race & ethnicity
- Black 48% White 39% Two or more races 6% Hispanic / Latino 6% Asian 2%
- Hispanic origin (detail)
- Mexican 3% Puerto Rican 2%
- Common ancestry
- Slovak 2% Serbian 2% Italian 1%
- Foreign-born
- 6% · Canada, Jamaica
- Languages at home
- 93% English-only · Spanish 3% Arabic 1% Other Indo-European 1%
Political lean MEDSL · Richland
- 2024 margin
- Solid D (+34.6) · D 66.4% · R 31.8% · Other 1.8%
- 2008→2024 swing
- +5.7pp toward D · 2008: 28.9pp · 2024: 34.6pp
- All cycles
- 2024: D+34.6 2020: D+38.3 2016: D+32.9 2012: D+33.3 2008: D+28.9
Not yet ingested
- Civics
- —
Market trends
- HPI YoY
- ▼ -142.10%
- Current HPI
- 205.5679
- Rent YoY
- ▲ 2.08%
- Metro
- Columbia, SC
- State GDP YoY
- ▲ 4.51%
- F500 in state
- 2
Industry mix (Fortune 500 HQ in SC)
| Industry | F500 HQs | Revenue |
|---|---|---|
| Packaging | 1 | $7B |
|
||
Price history
+0.6% since first listed6 events — show timeline
- 2026-05-05 Relisted — Consolidated MLS
- 2026-04-03 Price Changed $239,610 Consolidated MLS
- 2026-04-03 Price Changed $239,290 Consolidated MLS
- 2026-04-02 Relisted — Consolidated MLS
- 2026-03-06 Pending — Consolidated MLS
- 2026-03-05 Listed $238,290 Consolidated MLS
Cash-flow waterfall
monthlySold comps — $/sqft
last 12 mo · ≤1 miLoading sold comps…