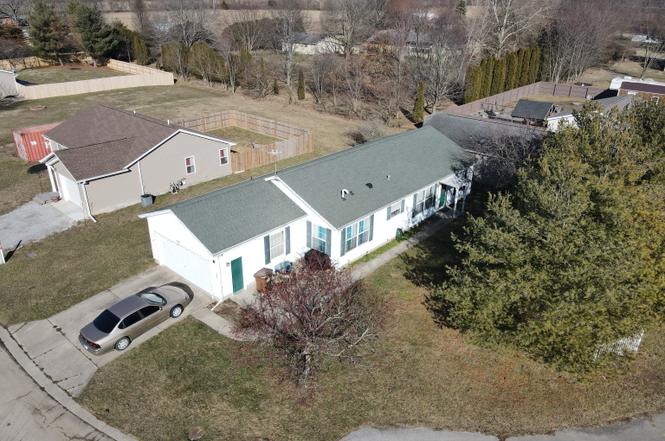
781 Northern Acres Dr · Ladoga, IN
Flood risk 1/10 · Minimal
- FEMA flood zone
- X (unshaded)
- Chance of flooding over 30 yrs
- 0.0%
- Est. flood insurance / yr
- $507 – $1,088
Fire risk 1/10 · Minimal
- Est. fire insurance / yr
- $717 – $1,331
Heat risk 3/10 · Minor
- Hot days now (above 101°F)
- 7 days/yr
- Hot days in 30 yrs
- 18 days/yr
Wind risk 2/10 · Minimal
- Chance of severe wind over 30 yrs
- 1.0%
Air-quality risk 2/10 · Minimal
- Unhealthy air days now
- 1 days/yr
- Unhealthy air days in 30 yrs
- 2 days/yr
Risk factors via First Street. Map © Google.
Why this score? — see what drove the C+ grade
The composite is a weighted blend of 9 inputs, each scored 0–100. Each bar is that input's sub-score; the figure is the points it added to the 100-point composite (weight × sub-score).
- Cash flow +15.3/30.0
- ARV discount +15.0/15.0
- Appreciation +10.0/10.0
- DSCR +4.7/10.0
- Schools +4.4/10.0
- Livability +3.4/5.0
- 1% rule +3.0/10.0
- Rent growth +2.5/5.0
- Condition / age +2.5/5.0
$151,800
🖨 Deal sheet (PDF) 📄 Offer letter ✓ Due diligence
Listing remarks
3-bedroom, 2-bath ranch with nearly 1,500 square feet, located in the heart of Ladoga. Enjoy small-town living with convenient interstate access. This home offers an open floor plan, a kitchen with all appliances, an eat-in area plus additional dining space. The spacious primary bedroom includes a walk-in closet and a large soaking tub in the ensuite bath. Includes a 2-car garage for added storage and convenience.
Key facts
- 9,583 sq ft lot
- 2 garage spots
- Built 2003
Property features AI
Exterior
- Parking: Attached 2-car garage; Finished garage with garage door opener, keyless entry, and service door; Guest street parking
- Security: Keyless entry; Smoke alarm
- Utilities: Public water; Municipal sewer connection; 200+ amp electric service; Cable available; Natural gas connected; Electricity connected
- Home design: Single-family residence; One level
- Construction: Vinyl siding; Block foundation
- Exterior features: Covered patio/porch; Corner lot (approximately 0.22 acres)
Interior
- Kitchen: Dishwasher; Garbage disposal; Microwave with hood; Gas oven/range; Refrigerator; Eat-in kitchen with pantry
- Bedrooms: Primary bedroom with walk-in closet and bedroom split; Three bedrooms on the main level
- Bathrooms: Two full bathrooms; Primary bathroom with full shower stall and garden tub
- Heating & cooling: Forced air heating (natural gas); Central air conditioning
- Interior features: Attic access; Eat-in kitchen; Pantry; Walk-in closet(s); Smoke alarm; Laundry in unit
- Laundry & utility: Washer and dryer included; Electric water heater
Neighborhood map
What this means for you Summary
Snapshot
- This is a 3-bed/1.0-bath single-family listed at $152k.
Deal economics
- At list price, monthly cash flow is $55 ($655/yr) — positive.
- The deal already cash-flows at list — no discount required.
- To meet the 1% rule (rent ≥ 1% of price), the offer needs to be $121k (20.4% below list).
- Recommended offer: $121k (20.4% below list) — sets the bar for 1% rule.
Location & tenants
- Location reads 67/100 on livability (#244 in IN) — a middle-class / working-renter tenant base. Strengths: crime A+, cost of living A+, housing A+; Watch: employment C-, amenities F, commute F.
- South Montgomery Community School Corporation (rural): math 52% / reading 49% proficiency, ranked #46 of 301 in IN (top 15%) — acceptable for families but not a draw, mixed tenant base, ~2y average lease.
- Market conditions: 14 active listings in the ZIP; 52 units permitted in Montgomery County in 2024 (0 in 5+ unit buildings).
Forward outlook
- In year one you build about $16k of equity ($1k loan paydown + $15k appreciation (10.0% local appreciation)).
- Montgomery County population projected to shrink 9% by 2050 — rents likely to lag national; underwrite the cash flow, not the appreciation.
- At projected returns (10.0% appreciation + 3.0% rent growth), your $43k cash investment doubles in ~3 years — after that, you're playing with house money.
- By year 3, paydown + projected appreciation supports a ~$41k cash-out refi (75% LTV) — recoverable capital for the next deal without selling this one.
Negotiation context
- It's been on market 284 days — a 12% lower offer ($134k) is reasonable based on typical stale-listing flexibility.
- 8 sale attempts since 8y ago; this cycle's ask has dropped $27k (15%) from the opening price — seller is motivated, your offer sets the floor, not the list.
- Current owner paid $111k; 37% above their basis — modest negotiation headroom, anchor on the comps not their cost.
Questions for the listing agent
- It's been on market 284 days. Have you received any prior offers? Is the seller open to a 20% concession, seller financing, or rate buy-down credit?
- Why hasn't it sold? Are there any deal-killer items the seller is aware of (foundation, flood, title, zoning, code violations)?
- Is there a deadline driving the sale (1031 exchange, divorce, estate, relocation)? That informs how much negotiation room exists.
- Schools are B-rated — typically a magnet for longer-tenancy family renters. What's the average tenant stay here, and is there a school-zone premium baked into asking?
- What's the average days-on-market for RENTAL listings here right now (not sales)? A rising rental-DOM trend means longer vacancies and softer asking-rent achievability than the comps imply.
- What's the recent tenant-quality profile in this submarket — average credit score on applications, eviction rate, late-payment / NSF rate, and stable-employment percentage? A property-management company in the area should have these aggregated.
- How much new for-sale + rental construction is in the pipeline within 1–3 miles? Heavy new supply typically softens prices + rents 12–24 months out; constrained supply supports both.
Investment metrics
- 1% rule
- 0.80% ✗
- Cap rate
- 6.72%
- Cash-on-cash
- 1.54%
- DSCR
- 1.07
- GRM
- 10.5
CMA / ARV
- ARV (on-the-fly)
- $196,560
- Comps found
- 9
Show comp detail 9 sales within ~0.75 mi
| Address | Dist | Beds/Ba | Sqft | Sold | Price | $/sf | Match |
|---|---|---|---|---|---|---|---|
| 772 Northern Acres Dr | 0.04mi | 3/2.0 | 1,426 (-2%) | 1mo | $278,000 | $195 | 90 |
| 301 W Garden St | 0.27mi | 3/2.0 | 1,404 (-4%) | 13mo | $275,000 | $196 | 66 |
| 312 N Franklin St | 0.43mi | 3/2.0 | 1,448 (-0%) | 18mo | $169,900 | $117 | 60 |
| 413 West St | 0.40mi | 3/2.0 | 1,410 (-3%) | 16mo | $140,000 | $99 | 58 |
| 709 E Elm St | 0.60mi | 3/1.0 | 1,522 (+4%) | 14mo | $139,300 | $92 | 53 |
| 806 E Taylor St | 0.56mi | 3/1.0 | 1,551 (+6%) | 12mo | $210,000 | $135 | 52 |
| 228 W Elm St | 0.57mi | 3/1.0 | 1,344 (-8%) | 14mo | $181,500 | $135 | 49 |
| 323 N Washington St | 0.41mi | 3/2.0 | 1,352 (-7%) | 21mo | $202,000 | $149 | 47 |
| 405 E Elm St | 0.54mi | 3/2.0 | 1,280 (-12%) | 17mo | $169,900 | $133 | 37 |
Match score weights: distance 35% · size 25% · config 20% · recency 20%. Top-matched comps best support the ARV.
Projected returns pro-forma
10.0% appreciation · 3.0% rent growth · sell at horizon
- IRR
- 25.4%
- Equity multiple
- 3.03×
- Total profit
- $86,076
- Equity at exit
- $136,753
- IRR
- 22.3%
- Equity multiple
- 6.90×
- Total profit
- $250,602
- Equity at exit
- $294,914
Cash invested: $42,504 (down + closing). Projections, not guarantees.
Landlord ↔ Tenant lean methodology
- Overall (STATE)
- 90 Strongly Landlord-Friendly
- State Indiana
- 90 Strongly Landlord-Friendly · R+11
- County
- — inherits STATE
- City
- — inherits STATE
ZIP-level market 47954
- Home prices YoY
- 5.0%
- Active inventory
- 14
- Price-to-rent
- 10.5×
Monthly cashflow live
- Estimated rent
- $1,209 medium interval (Pro) →
- Mortgage (P&I)
- −$796
- Tax from tax record
- −$41 /mo · $496/yr
- Insurance
- −$63
- HOA
- −$0
- Vacancy / Maint / Mgmt
- −$254
- Net cashflow
- $55
Break-even live
Sensitivity live
| Price | -10% $140 | -5% $98 | +0% $55 | +5% $12 | +10% $-31 |
|---|---|---|---|---|---|
| Rent | -10% $-41 | -5% $7 | +0% $55 | +5% $102 | +10% $150 |
| Rate | -1.0pp $131 | -0.5pp $93 | base $55 | +0.5pp $15 | +1.0pp $-25 |
UW: 25.0% down · 7.5% · 30yr · 1.5% tax · 5.0% vac · 8.0% maint · 8.0% mgmt
Financing live
Cash to close
- Down payment
- $37,950
- Closing costs
- $4,554
- Reserves months
- —
- Total cash needed
- —
Loan-product check · same deal, 3 products live
Conventional
25% down · 7.5% · 30yr
- Down + closing
- —
- Monthly P&I
- —
- Monthly cashflow
- —
- DSCR
- —
- Eligible?
- —
Personal DTI + credit; lowest rate.
DSCR
20% down · 8.5% · 30yr
- Down + closing
- —
- Monthly P&I
- —
- Monthly cashflow
- —
- DSCR
- —
- Eligible?
- —
No personal income docs; deal must DSCR.
Hard money
10% down · 12.0% · 12mo
- Down + closing
- —
- Monthly P&I
- —
- Monthly cashflow
- —
- DSCR
- —
- Eligible?
- —
Short-term bridge; refi at stabilization.
Listing history 50 events
-
2026-06-19days on market $151,800 Active 284 DOM
-
2026-06-18days on market $151,800 Active 283 DOM
-
2026-06-17days on market $151,800 Active 282 DOM
-
2026-06-16days on market $151,800 Active 281 DOM
-
2026-06-16price $151,800 Active 280 DOM
-
2026-06-15days on market $150,000 Active 280 DOM
-
2026-06-14days on market $150,000 Active 278 DOM
-
2026-06-12pricedays on market $150,000 Active 277 DOM
-
2026-06-09days on market $143,000 Active 274 DOM
-
2026-06-08days on market $143,000 Active 273 DOM
-
2026-06-07days on market $143,000 Active 272 DOM
-
2026-06-05days on market $143,000 Active 270 DOM
-
2026-06-03days on market $143,000 Active 268 DOM
-
2026-06-02days on market $143,000 Active 267 DOM
-
2026-06-01days on market $143,000 Active 266 DOM
-
2026-05-31days on market $143,000 Active 265 DOM
-
2026-05-30days on market $143,000 Active 264 DOM
-
2026-04-30status Pending
-
2026-04-30status Active
-
2026-03-04status Pending
-
2025-12-10price $143,000
-
2025-10-30price $147,400
-
2025-10-06price $154,900
-
2025-09-23status Active
-
2025-09-23price $159,000
-
2025-08-11status Pending
-
2025-07-28price $163,500
-
2025-07-18price $164,500
-
2025-07-09price $165,000
-
2025-06-30price $165,400
-
2025-06-09price $166,400
-
2025-06-03price $167,400
-
2025-05-22price $169,000
-
2025-05-05$179,000 Active
-
2024-09-20historical
-
2024-06-13price $154,000
-
2024-04-25status Active
-
2024-03-16status Pending
-
2024-03-16price $158,500
-
2024-03-15$139,900 Active
-
2023-09-08historical
-
2023-06-09price $159,900
-
2023-06-02price $159,900
-
2023-05-05price $164,900
-
2023-04-27price $164,900
-
2023-03-15$170,000 Active
-
2023-02-13$170,000 Active
-
2018-06-29soldstatus $111,000 Sold
-
2018-05-29status Pending
-
2018-05-21price $109,900
ⓘ Source: listings_history table (triggers on properties + properties_extension) + one-shot
backfill from property_details.listing_events for pre-trigger history.
Tax reassessment forecast IN · Partial reset (capped growth)
- Current annual tax
- $496 · $41/mo
- Projected year-2 tax
- $893 · $74/mo
- Expected delta
- +$397/yr (+$33/mo · 80.2%)
ⓘ Screening estimate from a state-policy table — verify with the county assessor before closing.
Climate risk First Street
- Flood 1/10 Low FEMA zone X (unshaded) · 0% chance over 30 yrs
- Wildfire 1/10 Low
- Heat 3/10 Moderate 7 d/yr ≥101°F today · 18 d/yr by 30 yrs out
- Wind 2/10 Low 100% chance of damaging wind over 30 yrs
- Air quality 2/10 Low 1 unhealthy d/yr today · 2 by 30 yrs out
Nearby sold comps map
Loading sold comps map…
Walkable amenities ~0.75 mi
Loading nearby amenities…
Taxation est. · year 1
- Rental income
- $14,509
- − Mortgage interest
- −$8,503
- − Property taxes
- −$496
- − Insurance
- −$759
- − Repairs & maintenance
- −$1,161
- − Management
- −$1,161
- − Depreciation
- −$4,416
- Taxable loss
- −$1,986
- Est. tax savings @ 24.0%
- +$477
- After-tax cash flow
- $1,131/yr
For passive investors: Depreciation is non-cash, so a rental often shows a tax loss while cash-flowing — sheltering income. Rental losses are passive: they offset passive income freely, and up to $25,000/yr can offset ordinary (W-2) income if you actively participate and your MAGI is under $100k (phasing out to $0 by $150k); unused losses carry forward. On sale, claimed depreciation is recaptured at up to 25%, and gains may owe capital-gains tax (a 1031 exchange can defer both). Figures are a year-1 estimate at your 24.0% rate — not tax advice; consult a CPA.
Schools (NCES district)
- District
- South Montgomery Community School Corporation
- NCES district ID
- 1810450
- Math proficiency
- 52% ▼ -3.00%
- Reading proficiency
- 49% ▼ -4.00%
- Median HH income
- $55,952
- Composite
- 43.79/100
- National rank
- #2935
- State rank
- #46 of 301 in IN
Livability — Ladoga
- Score
- 67/100
- State rank
- #244
- US rank
- #10363
Category grades
Schools grade is shown separately in the Schools card above.
Census & demographics
- Census place
- Ladoga, IN
- Population (ZIP)
- 2,223
Population outlook (Montgomery County) Hauer SSP2
- Today (2025)
- 37,893 people
- By 2030
- 37,539 · -0.9%
- By 2040
- 36,536 · -3.6%
- By 2050
- 34,454 · -9.1%
- By 2075
- 28,852 · -23.9%
- By 2100
- 21,145 · -44.2%
Race, ethnicity, and origin ACS 2023
- Neighborhood character
- Predominantly White (95%)
- Race & ethnicity
- White 95% Two or more races 2% Asian 2% Hispanic / Latino 1%
- Common ancestry
- Scottish 5% Romanian 2% Slovak 2%
- Foreign-born
- 1%
- Languages at home
- 99% English-only · Other Asian/Pacific 1%
Political lean MEDSL · Montgomery
- 2024 margin
- Solid R (+48.2) · D 24.9% · R 73.2% · Other 1.9%
- 2008→2024 swing
- -28.3pp toward R · 2008: -19.9pp · 2024: -48.2pp
- All cycles
- 2024: R+48.2 2020: R+49.1 2016: R+50.9 2012: R+38.5 2008: R+19.9
Not yet ingested
- Civics
- —
Market trends
- HPI YoY
- ▲ 11.04%
- Current HPI
- 232.3894
- Rent YoY
- —
- Metro
- —
- State GDP YoY
- ▲ 2.90%
- F500 in state
- 18
Industry mix (Fortune 500 HQ in IN)
| Industry | F500 HQs | Revenue |
|---|---|---|
| Industrial Machinery | 2 | $37B |
|
||
| Healthcare | 1 | $177B |
|
||
| Pharmaceuticals | 1 | $45B |
|
||
| Metals / Steel | 1 | $18B |
|
||
| Agriculture | 1 | $17B |
|
||
| Packaging | 1 | $12B |
|
||
Price history
+19.2% since first listed34 events — show timeline
- 2026-04-30 Pending — MIBOR as Distributed by MLS Grid
- 2026-04-30 Relisted — MIBOR as Distributed by MLS Grid
- 2026-03-04 Pending — MIBOR as Distributed by MLS Grid
- 2025-12-10 Price Changed $143,000 MIBOR as Distributed by MLS Grid
- 2025-10-30 Price Changed $147,400 MIBOR as Distributed by MLS Grid
- 2025-10-06 Price Changed $154,900 MIBOR as Distributed by MLS Grid
- 2025-09-23 Relisted — MIBOR as Distributed by MLS Grid
- 2025-09-23 Price Changed $159,000 MIBOR as Distributed by MLS Grid
- 2025-08-11 Pending — MIBOR as Distributed by MLS Grid
- 2025-07-28 Price Changed $163,500 MIBOR as Distributed by MLS Grid
- 2025-07-18 Price Changed $164,500 MIBOR as Distributed by MLS Grid
- 2025-07-09 Price Changed $165,000 MIBOR as Distributed by MLS Grid
- 2025-06-30 Price Changed $165,400 MIBOR as Distributed by MLS Grid
- 2025-06-09 Price Changed $166,400 MIBOR as Distributed by MLS Grid
- 2025-06-03 Price Changed $167,400 MIBOR as Distributed by MLS Grid
- 2025-05-22 Price Changed $169,000 MIBOR as Distributed by MLS Grid
- 2025-05-05 Listed $179,000 MIBOR as Distributed by MLS Grid
- 2024-09-20 Listing Removed — MIBOR as Distributed by MLS Grid
- 2024-06-13 Price Changed $154,000 MIBOR as Distributed by MLS Grid
- 2024-04-25 Relisted — MIBOR as Distributed by MLS Grid
- 2024-03-16 Pending — MIBOR as Distributed by MLS Grid
- 2024-03-16 Price Changed $158,500 MIBOR as Distributed by MLS Grid
- 2024-03-15 Listed $139,900 MIBOR as Distributed by MLS Grid
- 2023-09-08 Listing Removed — MIBOR as Distributed by MLS Grid
- 2023-06-09 Price Changed $159,900 IRMLS
- 2023-06-02 Price Changed $159,900 MIBOR as Distributed by MLS Grid
- 2023-05-05 Price Changed $164,900 IRMLS
- 2023-04-27 Price Changed $164,900 MIBOR as Distributed by MLS Grid
- 2023-03-15 Listed $170,000 IRMLS
- 2023-02-13 Listed $170,000 MIBOR as Distributed by MLS Grid
- 2018-06-29 Sold (MLS) $111,000 MIBOR as Distributed by MLS Grid
- 2018-05-29 Pending — MIBOR as Distributed by MLS Grid
- 2018-05-21 Price Changed $109,900 MIBOR as Distributed by MLS Grid
- 2018-04-25 Listed $120,000 MIBOR as Distributed by MLS Grid
Property tax history
+23.9%/yrLatest (2025): $496 · +9.5% YoY. Source: county tax records.
Cash-flow waterfall
monthlySold comps — $/sqft
last 12 mo · ≤1 miLoading sold comps…