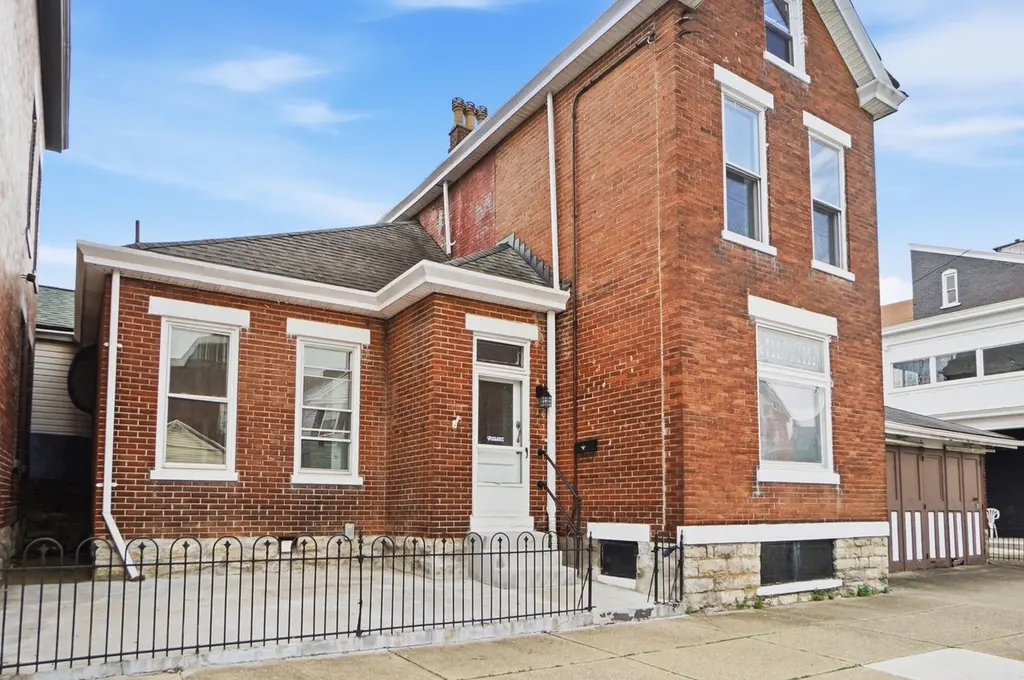
226 W 10th St · Newport, KY
Flood risk 6/10 · Moderate
- FEMA flood zone
- X (unshaded)
- Chance of flooding over 30 yrs
- 0.74%
- Est. flood insurance / yr
- $473 – $860
Fire risk 1/10 · Minimal
- Est. fire insurance / yr
- $839 – $1,559
Heat risk 5/10 · Moderate
- Hot days now (above 103°F)
- 7 days/yr
- Hot days in 30 yrs
- 20 days/yr
Wind risk 2/10 · Minimal
- Chance of severe wind over 30 yrs
- 1.0%
Air-quality risk 3/10 · Minor
- Unhealthy air days now
- 2 days/yr
- Unhealthy air days in 30 yrs
- 3 days/yr
Risk factors via First Street. Map © Google.
Why this score? — see what drove the C- grade
The composite is a weighted blend of 9 inputs, each scored 0–100. Each bar is that input's sub-score; the figure is the points it added to the 100-point composite (weight × sub-score).
- Cash flow +24.3/30.0
- DSCR +7.8/10.0
- ARV discount +5.7/15.0
- 1% rule +5.0/10.0
- Livability +4.1/5.0
- Rent growth +3.7/5.0
- Condition / age +2.5/5.0
- Schools +1.7/10.0
- Appreciation +0.0/10.0
$199,000
🖨 Deal sheet (PDF) 📄 Offer letter ✓ Due diligence
Listing remarks MLS
Charming and Move-in Ready Offering Three Finished Levels of Living Space and Less than a Block from Neighborhood Store! Eat-in Kitchen Features Custom Cabinets. Spacious Living Room with Decorative Fireplace and Stained Glass Window. Sizable Main Level Bedroom and Full Bath. Convenient Main Level Laundry Ready for Stackable Unit. Second Level Offers Sizable Bedrooms and Private Study. Third Level has Multi-purpose Room. Partially Finished Lower Level with Family Room and Abundant Storage. Within Walking Distance of Dining and Shops. Short Drive to Expressway.
Key facts
- Custom cabinets
- Decorative fireplace
- Stained glass window
Tags
Neighborhood map
What this means for you Summary
Snapshot
- This is a 3-bed/1.0-bath single-family listed at $199k.
Deal economics
- At list price, monthly cash flow is $401 ($5k/yr) — positive.
- The deal already cash-flows at list — no discount required.
- Meets the 1% rule at list price ($2k rent vs $199k).
- Recommended offer: $187k (6.0% below list) — sets the bar for market timing.
- Cap rate 8.7% vs local median 4.9% in Newport — top-decile yield for the area; either an underpriced asset or a hidden risk that comps aren't pricing in. Stress-test before assuming the spread holds.
Location & tenants
- Location reads 82/100 on livability (#58 in KY, #1,070 nationally) — a professional / high-income tenant draw. Strengths: amenities A+, commute A+, cost of living A+; Watch: crime F, employment D-.
- Newport Independent (suburban): math 14% / reading 26% proficiency, ranked #160 of 165 in KY (top 97%) — low school quality limits family demand, transient renter base, plan for 1-2y turnover; 79% free/reduced lunch — lower-income household profile, screen leases tightly.
- Zoned schools: Newport Intermediate School (math 12% / reading 22%, grade F, #607 of 676 statewide, top 91%, 387 students, 89% FRL); Newport High School (math 16% / reading 28%, grade F, #202 of 254 statewide, top 82%, 579 students, 84% FRL).
- Market conditions: Rents rising fast (+4.6%/yr); 239 active listings in the ZIP; 29 comparable units currently listed for rent nearby; rentals leasing fast (median 5d on market — plan ~1-2 weeks tenant-placement turnaround); 247 units permitted in Campbell County in 2024 (77 in 5+ unit buildings).
- This rent runs 40% of the median local income ($60k/yr) — at the standard rent-burdened threshold; future hikes will face affordability resistance.
Forward outlook
- Local home prices are declining (-3.0%/yr); year-one equity from $1k of loan paydown is wiped out by about $6k of value loss. Plan a longer hold.
- At projected returns (-3.0% appreciation + 4.6% rent growth), your $56k cash investment doubles in ~10 years — after that, you're playing with house money.
Negotiation context
- It's been on market 62 days — a 6% lower offer ($187k) is reasonable based on typical stale-listing flexibility.
- 4 sale attempts since 2y ago with the ask held roughly flat each time — persistent listings suggest the price (not the market) is what's stuck; bring a comps-based counter.
- Current owner paid $75k; list at $199k implies a 165% gain — meaningful room to come down on a strong offer.
Risks & watch-outs
- Watch-outs: built in 1906 — expect roof / HVAC / electrical / plumbing capex.
- Climate carrying-cost: major flood risk; extreme-heat days projected 7→20/yr by 2055 (HVAC capex compounding) — expect insurance premiums to compound above CPI over the hold.
Questions for the listing agent
- It's been on market 62 days. Have you received any prior offers? Is the seller open to a 6% concession, seller financing, or rate buy-down credit?
- Built in 1906 — when were the roof, HVAC, electrical panel, plumbing, and water heater last replaced?
- Why hasn't it sold? Are there any deal-killer items the seller is aware of (foundation, flood, title, zoning, code violations)?
- Is there a deadline driving the sale (1031 exchange, divorce, estate, relocation)? That informs how much negotiation room exists.
- Schools are D-rated, which usually means shorter tenancies and higher turnover. Who's the typical renter profile here, and what's been the actual vacancy rate?
- Crime grade is F in this area — have there been break-ins, vandalism, or insurance claims at this property in the last 3 years? What carrier currently insures it and at what premium?
- What's the average days-on-market for RENTAL listings here right now (not sales)? A rising rental-DOM trend means longer vacancies and softer asking-rent achievability than the comps imply.
- What's the recent tenant-quality profile in this submarket — average credit score on applications, eviction rate, late-payment / NSF rate, and stable-employment percentage? A property-management company in the area should have these aggregated.
- How much new for-sale + rental construction is in the pipeline within 1–3 miles? Heavy new supply typically softens prices + rents 12–24 months out; constrained supply supports both.
Investment metrics
- 1% rule
- 1.00% ✓
- Cap rate
- 8.71%
- Cash-on-cash
- 8.63%
- DSCR
- 1.38
- GRM
- 8.3
CMA / ARV
- ARV (median comp)
- $191,446
- List price
- $199,000
- Delta
- 3.95%
- Verdict
- FAIR
- Comps
- 20 within 1.0 mi
Show comp detail 12 sales within ~0.75 mi
| Address | Dist | Beds/Ba | Sqft | Sold | Price | $/sf | Match |
|---|---|---|---|---|---|---|---|
| 330 W 9th St W | 0.14mi | 3/1.0 | 1,234 (-2%) | 0mo | $132,500 | $107 | 90 |
| 939 Patterson St | 0.11mi | 3/1.0 | 1,392 (+11%) | 2mo | $127,500 | $92 | 76 |
| 827 Dayton St | 0.41mi | 2/1.0 (-1) | 1,276 (+1%) | 2mo | $234,000 | $183 | 71 |
| 423 Hodge St | 0.17mi | 3/2.5 | 1,164 (-8%) | 3mo | $199,500 | $171 | 71 |
| 335 Keturah St | 0.21mi | 2/1.0 (-1) | 1,361 (+8%) | 3mo | $213,500 | $157 | 69 |
| 517 W 10th St | 0.25mi | 3/1.5 | 1,376 (+9%) | 4mo | $287,000 | $209 | 67 |
| 94 Home St | 0.58mi | 3/1.0 | 1,288 (+2%) | 2mo | $210,000 | $163 | 67 |
| 403 Forrest St | 0.56mi | 3/2.0 | 1,300 (+3%) | 3mo | $297,000 | $228 | 62 |
| 927 Monroe St | 0.65mi | 2/1.0 (-1) | 1,280 (+2%) | 4mo | $234,770 | $183 | 58 |
| 516 W 12th St | 0.32mi | 3/2.0 | 1,434 (+14%) | 2mo | $260,000 | $181 | 56 |
| 7 Parkview Ave | 0.60mi | 2/1.0 (-1) | 1,395 (+11%) | 0mo | $259,900 | $186 | 48 |
| 409 E 13th St | 0.58mi | 2/1.0 (-1) | 1,083 (-14%) | 1mo | $180,000 | $166 | 44 |
Match score weights: distance 35% · size 25% · config 20% · recency 20%. Top-matched comps best support the ARV.
Projected returns pro-forma
-3.0% appreciation · 4.64% rent growth · sell at horizon
- IRR
- -1.6%
- Equity multiple
- 0.94×
- Total profit
- $-3,476
- Equity at exit
- $29,672
- IRR
- 9.5%
- Equity multiple
- 1.78×
- Total profit
- $43,634
- Equity at exit
- $17,206
Cash invested: $55,720 (down + closing). Projections, not guarantees.
Landlord ↔ Tenant lean methodology
- Overall (STATE)
- 83 Strongly Landlord-Friendly
- State Kentucky
- 83 Strongly Landlord-Friendly · R+16
- County
- — inherits STATE
- City
- — inherits STATE
ZIP-level market 41071
- Rents YoY
- 4.6%
- Active inventory
- 239
- Price-to-rent
- 8.3×
Monthly cashflow live
- Estimated rent
- $1,992 high interval (Pro) →
- Mortgage (P&I)
- −$1,044
- Tax from tax record
- −$47 /mo · $562/yr
- Insurance
- −$83
- HOA
- −$0
- Vacancy / Maint / Mgmt
- −$418
- Net cashflow
- $401
Break-even live
Sensitivity live
| Price | -10% $513 | -5% $457 | +0% $401 | +5% $344 | +10% $288 |
|---|---|---|---|---|---|
| Rent | -10% $243 | -5% $322 | +0% $401 | +5% $479 | +10% $558 |
| Rate | -1.0pp $501 | -0.5pp $451 | base $401 | +0.5pp $349 | +1.0pp $297 |
UW: 25.0% down · 7.5% · 30yr · 1.5% tax · 5.0% vac · 8.0% maint · 8.0% mgmt
Financing live
Cash to close
- Down payment
- $49,750
- Closing costs
- $5,970
- Reserves months
- —
- Total cash needed
- —
Loan-product check · same deal, 3 products live
Conventional
25% down · 7.5% · 30yr
- Down + closing
- —
- Monthly P&I
- —
- Monthly cashflow
- —
- DSCR
- —
- Eligible?
- —
Personal DTI + credit; lowest rate.
DSCR
20% down · 8.5% · 30yr
- Down + closing
- —
- Monthly P&I
- —
- Monthly cashflow
- —
- DSCR
- —
- Eligible?
- —
No personal income docs; deal must DSCR.
Hard money
10% down · 12.0% · 12mo
- Down + closing
- —
- Monthly P&I
- —
- Monthly cashflow
- —
- DSCR
- —
- Eligible?
- —
Short-term bridge; refi at stabilization.
Rent comps 29 comps
| Address | Beds | Baths | Sqft | Rent | $/sqft | DOM | Units | Dist |
|---|---|---|---|---|---|---|---|---|
| 128 W 9th St Newport, KY | 2.0 | 1.0 | 1012 | $1,650 | $1.63 | 3d | 1 | 0.15mi |
| 809 Isabella St Newport, KY | 2.0 | 2.0 | 1519 | $2,200 | $1.45 | 45d | 1 | 0.21mi |
| 911 Putnam St #2 Newport, KY | 2.0 | 1.0 | 1000 | $1,600 | $1.60 | 23d | 1 | 0.22mi |
| 203 W 8th St Newport, KY | 2.0 | 1.5 | 1456 | $2,300 | $1.58 | 23d | 1 | 0.24mi |
| 210 W 5th St Newport, KY | 1.0–2.0 | 1.0–2.0 | 845 | $1,800 | $2.13 | 4d | 15 | 0.47mi |
| 1044 Washington Ave #2 Newport, KY | 2.0 | 2.0 | 1250 | $1,800 | $1.44 | 45d | 1 | 0.50mi |
| 814 Washington Ave Unit 2 Newport, KY | 2.0 | 2.0 | 1450 | $1,500 | $1.03 | 25d | 1 | 0.53mi |
| 344 E 13th St Unit 1 Covington, KY | 2.0 | 1.0 | 1000 | $1,275 | $1.27 | 25d | 1 | 0.60mi |
| 929 Boone St Newport, KY | 2.0 | 2.0 | 1458 | $1,495 | $1.03 | 45d | 1 | 0.60mi |
| 508 Greenup St Unit 508-02 Covington, KY | 2.0 | 1.0 | 1220 | $1,800 | $1.48 | 3d | 1 | 0.72mi |
| 1025 Scott St Unit 2 Covington, KY | 2.0 | 2.0 | 1100 | $1,800 | $1.64 | 4d | 1 | 0.79mi |
| 100 Aqua Way Newport, KY | 1.0–3.0 | 1.0–2.0 | 1092 | $3,850 | $3.53 | 3d | 4 | 0.82mi |
| 103 E 3rd St Covington, KY | 2.0 | 2.5 | 1291 | $3,250 | $2.52 | 3d | 1 | 0.88mi |
| 50 W Rivercenter Blvd Covington, KY | 1.0–2.0 | 1.0–2.5 | 1273 | $3,640 | $2.86 | 3d | 9 | 1.07mi |
| 118 Beech St Newport, KY | 3.0 | 2.0 | 1610 | $2,400 | $1.49 | 3d | 1 | 1.09mi |
| 621 E Mehring Way Cincinnati, OH | 1.0–2.0 | 1.0–2.0 | 938 | $2,249 | $2.40 | 3d | 12 | 1.16mi |
| 601 E Pete Rose Way Cincinnati, OH | 3.0 | 1.0–2.5 | 1039 | $2,936 | $2.83 | 3d | 22 | 1.18mi |
| 121 E Freedom Way Cincinnati, OH | 2.0 | 1.0–2.0 | 988 | $2,999 | $3.03 | 3d | 27 | 1.24mi |
| 1205 Lee St Unit 3 Covington, KY | 3.0 | 2.5 | 1850 | $3,000 | $1.62 | 25d | 1 | 1.26mi |
| 2030 Mackoy St Covington, KY | 3.0 | 1.5 | 1598 | $1,779 | $1.11 | 6d | 1 | 1.28mi |
| 1927 Scott St Apt 1 Covington, KY | 3.0 | 2.0 | 1865 | $2,100 | $1.13 | 21d | 1 | 1.28mi |
| 512 Wallace Ave Unit 512/18 Covington, KY | 2.0 | 2.0 | 900 | $1,299 | $1.44 | 9d | 1 | 1.28mi |
| 515 Main St Covington, KY | 1.0–2.0 | 1.0–2.0 | 934 | $2,215 | $2.37 | 3d | 8 | 1.29mi |
| 44 W Freedom Way Cincinnati, OH | 2.0 | 1.0–2.0 | 943 | $2,859 | $3.03 | 3d | 28 | 1.36mi |
| 239 Grandview Ave Bellevue, KY | 2.0 | 2.0 | 1093 | $1,645 | $1.50 | 6d | 2 | 1.37mi |
| 3949 Vision CIR Southgate, KY | 1.0–2.0 | 1.0–2.0 | 1132 | $2,515 | $2.22 | 3d | 10 | 1.41mi |
| 309 Vine St Cincinnati, OH | 1.0–3.0 | 1.0–2.0 | 955 | $3,334 | $3.49 | 3d | 15 | 1.45mi |
| 327 Covert Run Pike Unit 1 Bellevue, KY | 2.0 | 2.0 | 1580 | $1,850 | $1.17 | 25d | 1 | 1.48mi |
| 1 W 4th St Cincinnati, OH | 3.0 | 1.0–3.5 | 1675 | $9,200 | $5.49 | 4d | 96 | 1.49mi |
Listing history 23 events
-
2026-06-21days on market $199,000 Active 62 DOM
-
2026-06-18days on market $199,000 Active 59 DOM
-
2026-06-17days on market $199,000 Active 58 DOM
-
2026-06-16days on market $199,000 Active 57 DOM
-
2026-06-15days on market $199,000 Active 56 DOM
-
2026-06-13days on market $199,000 Active 54 DOM
-
2026-06-09days on market $199,000 Active 50 DOM
-
2026-06-08days on market $199,000 Active 49 DOM
-
2026-06-07days on market $199,000 Active 48 DOM
-
2026-06-05days on market $199,000 Active 45 DOM
-
2026-06-03days on market $199,000 Active 44 DOM
-
2026-06-02days on market $199,000 Active 43 DOM
-
2026-06-01days on market $199,000 Active 42 DOM
-
2026-05-31days on market $199,000 Active 41 DOM
-
2026-05-08status Active 575-char remark
Show marketing remark (575 chars)
Charming and Move-in Ready Offering Three Finished Levels of Living Space and Less than a Block from Neighborhood Store! Eat-in Kitchen Features Custom Cabinets. Spacious Living Room with Decorative Fireplace and Stained Glass Window. Sizable Main Level Bedroom and Full Bath. Convenient Main Level Laundry Ready for Stackable Unit. Second Level Offers Sizable Bedrooms and Private Study. Third Level has Multi-purpose Room. Partially Finished Lower Level with Family Room and Abundant Storage. Within Walking Distance of Dining and Shops. Short Drive to Expressway.
-
2026-04-26status Pending 575-char remark
Show marketing remark (575 chars)
Charming and Move-in Ready Offering Three Finished Levels of Living Space and Less than a Block from Neighborhood Store! Eat-in Kitchen Features Custom Cabinets. Spacious Living Room with Decorative Fireplace and Stained Glass Window. Sizable Main Level Bedroom and Full Bath. Convenient Main Level Laundry Ready for Stackable Unit. Second Level Offers Sizable Bedrooms and Private Study. Third Level has Multi-purpose Room. Partially Finished Lower Level with Family Room and Abundant Storage. Within Walking Distance of Dining and Shops. Short Drive to Expressway.
-
2026-04-08$199,000 Active 575-char remark
Show marketing remark (575 chars)
Charming and Move-in Ready Offering Three Finished Levels of Living Space and Less than a Block from Neighborhood Store! Eat-in Kitchen Features Custom Cabinets. Spacious Living Room with Decorative Fireplace and Stained Glass Window. Sizable Main Level Bedroom and Full Bath. Convenient Main Level Laundry Ready for Stackable Unit. Second Level Offers Sizable Bedrooms and Private Study. Third Level has Multi-purpose Room. Partially Finished Lower Level with Family Room and Abundant Storage. Within Walking Distance of Dining and Shops. Short Drive to Expressway.
-
2026-02-06historical
-
2025-09-11$250,000 Active
-
2024-10-16historical
-
2024-07-31price $229,000
-
2024-07-16$245,000 Active
-
2023-01-24soldstatus $75,000
ⓘ Source: listings_history table (triggers on properties + properties_extension) + one-shot
backfill from property_details.listing_events for pre-trigger history.
Tax reassessment forecast KY · Resets to sale price
- Current annual tax
- $562 · $47/mo
- Projected year-2 tax
- $1,711 · $143/mo
- Expected delta
- +$1,150/yr (+$96/mo · 204.6%)
ⓘ Screening estimate from a state-policy table — verify with the county assessor before closing.
Climate risk First Street
- Flood 6/10 Major FEMA zone X (unshaded) · 74% chance over 30 yrs
- Wildfire 1/10 Low
- Heat 5/10 Major 7 d/yr ≥103°F today · 20 d/yr by 30 yrs out
- Wind 2/10 Low 100% chance of damaging wind over 30 yrs
- Air quality 3/10 Moderate 2 unhealthy d/yr today · 3 by 30 yrs out
Nearby sold comps map
Loading sold comps map…
Walkable amenities ~0.75 mi
Loading nearby amenities…
Taxation est. · year 1
- Rental income
- $23,910
- − Mortgage interest
- −$11,147
- − Property taxes
- −$562
- − Insurance
- −$995
- − Repairs & maintenance
- −$1,913
- − Management
- −$1,913
- − Depreciation
- −$5,789
- Taxable income
- $1,591
- Est. tax owed @ 24.0%
- −$382
- After-tax cash flow
- $4,427/yr
For passive investors: Depreciation is non-cash, so a rental often shows a tax loss while cash-flowing — sheltering income. Rental losses are passive: they offset passive income freely, and up to $25,000/yr can offset ordinary (W-2) income if you actively participate and your MAGI is under $100k (phasing out to $0 by $150k); unused losses carry forward. On sale, claimed depreciation is recaptured at up to 25%, and gains may owe capital-gains tax (a 1031 exchange can defer both). Figures are a year-1 estimate at your 24.0% rate — not tax advice; consult a CPA.
Schools (NCES district)
- District
- Newport Independent
- NCES district ID
- 2104440
- Math proficiency
- 14% ▼ -11.00%
- Reading proficiency
- 26% ▼ -6.00%
- Median HH income
- $35,783
- Composite
- 16.51/100
- National rank
- #9182
- State rank
- #160 of 165 in KY
Livability — Newport
- Score
- 82/100
- State rank
- #58
- US rank
- #1070
Category grades
Schools grade is shown separately in the Schools card above.
Census & demographics
- Census place
- Newport, KY
- County
- Campbell County · 84,793 people
- City population
- 19,680
- Metro
- Cincinnati, OH-KY-IN
- Population (ZIP)
- 19,680
- Household income
- $59,976
- Rent vs Own
- Severe rent burden
- 1136.0
Population outlook (Campbell County) Hauer SSP2
- Today (2025)
- 95,668 people
- By 2030
- 96,886 · +1.3%
- By 2040
- 97,734 · +2.2%
- By 2050
- 96,413 · +0.8%
- By 2075
- 90,211 · -5.7%
- By 2100
- 79,434 · -17.0%
Race, ethnicity, and origin ACS 2023
- Neighborhood character
- Predominantly White (84%)
- Race & ethnicity
- White 84% Black 7% Two or more races 6% Hispanic / Latino 5%
- Common ancestry
- Slovak 3% Lithuanian 2% Italian 2%
- Foreign-born
- 4% · Canada
- Languages at home
- 95% English-only · Spanish 3% Other Indo-European 1%
Political lean MEDSL · Campbell
- 2024 margin
- R (+19.7) · D 39.2% · R 58.9% · Other 1.9%
- 2008→2024 swing
- +1.2pp toward D · 2008: -20.9pp · 2024: -19.7pp
- All cycles
- 2024: R+19.7 2020: R+18.6 2016: R+24.5 2012: R+22.8 2008: R+20.9
Not yet ingested
- Civics
- —
Market trends
- HPI YoY
- ▼ -193.38%
- Current HPI
- 244.9069
- Rent YoY
- ▲ 4.64%
- Metro
- Cincinnati, OH-KY-IN
- State GDP YoY
- ▲ 1.81%
- F500 in state
- 4
Industry mix (Fortune 500 HQ in KY)
| Industry | F500 HQs | Revenue |
|---|---|---|
| Healthcare | 1 | $118B |
|
||
| Food / Beverage | 1 | $7B |
|
||
Price history
+165.3% since first listed9 events — show timeline
- 2026-05-08 Relisted — NKMLS
- 2026-04-26 Pending — NKMLS
- 2026-04-08 Listed $199,000 NKMLS
- 2026-02-06 Listing Removed — NKMLS
- 2025-09-11 Listed $250,000 NKMLS
- 2024-10-16 Listing Removed — NKMLS
- 2024-07-31 Price Changed $229,000 NKMLS
- 2024-07-16 Listed $245,000 NKMLS
- 2023-01-24 Sold (Public Records) $75,000 Public Records
Property tax history
+12.9%/yrLatest (2025): $562 · -3.7% YoY. Source: county tax records.
Cash-flow waterfall
monthlySold comps — $/sqft
last 12 mo · ≤1 miLoading sold comps…