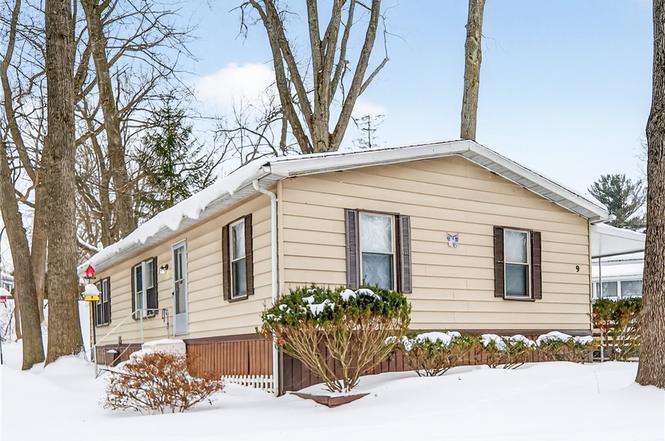
9 Oakside Dr · St. John Fisher College, NY
Flood risk 1/10 · Minimal
- FEMA flood zone
- X (unshaded)
- Chance of flooding over 30 yrs
- 0.0%
- Est. flood insurance / yr
- $507 – $1,088
Fire risk 1/10 · Minimal
- Est. fire insurance / yr
- $691 – $1,283
Heat risk 2/10 · Minimal
- Hot days now (above 95°F)
- 7 days/yr
- Hot days in 30 yrs
- 15 days/yr
Wind risk 1/10 · Minimal
- Chance of severe wind over 30 yrs
- —
Air-quality risk 2/10 · Minimal
- Unhealthy air days now
- 1 days/yr
- Unhealthy air days in 30 yrs
- 2 days/yr
Risk factors via First Street. Map © Google.
Why this score? — see what drove the B- grade
The composite is a weighted blend of 9 inputs, each scored 0–100. Each bar is that input's sub-score; the figure is the points it added to the 100-point composite (weight × sub-score).
- Cash flow +30.0/30.0
- 1% rule +10.0/10.0
- DSCR +10.0/10.0
- Schools +6.8/10.0
- Rent growth +2.5/5.0
- Livability +2.5/5.0
- ARV discount +2.4/15.0
- Condition / age +2.2/5.0
- Appreciation +0.0/10.0
$79,900
🖨 Deal sheet (PDF) 📄 Offer letter ✓ Due diligence
Listing remarks
Step into refined luxury in this fully redesigned ranch home offering three spacious bedrooms and two beautifully appointed full bathrooms, thoughtfully updated to combine timeless style with everyday functionality. The heart of the home is the stunning new kitchen, featuring custom cabinetry, sleek stainless steel appliances, a ceramic tile backsplash, and a rich, custom-stained butcher block countertop—perfect for both cooking and entertaining. Both bathrooms have been completely remodeled and showcase designer-tiled showers, custom vanities, and high-end fixtures, creating spa-like retreats. Throughout the home, you’ll find durable life-proof laminate flooring, plush new carp
Key facts
- Custom cabinetry
- New kitchen
- Parking
Tags
Neighborhood map
What this means for you Summary
Snapshot
- This is a 3-bed/2.0-bath manufactured listed at $80k. Condition is rated fair.
Deal economics
- At list price, monthly cash flow is $1k ($14k/yr) — positive.
- The deal already cash-flows at list — no discount required.
- Meets the 1% rule at list price ($2k rent vs $80k).
- Cap rate 24.0% vs local median 16.6% in St. John Fisher College — top-decile yield for the area; either an underpriced asset or a hidden risk that comps aren't pricing in. Stress-test before assuming the spread holds.
Location & tenants
- Location reads: area grade B — affects rentability + tenant quality, not the cash-flow math above.
- Penfield Central School District (suburban): math 77% / reading 79% proficiency, ranked #67 of 590 in NY (top 11%) — strong family-tenant draw, lease renewals of 3-5y typical; only 11% free/reduced lunch — higher-income household profile.
- Zoned schools: Indian Landing Elementary School (math 72% / reading 72%, grade A-, #378 of 2,108 statewide, top 20%, 542 students, 22% FRL); Bay Trail Middle School (math 59% / reading 78%, grade A, #94 of 729 statewide, top 13%, 1,113 students, 23% FRL); Penfield Senior High School (math 98% / reading 72%, grade A, #369 of 1,100 statewide, top 34%, 1,424 students, 25% FRL).
- Market conditions: 63 active listings in the ZIP; 8 comparable units currently listed for rent nearby; rentals leasing fast (median 5d on market — plan ~1-2 weeks tenant-placement turnaround); 1,169 units permitted in Monroe County in 2024 (591 in 5+ unit buildings).
Forward outlook
- Local home prices are declining (-3.0%/yr); year-one equity from $552 of loan paydown is wiped out by about $2k of value loss. Plan a longer hold.
- Monroe County population projected to shrink 6% by 2050 — rents likely to lag national; underwrite the cash flow, not the appreciation.
- At projected returns (-3.0% appreciation + 3.0% rent growth), your $22k cash investment doubles in ~2 years — after that, you're playing with house money.
Negotiation context
- Only 11 days on market — expect competitive offers; lowballing is unlikely to land.
Questions for the listing agent
- Have any recent inspections been done? Can we get a copy of the seller's disclosures and any deferred-maintenance estimates?
- Is there a deadline driving the sale (1031 exchange, divorce, estate, relocation)? That informs how much negotiation room exists.
- What's the average days-on-market for RENTAL listings here right now (not sales)? A rising rental-DOM trend means longer vacancies and softer asking-rent achievability than the comps imply.
- What's the recent tenant-quality profile in this submarket — average credit score on applications, eviction rate, late-payment / NSF rate, and stable-employment percentage? A property-management company in the area should have these aggregated.
- How much new for-sale + rental construction is in the pipeline within 1–3 miles? Heavy new supply typically softens prices + rents 12–24 months out; constrained supply supports both.
Investment metrics
- 1% rule
- 2.74% ✓
- Cap rate
- 23.99%
- Cash-on-cash
- 63.19%
- DSCR
- 3.81
- GRM
- 3.0
CMA / ARV
- ARV (on-the-fly)
- $71,808
- Comps found
- 12
Show comp detail 12 sales within ~0.75 mi
| Address | Dist | Beds/Ba | Sqft | Sold | Price | $/sf | Match |
|---|---|---|---|---|---|---|---|
| 9 Oakside Dr | 0.00mi | 3/2.0 | 1,056 (0%) | 2mo | $72,000 | $68 | 98 |
| 25 Patio Dr | 0.04mi | 3/2.0 | 960 (-9%) | 6mo | $72,500 | $76 | 78 |
| 27 Glazer Dr | 0.22mi | 2/2.0 (-1) | 1,100 (+4%) | 9mo | $65,000 | $59 | 70 |
| 26 Fondiller Ave | 0.10mi | 3/2.0 | 1,200 (+14%) | 5mo | $71,000 | $59 | 68 |
| 8 Harway Dr | 0.21mi | 3/2.0 | 1,173 (+11%) | 7mo | $73,500 | $63 | 66 |
| 2 Beatrice | 0.31mi | 3/2.0 | 1,143 (+8%) | 9mo | $90,000 | $79 | 64 |
| 26 Ewald Dr | 0.26mi | 2/1.0 (-1) | 960 (-9%) | 3mo | $113,777 | $119 | 61 |
| 36 Wayside Dr | 0.23mi | 2/1.5 (-1) | 924 (-12%) | 2mo | $54,900 | $59 | 60 |
| 2 Easy St | 0.42mi | 2/1.0 (-1) | 980 (-7%) | 3mo | $40,000 | $41 | 57 |
| 11 Bittersweet Dr | 0.44mi | 3/2.0 | 1,150 (+9%) | 11mo | $77,000 | $67 | 56 |
| 27 Ewald Dr | 0.29mi | 2/2.0 (-1) | 907 (-14%) | 8mo | $90,000 | $99 | 51 |
| 25 Ewald Dr | 0.29mi | 2/2.0 (-1) | 907 (-14%) | 9mo | $88,000 | $97 | 50 |
Match score weights: distance 35% · size 25% · config 20% · recency 20%. Top-matched comps best support the ARV.
Projected returns pro-forma
-3.0% appreciation · 3.0% rent growth · sell at horizon
- IRR
- 62.2%
- Equity multiple
- 3.78×
- Total profit
- $62,123
- Equity at exit
- $11,913
- IRR
- 66.8%
- Equity multiple
- 7.74×
- Total profit
- $150,853
- Equity at exit
- $6,908
Cash invested: $22,372 (down + closing). Projections, not guarantees.
Landlord ↔ Tenant lean methodology
- Overall (STATE)
- 15 Strongly Tenant-Friendly
- State New York
- 15 Strongly Tenant-Friendly · D+10
- County
- — inherits STATE
- City
- — inherits STATE
ZIP-level market 14625
- Home prices YoY
- -15.3%
- Active inventory
- 63
- Price-to-rent
- 3.0×
Monthly cashflow live
- Estimated rent
- $2,190 high interval (Pro) →
- Mortgage (P&I)
- −$419
- Tax est. 1.5%
- −$100 /mo · $1,198/yr
- Insurance
- −$33
- HOA
- −$0
- Vacancy / Maint / Mgmt
- −$460
- Net cashflow
- $1,178
Break-even live
Sensitivity live
| Price | -10% $1,233 | -5% $1,206 | +0% $1,178 | +5% $1,151 | +10% $1,123 |
|---|---|---|---|---|---|
| Rent | -10% $1,005 | -5% $1,092 | +0% $1,178 | +5% $1,265 | +10% $1,351 |
| Rate | -1.0pp $1,218 | -0.5pp $1,198 | base $1,178 | +0.5pp $1,157 | +1.0pp $1,136 |
UW: 25.0% down · 7.5% · 30yr · 1.5% tax · 5.0% vac · 8.0% maint · 8.0% mgmt
Financing live
Cash to close
- Down payment
- $19,975
- Closing costs
- $2,397
- Reserves months
- —
- Total cash needed
- —
Loan-product check · same deal, 3 products live
Conventional
25% down · 7.5% · 30yr
- Down + closing
- —
- Monthly P&I
- —
- Monthly cashflow
- —
- DSCR
- —
- Eligible?
- —
Personal DTI + credit; lowest rate.
DSCR
20% down · 8.5% · 30yr
- Down + closing
- —
- Monthly P&I
- —
- Monthly cashflow
- —
- DSCR
- —
- Eligible?
- —
No personal income docs; deal must DSCR.
Hard money
10% down · 12.0% · 12mo
- Down + closing
- —
- Monthly P&I
- —
- Monthly cashflow
- —
- DSCR
- —
- Eligible?
- —
Short-term bridge; refi at stabilization.
Rent comps 8 comps
| Address | Beds | Baths | Sqft | Rent | $/sqft | DOM | Units | Dist |
|---|---|---|---|---|---|---|---|---|
| 3540 East Ave Rochester, NY | 1.0–2.0 | 1.0–2.5 | 1261 | $4,123 | $3.27 | 4d | 10 | 0.74mi |
| 278 Penn Ln Rochester, NY | 2.0 | 2.0 | 1184 | $2,100 | $1.77 | 4d | 1 | 0.84mi |
| 18 Brook Hill Ln Rochester, NY | 1.0–2.0 | 1.0–1.5 | 841 | $1,915 | $2.28 | 4d | 1 | 0.88mi |
| 214 Magnolia Ave East Rochester, NY | 3.0 | 1.0 | 1200 | $1,600 | $1.33 | 25d | 1 | 1.29mi |
| 218 1/2 Magnolia Ave East Rochester, NY | 3.0 | 1.5 | 1200 | $1,400 | $1.17 | 45d | 1 | 1.30mi |
| 126 West Ave Unit UPPER East Rochester, NY | 2.0 | 1.0 | 820 | $1,500 | $1.83 | 20d | 1 | 1.43mi |
| 120 Brebeuf Dr Penfield, NY | 2.0 | 1.0 | 763 | $1,365 | $1.79 | 4d | 6 | 1.45mi |
| 405 Garfield Ave East Rochester, NY | 3.0 | 1.0 | 1228 | $2,000 | $1.63 | 4d | 1 | 1.49mi |
Listing history 2 events
-
2026-03-08status Pending
-
2026-02-25$79,900 Active
ⓘ Source: listings_history table (triggers on properties + properties_extension) + one-shot
backfill from property_details.listing_events for pre-trigger history.
Climate risk First Street
- Flood 1/10 Low FEMA zone X (unshaded) · 0% chance over 30 yrs
- Wildfire 1/10 Low
- Heat 2/10 Low 7 d/yr ≥95°F today · 15 d/yr by 30 yrs out
- Wind 1/10 Low
- Air quality 2/10 Low 1 unhealthy d/yr today · 2 by 30 yrs out
Nearby sold comps map
Loading sold comps map…
Walkable amenities ~0.75 mi
Loading nearby amenities…
Taxation est. · year 1
- Rental income
- $26,283
- − Mortgage interest
- −$4,476
- − Property taxes
- −$1,198
- − Insurance
- −$400
- − Repairs & maintenance
- −$2,103
- − Management
- −$2,103
- − Depreciation
- −$2,324
- Taxable income
- $13,680
- Est. tax owed @ 24.0%
- −$3,283
- After-tax cash flow
- $10,855/yr
For passive investors: Depreciation is non-cash, so a rental often shows a tax loss while cash-flowing — sheltering income. Rental losses are passive: they offset passive income freely, and up to $25,000/yr can offset ordinary (W-2) income if you actively participate and your MAGI is under $100k (phasing out to $0 by $150k); unused losses carry forward. On sale, claimed depreciation is recaptured at up to 25%, and gains may owe capital-gains tax (a 1031 exchange can defer both). Figures are a year-1 estimate at your 24.0% rate — not tax advice; consult a CPA.
Condition & rehab AI · 2 photos
This fully redesigned ranch home offers three spacious bedrooms and two beautifully appointed bathrooms. The home is in fair condition with some minor repairs needed, such as painting the exterior siding and improving landscaping. The kitchen and bathrooms are in good condition, and the home is move-in ready with a good resale and rental value.
Repairs flagged
- Minor Exterior siding — Light discoloration on the siding.
- Minor Landscaping — Some snow and bare bushes present, indicating winter conditions.
Value-add opportunities
- Resale Paint exterior siding — Fresh paint can enhance curb appeal and home value.
- Rental Landscaping improvements — Well-maintained landscaping can attract tenants and increase rental value.
- Both HVAC maintenance — Regular HVAC maintenance ensures comfort and energy efficiency, benefiting both resale and rental value.
Renovation cost estimate screening
| Repair item | Severity | Est. cost |
|---|---|---|
| Exterior siding · Light discoloration on the siding. | Minor | $500–3,000 |
| Landscaping · Some snow and bare bushes present, indicating winter conditions. | Minor | $500–3,000 |
| Total estimated repair cost · 2 items | $1,000–6,000 |
Value-add ROI direction
- Resale Paint exterior siding — Fresh paint can enhance curb appeal and home value. ↑
- Rental Landscaping improvements — Well-maintained landscaping can attract tenants and increase rental value. ↑
- Both HVAC maintenance — Regular HVAC maintenance ensures comfort and energy efficiency, benefiting both resale and rental value. ↑
ⓘ Cost ranges are severity-bucket heuristics (US national rule-of-thumb). Get contractor quotes + a written scope before underwriting a rehab budget.
Schools (NCES district)
- District
- Penfield Central School District
- NCES district ID
- 3622710
- Math proficiency
- 77% ▼ -3.00%
- Reading proficiency
- 79% ▲ 10.00%
- Median HH income
- $74,802
- Composite
- 68.37/100
- National rank
- #347
- State rank
- #67 of 590 in NY
Livability — St. John Fisher College
No livability data for this city. (Only ~50 U.S. cities are tracked.)
Census & demographics
- Population (ZIP)
- 10,667
Population outlook (Monroe County) Hauer SSP2
- Today (2025)
- 759,460 people
- By 2030
- 757,154 · -0.3%
- By 2040
- 740,644 · -2.5%
- By 2050
- 714,443 · -5.9%
- By 2075
- 645,883 · -15.0%
- By 2100
- 547,084 · -28.0%
Race, ethnicity, and origin ACS 2023
- Neighborhood character
- Predominantly White (85%)
- Race & ethnicity
- White 85% Two or more races 10% Hispanic / Latino 6% Black 1% Asian 1%
- Hispanic origin (detail)
- Puerto Rican 1% Dominican 1%
- Common ancestry
- Romanian 7% Subsaharan African 3% Iranian 2%
- Foreign-born
- 7% · Canada, China
- Languages at home
- 92% English-only · Russian/Polish/Slavic 3% Spanish 2% Other Indo-European 2%
Political lean MEDSL · Monroe
- 2024 margin
- D (+19.1) · D 59.5% · R 40.5%
- 2008→2024 swing
- +1.4pp toward D · 2008: 17.7pp · 2024: 19.1pp
- All cycles
- 2024: D+19.1 2020: D+21.0 2016: D+14.1 2012: D+17.4 2008: D+17.7
Not yet ingested
- Civics
- —
Market trends
- HPI YoY
- ▼ -49.69%
- Current HPI
- 275.9721
- Rent YoY
- —
- Metro
- —
- State GDP YoY
- ▲ 2.60%
- F500 in state
- 92
Industry mix (Fortune 500 HQ in NY)
| Industry | F500 HQs | Revenue |
|---|---|---|
| Financial Services | 10 | $950B |
|
||
| Consumer Goods | 9 | $162B |
|
||
| Insurance | 4 | $225B |
|
||
| Telecommunications | 2 | $144B |
|
||
| Pharmaceuticals | 2 | $112B |
|
||
| Media / Entertainment | 2 | $69B |
|
||
Price history
2 events — show timeline
- 2026-03-08 Pending — UNYREIS
- 2026-02-25 Listed $79,900 UNYREIS
Cash-flow waterfall
monthlySold comps — $/sqft
last 12 mo · ≤1 miLoading sold comps…