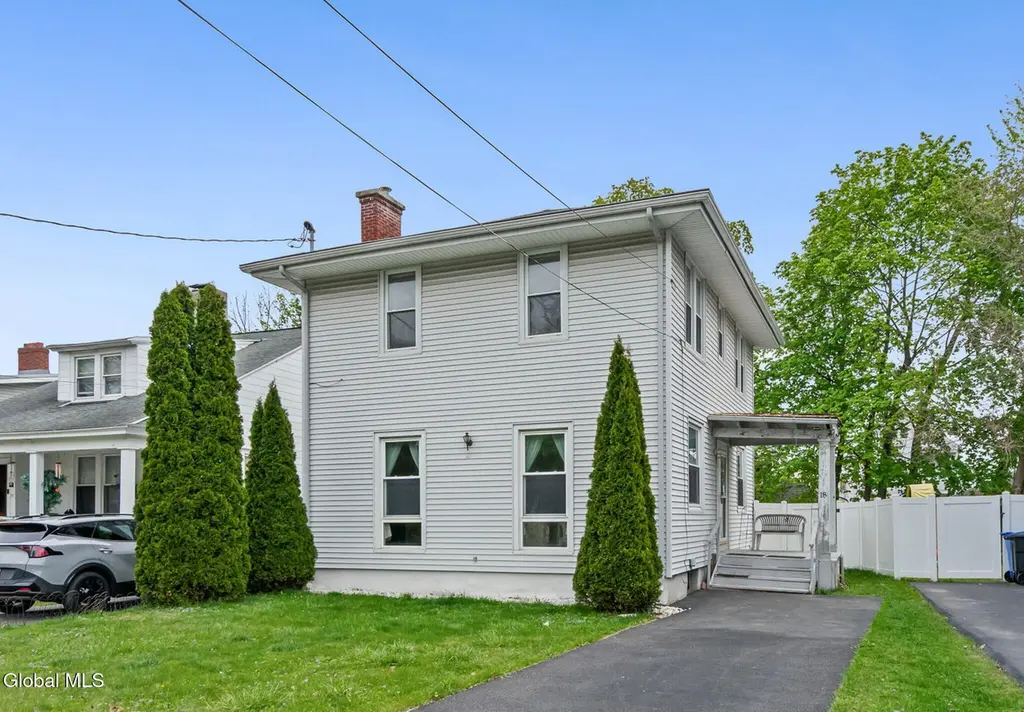
18 Oakwood St · Albany, NY
Flood risk 1/10 · Minimal
- FEMA flood zone
- X (unshaded)
- Chance of flooding over 30 yrs
- 0.0%
- Est. flood insurance / yr
- $473 – $860
Fire risk 2/10 · Minimal
- Est. fire insurance / yr
- $691 – $1,283
Heat risk 4/10 · Minor
- Hot days now (above 97°F)
- 7 days/yr
- Hot days in 30 yrs
- 16 days/yr
Wind risk 3/10 · Minor
- Chance of severe wind over 30 yrs
- 6.0%
Air-quality risk 1/10 · Minimal
- Unhealthy air days now
- 0 days/yr
- Unhealthy air days in 30 yrs
- 0 days/yr
Risk factors via First Street. Map © Google.
Why this score? — see what drove the D grade
The composite is a weighted blend of 9 inputs, each scored 0–100. Each bar is that input's sub-score; the figure is the points it added to the 100-point composite (weight × sub-score).
- ARV discount +15.0/15.0
- Cash flow +8.2/30.0
- Livability +4.0/5.0
- Rent growth +3.8/5.0
- Schools +3.2/10.0
- 1% rule +3.1/10.0
- Condition / age +2.5/5.0
- DSCR +2.2/10.0
- Appreciation +0.0/10.0
$275,000
🖨 Deal sheet (PDF) 📄 Offer letter ✓ Due diligence
Listing remarks MLS
NO SHOWINGS TILL 2/16/04. DON'T LET CATS OUT. TAXES DON'T REFLECT STAR PROGRAM. COMPLETELY REHABED 3 YRS AGO: ROOF, SIDING, ELECTRIC, FURNACE, HW TANK, HARDWOOD FLOORS UP & DOWN. FL IN ATTIC. 24 HOUR NOTICE. Excellent Condition
Key facts
- 5,227 sq ft lot
- 2 parking spots
- Built 1927
Property features AI
Exterior
- Parking: Two off-street paved driveway parking spaces
- Utilities: 150 amp electric service; Public water; Public sewer
- Home design: Single-family residence; Entry level: First and second stories
- Construction: Vinyl siding; Shingle/asphalt roof
- Exterior features: Rear enclosed porch and side porch; Paved driveway; Vinyl fencing enclosing the backyard; Shed(s); Landscaped, level, private lot
Interior
- Kitchen: Range; Refrigerator
- Bedrooms: Three bedrooms on the second level
- Flooring: Vinyl flooring; Hardwood flooring
- Bathrooms: One full bathroom (located on the second level)
- Heating & cooling: Hot water heating (natural gas); Ductless cooling
- Interior features: Paddle fan; Double-pane windows with screens; Full, unfinished basement
- Laundry & utility: Washer and dryer; Laundry in basement
Neighborhood map
What this means for you Summary
Snapshot
- This is a 3-bed/1.0-bath single-family listed at $275k.
Deal economics
- At list price, monthly cash flow is $-259 ($-3k/yr) — negative.
- To cash-flow at today's rent, offer at most $229k (16.6% below list).
- To meet the 1% rule (rent ≥ 1% of price), the offer needs to be $221k (19.5% below list).
- Recommended offer: $221k (19.5% below list) — sets the bar for 1% rule.
Location & tenants
- Location reads 79/100 on livability (#129 in NY, #2,083 nationally) — a middle-class / working-renter tenant base. Strengths: amenities A+, commute A+, housing A+; Watch: employment C-, crime F.
- Albany City School District (urban): math 37% / reading 40% proficiency, ranked #543 of 590 in NY (top 92%) — families likely to look elsewhere, expect single-tenant / working-renter base with shorter leases; 66% free/reduced lunch — lower-income household profile, screen leases tightly.
- Zoned schools: Albany High School (math 74% / reading 67%, grade B+, #710 of 1,100 statewide, top 65%, 2,676 students, 69% FRL) — zoned schools at 69% FRL track the district average.
- Zoned-school proficiency averages 70% at this address vs 38% district-wide (+32 pts) — the actual schools serving this property are materially stronger than the Albany City School District average implies; a family-tenant draw the district grade alone would hide.
- Market conditions: Rents rising fast (+5.0%/yr); 100 active listings in the ZIP; 40 comparable units currently listed for rent nearby; rentals at typical pace (median 26d on market — plan ~3-4 weeks tenant-placement turnaround); 675 units permitted in Albany County in 2024 (451 in 5+ unit buildings).
- This rent runs 38% of the median local income ($70k/yr) — at the standard rent-burdened threshold; future hikes will face affordability resistance.
Forward outlook
- Local home prices are declining (-3.0%/yr); year-one equity from $2k of loan paydown is wiped out by about $8k of value loss. Plan a longer hold.
- Albany County population projected at +9% by 2050 — modest demand growth; plan on rents tracking national, not racing it.
Negotiation context
- It's been on market 16 days — a 2% lower offer ($271k) is reasonable based on typical stale-listing flexibility.
- 3 sale attempts since 22y ago with the ask held roughly flat each time — persistent listings suggest the price (not the market) is what's stuck; bring a comps-based counter.
- Current owner paid $122k; list at $275k implies a 125% gain — meaningful room to come down on a strong offer.
Risks & watch-outs
- Watch-outs: built in 1927 — expect roof / HVAC / electrical / plumbing capex.
Questions for the listing agent
- What do current leases actually rent for vs. the listed asking? Can we see a recent rent roll and the last 12 months of T-12 income?
- Built in 1927 — when were the roof, HVAC, electrical panel, plumbing, and water heater last replaced?
- Is there a deadline driving the sale (1031 exchange, divorce, estate, relocation)? That informs how much negotiation room exists.
- Crime grade is F in this area — have there been break-ins, vandalism, or insurance claims at this property in the last 3 years? What carrier currently insures it and at what premium?
- The area grade is low — what's the realistic commute time and amenity access for the typical tenant pool here? Any planned neighborhood developments (good or bad) we should know about?
- What's the average days-on-market for RENTAL listings here right now (not sales)? A rising rental-DOM trend means longer vacancies and softer asking-rent achievability than the comps imply.
- What's the recent tenant-quality profile in this submarket — average credit score on applications, eviction rate, late-payment / NSF rate, and stable-employment percentage? A property-management company in the area should have these aggregated.
- How much new for-sale + rental construction is in the pipeline within 1–3 miles? Heavy new supply typically softens prices + rents 12–24 months out; constrained supply supports both.
Investment metrics
- 1% rule
- 0.81% ✗
- Cap rate
- 5.16%
- Cash-on-cash
- -4.03%
- DSCR
- 0.82
- GRM
- 10.3
CMA / ARV
- ARV (median comp)
- $349,209
- List price
- $275,000
- Delta
- -21.25%
- Verdict
- UNDERPRICED
- Comps
- 20 within 1.0 mi
Show comp detail 12 sales within ~0.75 mi
| Address | Dist | Beds/Ba | Sqft | Sold | Price | $/sf | Match |
|---|---|---|---|---|---|---|---|
| 16 Oakwood St | 0.01mi | 3/2.0 | 1,470 (-2%) | 1mo | $350,000 | $238 | 92 |
| 66 Oakwood St | 0.20mi | 3/1.0 | 1,440 (-4%) | 1mo | $305,000 | $212 | 84 |
| 49 Oakwood St | 0.12mi | 3/1.5 | 1,391 (-7%) | 1mo | $332,000 | $239 | 80 |
| 151 Woodlawn Ave | 0.40mi | 3/1.5 | 1,486 (-0%) | 1mo | $255,000 | $172 | 78 |
| 59 Van Schoick Ave | 0.33mi | 3/2.5 | 1,500 (+0%) | 2mo | $345,000 | $230 | 76 |
| 86 Grove Ave | 0.56mi | 3/1.5 | 1,500 (+0%) | 3mo | $295,000 | $197 | 68 |
| 880 Mercer St | 0.42mi | 3/2.0 | 1,571 (+5%) | 1mo | $316,000 | $201 | 67 |
| 370 Partridge St | 0.41mi | 3/2.0 | 1,375 (-8%) | 0mo | $370,000 | $269 | 63 |
| 777 Park Ave | 0.49mi | 3/1.5 | 1,382 (-8%) | 3mo | $272,000 | $197 | 60 |
| 8 Caldwell St | 0.44mi | 4/2.0 (+1) | 1,357 (-9%) | 2mo | $260,000 | $192 | 54 |
| 16 John David Ln | 0.72mi | 3/2.0 | 1,600 (+7%) | 1mo | $360,000 | $225 | 49 |
| 683 Park Ave | 0.56mi | 4/2.0 (+1) | 1,345 (-10%) | 2mo | $300,000 | $223 | 46 |
Match score weights: distance 35% · size 25% · config 20% · recency 20%. Top-matched comps best support the ARV.
Projected returns pro-forma
-3.0% appreciation · 5.05% rent growth · sell at horizon
- IRR
- -20.6%
- Equity multiple
- 0.27×
- Total profit
- $-56,282
- Equity at exit
- $41,003
- IRR
- -9.6%
- Equity multiple
- 0.35×
- Total profit
- $-49,878
- Equity at exit
- $23,777
Cash invested: $77,000 (down + closing). Projections, not guarantees.
Landlord ↔ Tenant lean methodology
- Overall (STATE)
- 15 Strongly Tenant-Friendly
- State New York
- 15 Strongly Tenant-Friendly · D+10
- County
- — inherits STATE
- City
- — inherits STATE
ZIP-level market 12208
- Home prices YoY
- -30.1%
- Rents YoY
- 5.0%
- Active inventory
- 100
- Price-to-rent
- 10.3×
Monthly cashflow live
- Estimated rent
- $2,215 high interval (Pro) →
- Mortgage (P&I)
- −$1,442
- Tax from tax record
- −$452 /mo · $5,420/yr
- Insurance
- −$115
- HOA
- −$0
- Vacancy / Maint / Mgmt
- −$465
- Net cashflow
- $-259
Break-even live
Sensitivity live
| Price | -10% $-103 | -5% $-181 | +0% $-259 | +5% $-337 | +10% $-414 |
|---|---|---|---|---|---|
| Rent | -10% $-434 | -5% $-346 | +0% $-259 | +5% $-171 | +10% $-84 |
| Rate | -1.0pp $-120 | -0.5pp $-189 | base $-259 | +0.5pp $-330 | +1.0pp $-403 |
UW: 25.0% down · 7.5% · 30yr · 1.5% tax · 5.0% vac · 8.0% maint · 8.0% mgmt
Financing live
Cash to close
- Down payment
- $68,750
- Closing costs
- $8,250
- Reserves months
- —
- Total cash needed
- —
Loan-product check · same deal, 3 products live
Conventional
25% down · 7.5% · 30yr
- Down + closing
- —
- Monthly P&I
- —
- Monthly cashflow
- —
- DSCR
- —
- Eligible?
- —
Personal DTI + credit; lowest rate.
DSCR
20% down · 8.5% · 30yr
- Down + closing
- —
- Monthly P&I
- —
- Monthly cashflow
- —
- DSCR
- —
- Eligible?
- —
No personal income docs; deal must DSCR.
Hard money
10% down · 12.0% · 12mo
- Down + closing
- —
- Monthly P&I
- —
- Monthly cashflow
- —
- DSCR
- —
- Eligible?
- —
Short-term bridge; refi at stabilization.
Rent comps 40 comps
| Address | Beds | Baths | Sqft | Rent | $/sqft | DOM | Units | Dist |
|---|---|---|---|---|---|---|---|---|
| 38 W Erie St Albany, NY | 4.0 | 2.0 | 1440 | $2,800 | $1.94 | 25d | 1 | 0.15mi |
| 35 Parkwood St Albany, NY | 2.0 | 1.0 | 900 | $1,495 | $1.66 | 25d | 1 | 0.17mi |
| 30 Cardinal Ave Albany, NY | 4.0 | 1.0 | 1529 | $2,800 | $1.83 | 46d | 1 | 0.19mi |
| 6A Weis Rd Albany, NY | 2.0 | 1.0 | 900 | $1,610 | $1.79 | 16d | 1 | 0.25mi |
| 563 New Scotland Ave Albany, NY | 2.0 | 1.0–2.0 | 931 | $3,125 | $3.36 | 16d | 37 | 0.29mi |
| 104 S Main Ave Unit 1 Albany, NY | 3.0 | 1.0 | 1300 | $2,600 | $2.00 | 45d | 1 | 0.33mi |
| 32 Peyster St Unit 2nd Albany, NY | 3.0 | 2.0 | 1500 | $2,300 | $1.53 | 45d | 1 | 0.36mi |
| 42 Harris Ave Unit 2 Albany, NY | 2.0 | 1.0 | 1000 | $1,600 | $1.60 | 16d | 1 | 0.48mi |
| 52 Grove Ave Albany, NY | 4.0 | 1.0 | 1200 | $2,200 | $1.83 | 23d | 1 | 0.52mi |
| 363 Ontario St Albany, NY | 1.0–2.0 | 1.0–2.5 | 1610 | $3,485 | $2.16 | 16d | 1 | 0.54mi |
| 602 Morris St Albany, NY | 3.0 | 1.0 | 1270 | $1,850 | $1.46 | 16d | 1 | 0.58mi |
| 53 Greenway N Albany, NY | 3.0 | 2.0 | 1500 | $2,600 | $1.73 | 25d | 1 | 0.60mi |
| 21 Woodlawn Ave Unit 3rd floor Albany, NY | 3.0 | 1.0 | 1300 | $1,500 | $1.15 | 25d | 1 | 0.60mi |
| 21 Woodlawn Ave Unit 3RDFL Albany, NY | 3.0 | 1.0 | 1300 | $1,500 | $1.15 | 45d | 1 | 0.60mi |
| 673 Myrtle Ave Albany, NY | 4.0 | 1.0 | 1076 | $2,400 | $2.23 | 23d | 1 | 0.64mi |
| 78 S Pine Ave Unit 2 Albany, NY | 3.0 | 1.5 | 1541 | $2,350 | $1.52 | 16d | 1 | 0.64mi |
| 614 Park Ave Albany, NY | 3.0 | 1.0 | 1118 | $2,500 | $2.24 | 45d | 1 | 0.66mi |
| 546 Mercer St Unit 1 Albany, NY | 3.0 | 1.0 | 1400 | $1,800 | $1.29 | 25d | 1 | 0.67mi |
| 830 Madison Ave Albany, NY | 3.0 | 1.0 | 1180 | $1,700 | $1.44 | 25d | 1 | 0.79mi |
| 517 Hamilton St Albany, NY | 4.0 | 1.0 | 1020 | $2,000 | $1.96 | 25d | 1 | 0.83mi |
| 489 Hamilton St Unit 1 Albany, NY | 3.0 | 1.0 | 1100 | $1,800 | $1.64 | 16d | 1 | 0.87mi |
| 437 Hamilton St Unit 2 Albany, NY | 4.0 | 1.0 | 1200 | $2,300 | $1.92 | 16d | 1 | 0.94mi |
| 433 Hamilton St Unit 1 Albany, NY | 4.0 | 1.0 | 1200 | $2,300 | $1.92 | 16d | 1 | 0.95mi |
| 9 Circle Ln Albany, NY | 2.0 | 1.0 | 771 | $1,805 | $2.34 | 16d | 1 | 0.96mi |
| 273 Western Ave Unit 3 Albany, NY | 3.0 | 1.0 | 1100 | $1,850 | $1.68 | 25d | 1 | 0.97mi |
| 273 Western Ave Unit 2 Albany, NY | 3.0 | 1.0 | 1000 | $1,800 | $1.80 | 25d | 1 | 0.97mi |
| 898 Lancaster St Unit 2 Albany, NY | 2.0 | 1.0 | 1200 | $1,700 | $1.42 | 25d | 1 | 0.99mi |
| 58 Elberon Pl Apt 2 Albany, NY | 4.0 | 1.0 | 1250 | $2,200 | $1.76 | 45d | 1 | 1.00mi |
| 223 Western Ave #1 Albany, NY | 3.0 | 1.0 | 1100 | $1,750 | $1.59 | 25d | 1 | 1.03mi |
| 180 Western Ave Unit 2nd Floor Albany, NY | 2.0 | 1.0 | 1000 | $1,575 | $1.57 | 45d | 1 | 1.08mi |
| 180 Western Ave Unit 1st Floor Albany, NY | 2.0 | 1.0 | 900 | $1,550 | $1.72 | 45d | 1 | 1.08mi |
| 178 Western Ave Unit 3 Albany, NY | 3.0 | 1.0 | 1500 | $1,725 | $1.15 | 16d | 1 | 1.08mi |
| 188 Spring St Unit 2 Albany, NY | 2.0 | 1.0 | 1200 | $1,475 | $1.23 | 45d | 1 | 1.09mi |
| 86 Hackett Blvd Albany, NY | 2.0 | 1.0 | 1100 | $1,900 | $1.73 | 25d | 1 | 1.10mi |
| 2 Friebel Rd Albany, NY | 3.0 | 2.0 | 1392 | $2,200 | $1.58 | 16d | 1 | 1.10mi |
| 135 Winthrop Ave Albany, NY | 3.0 | 2.0 | 1788 | $3,500 | $1.96 | 45d | 1 | 1.11mi |
| 569 Washington Ave Unit 1st Floor Albany, NY | 4.0 | 1.0 | 1275 | $2,000 | $1.57 | 45d | 1 | 1.13mi |
| 147 Western Ave Albany, NY | 3.0 | 1.0 | 1428 | $1,800 | $1.26 | 16d | 1 | 1.16mi |
| 830 Western Ave Albany, NY | 4.0 | 2.5 | 1600 | $2,700 | $1.69 | 16d | 1 | 1.17mi |
| 460 Washington Ave Albany, NY | 2.0 | 1.0 | 950 | $1,650 | $1.74 | 25d | 1 | 1.23mi |
Listing history 10 events
-
2026-06-16status $275,000 Pending 16 DOM
-
2026-06-15days on market $275,000 Active 16 DOM
-
2026-06-14statusdays on market $275,000 Active 14 DOM
-
2026-05-12status Pending 761-char remark
-
2026-04-30$275,000 Active 761-char remark
-
2004-04-28soldstatus $122,000
-
2004-04-23soldstatus $122,000 231-char remark
Show marketing remark (231 chars)
NO SHOWINGS TILL 2/16/04. DON'T LET CATS OUT. TAXES DON'T REFLECT STAR PROGRAM. COMPLETELY REHABED 3 YRS AGO: ROOF, SIDING, ELECTRIC, FURNACE, HW TANK, HARDWOOD FLOORS UP & DOWN. FL IN ATTIC. 24 HOUR NOTICE. Excellent Condition
-
2004-02-25historical 231-char remark
Show marketing remark (231 chars)
NO SHOWINGS TILL 2/16/04. DON'T LET CATS OUT. TAXES DON'T REFLECT STAR PROGRAM. COMPLETELY REHABED 3 YRS AGO: ROOF, SIDING, ELECTRIC, FURNACE, HW TANK, HARDWOOD FLOORS UP & DOWN. FL IN ATTIC. 24 HOUR NOTICE. Excellent Condition
-
2004-02-11$121,000 231-char remark
Show marketing remark (231 chars)
NO SHOWINGS TILL 2/16/04. DON'T LET CATS OUT. TAXES DON'T REFLECT STAR PROGRAM. COMPLETELY REHABED 3 YRS AGO: ROOF, SIDING, ELECTRIC, FURNACE, HW TANK, HARDWOOD FLOORS UP & DOWN. FL IN ATTIC. 24 HOUR NOTICE. Excellent Condition
-
1999-06-22soldstatus $20,000
ⓘ Source: listings_history table (triggers on properties + properties_extension) + one-shot
backfill from property_details.listing_events for pre-trigger history.
Tax reassessment forecast NY · Partial reset (capped growth)
- Current annual tax
- $5,420 · $452/mo
- Projected year-2 tax
- $5,420 · $452/mo
- Expected delta
- $0/yr ($0/mo · 0.0%)
ⓘ Screening estimate from a state-policy table — verify with the county assessor before closing.
Climate risk First Street
- Flood 1/10 Low FEMA zone X (unshaded) · 0% chance over 30 yrs
- Wildfire 2/10 Low
- Heat 4/10 Moderate 7 d/yr ≥97°F today · 16 d/yr by 30 yrs out
- Wind 3/10 Moderate 6% chance of damaging wind over 30 yrs
- Air quality 1/10 Low 0 unhealthy d/yr today · 0 by 30 yrs out
Nearby sold comps map
Loading sold comps map…
Walkable amenities ~0.75 mi
Loading nearby amenities…
Taxation est. · year 1
- Rental income
- $26,577
- − Mortgage interest
- −$15,404
- − Property taxes
- −$5,420
- − Insurance
- −$1,375
- − Repairs & maintenance
- −$2,126
- − Management
- −$2,126
- − Depreciation
- −$8,000
- Taxable loss
- −$7,875
- Est. tax savings @ 24.0%
- +$1,890
- After-tax cash flow
- $-1,215/yr
For passive investors: Depreciation is non-cash, so a rental often shows a tax loss while cash-flowing — sheltering income. Rental losses are passive: they offset passive income freely, and up to $25,000/yr can offset ordinary (W-2) income if you actively participate and your MAGI is under $100k (phasing out to $0 by $150k); unused losses carry forward. On sale, claimed depreciation is recaptured at up to 25%, and gains may owe capital-gains tax (a 1031 exchange can defer both). Figures are a year-1 estimate at your 24.0% rate — not tax advice; consult a CPA.
Schools (NCES district)
- District
- Albany City School District
- NCES district ID
- 3602460
- Math proficiency
- 37% ▲ 6.00%
- Reading proficiency
- 40% ▲ 7.00%
- Median HH income
- $40,568
- Composite
- 32.34/100
- National rank
- #5744
- State rank
- #543 of 590 in NY
Livability — Albany
- Score
- 79/100
- State rank
- #129
- US rank
- #2083
Category grades
Schools grade is shown separately in the Schools card above.
Census & demographics
- Census place
- Albany, NY
- County
- Albany County · 196,626 people
- City population
- 116,921
- Metro
- Albany-Schenectady-Troy, NY
- Population (ZIP)
- 23,289
- Household income
- $70,413
- Rent vs Own
- Severe rent burden
- 1952.0
Population outlook (Albany County) Hauer SSP2
- Today (2025)
- 320,794 people
- By 2030
- 327,401 · +2.1%
- By 2040
- 338,218 · +5.4%
- By 2050
- 348,467 · +8.6%
- By 2075
- 381,693 · +19.0%
- By 2100
- 393,809 · +22.8%
Race, ethnicity, and origin ACS 2023
- Neighborhood character
- Predominantly White (66%)
- Race & ethnicity
- White 66% Black 12% Asian 10% Hispanic / Latino 7% Two or more races 7%
- Hispanic origin (detail)
- Puerto Rican 3%
- Common ancestry
- Romanian 5% Italian 3% Scotch-Irish 3%
- Foreign-born
- 16% · Canada, China, Philippines
- Languages at home
- 83% English-only · Other Indo-European 4% Other Asian/Pacific 3% French/Haitian/Cajun 2%
Political lean MEDSL · Albany
- 2024 margin
- Strong D (+25.8) · D 62.9% · R 37.1%
- 2008→2024 swing
- -3.6pp toward R · 2008: 29.4pp · 2024: 25.8pp
- All cycles
- 2024: D+25.8 2020: D+31.4 2016: D+24.3 2012: D+31.0 2008: D+29.4
Not yet ingested
- Civics
- —
Market trends
- HPI YoY
- ▼ -120.46%
- Current HPI
- 279.716
- Rent YoY
- ▲ 5.05%
- Metro
- Albany-Schenectady-Troy, NY
- State GDP YoY
- ▲ 2.60%
- F500 in state
- 92
Industry mix (Fortune 500 HQ in NY)
| Industry | F500 HQs | Revenue |
|---|---|---|
| Financial Services | 10 | $950B |
|
||
| Consumer Goods | 9 | $162B |
|
||
| Insurance | 4 | $225B |
|
||
| Telecommunications | 2 | $144B |
|
||
| Pharmaceuticals | 2 | $112B |
|
||
| Media / Entertainment | 2 | $69B |
|
||
Price history
+1275.0% since first listed9 events — show timeline
- 2026-06-16 Pending — Global MLS
- 2026-06-12 Relisted — Global MLS
- 2026-05-12 Pending — Global MLS
- 2026-04-30 Listed $275,000 Global MLS
- 2004-04-28 Sold (Public Records) $122,000 Public Records
- 2004-04-23 Sold (MLS) $122,000 Global MLS
- 2004-02-25 Listing Removed — Global MLS
- 2004-02-11 Listed $121,000 Global MLS
- 1999-06-22 Sold (Public Records) $20,000 Public Records
Property tax history
+0.3%/yrLatest (2025): $5,420 · +1.5% YoY. Source: county tax records.
Cash-flow waterfall
monthlySold comps — $/sqft
last 12 mo · ≤1 miLoading sold comps…