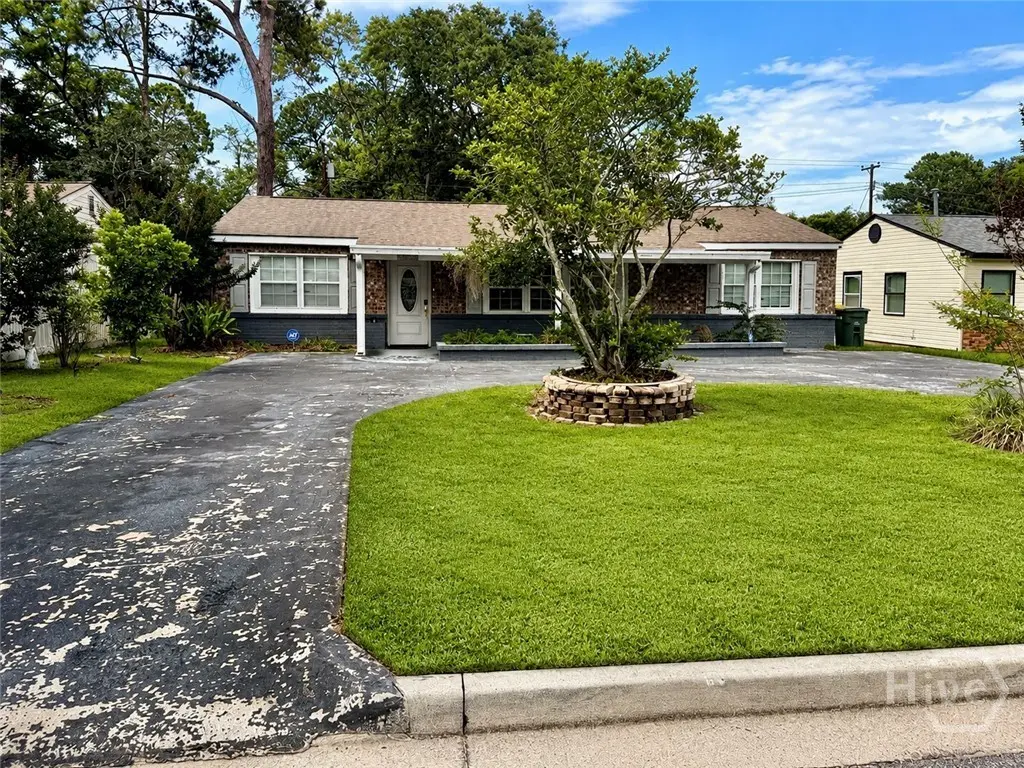
2206 N Fernwood Dr · Savannah, GA
Flood risk 1/10 · Minimal
- FEMA flood zone
- X (unshaded)
- Chance of flooding over 30 yrs
- 0.0%
- Est. flood insurance / yr
- $507 – $1,088
Fire risk 3/10 · Minor
- Est. fire insurance / yr
- $963 – $1,789
Heat risk 10/10 · Severe
- Hot days now (above 107°F)
- 7 days/yr
- Hot days in 30 yrs
- 18 days/yr
Wind risk 9/10 · Severe
- Chance of severe wind over 30 yrs
- 99.0%
Air-quality risk 2/10 · Minimal
- Unhealthy air days now
- 2 days/yr
- Unhealthy air days in 30 yrs
- 2 days/yr
Risk factors via First Street. Map © Google.
Why this score? — see what drove the D+ grade
The composite is a weighted blend of 9 inputs, each scored 0–100. Each bar is that input's sub-score; the figure is the points it added to the 100-point composite (weight × sub-score).
- ARV discount +14.6/15.0
- Cash flow +14.5/30.0
- DSCR +4.4/10.0
- Livability +4.3/5.0
- Rent growth +3.4/5.0
- 1% rule +2.9/10.0
- Condition / age +2.5/5.0
- Schools +2.0/10.0
- Appreciation +0.0/10.0
$298,000
🖨 Deal sheet 📄 Offer letter ✓ Due diligence
Listing remarks MLS
Endless opportunity awaits at this spacious residence with separate ADU that is ready for your vision and creativity! With a 3 bed/2 bath main home and studio ADU, this home is an incredible investment opportunity or your chance at the perfect space for multi-generational living. The main home features a large living room that flows into a spacious kitchen with ample cabinetry and stainless steel fridge and stove. Three bedrooms plus a separate den/bonus room, perfect for a home office, playroom, or additional bedroom, offer plenty of flexibility. Enjoy the oversized screened-in back porch overlooking a fully fenced backyard. The detached studio ADU is a hidden gem, complete with a cozy fireplace, full kitchen, and bathroom with a soaking tub - ideal for guests, rental income, or a private retreat. With its solid layout and versatile spaces, this property is a blank canvas with endless possibilities. Don’t miss the chance to bring this home to life!
Key facts
- Full kitchen
- Fenced backyard
- Large screened porch
Tags
Property features AI
Exterior
- Parking: Off-street parking
- Utilities: Public water; Public sewer
- Home design: Single-family residence; Single story
- Exterior features: Wood fencing; Has a view
Interior
- Kitchen: Oven; Range; Refrigerator; Electric water heater
- Bathrooms: Three full bathrooms
- Heating & cooling: Central heating (electric); Central air conditioning (electric)
- Interior features: Ceiling fans
- Laundry & utility: Laundry room; Washer hookup; Washer; Dryer
Neighborhood map
What this means for you Summary
Snapshot
- This is a 3-bed/1.0-bath single-family listed at $298k.
Deal economics
- At list price, monthly cash flow is $64 ($767/yr) — positive.
- The deal already cash-flows at list — no discount required.
- To meet the 1% rule (rent ≥ 1% of price), the offer needs to be $235k (21.3% below list).
- Recommended offer: $235k (21.3% below list) — sets the bar for 1% rule.
- Cap rate 6.6% vs local median 4.0% in Savannah — top-decile yield for the area; either an underpriced asset or a hidden risk that comps aren't pricing in. Stress-test before assuming the spread holds.
Location & tenants
- Location reads 86/100 on livability (#1 in GA, #397 nationally) — a professional / high-income tenant draw. Strengths: crime A+, amenities A+, commute A+; Watch: employment D, schools F.
- Savannah-Chatham County (urban): math 20% / reading 26% proficiency, ranked #134 of 174 in GA (top 77%) — low school quality limits family demand, transient renter base, plan for 1-2y turnover.
- Market conditions: Rents rising (+3.6%/yr); 226 active listings in the ZIP; 40 comparable units currently listed for rent nearby; rentals lingering (median 44d on market — plan ~5-8 weeks vacancy on turnover, expect pricing pressure); 52% of comp listings sitting > 30 days — soft ceiling on asking rent; 2,694 units permitted in Chatham County in 2024 (973 in 5+ unit buildings).
- At $2,346/mo this rent would consume 53% of the median local household income ($53k/yr) (locally 1649% of renters already pay >50% of income on rent) — very limited rent-growth headroom before tenants either downsize or default.
Forward outlook
- Local home prices are declining (-3.0%/yr); year-one equity from $2k of loan paydown is wiped out by about $9k of value loss. Plan a longer hold.
- Chatham County population projected at +33% by 2050 — long-run rental-demand tailwind backs the buy-and-hold thesis.
Negotiation context
- It's been on market 16 days — a 2% lower offer ($294k) is reasonable based on typical stale-listing flexibility.
- 2 sale attempts with the ask held roughly flat each time — persistent listings suggest the price (not the market) is what's stuck; bring a comps-based counter.
Risks & watch-outs
- Watch-outs: built in 1950 — expect roof / HVAC / electrical / plumbing capex.
- Climate carrying-cost: severe wind risk, 99% chance of damaging wind over 30y; extreme-heat days projected 7→18/yr by 2055 (HVAC capex compounding) — expect insurance premiums to compound above CPI over the hold.
Questions for the listing agent
- Built in 1950 — when were the roof, HVAC, electrical panel, plumbing, and water heater last replaced?
- Is there a deadline driving the sale (1031 exchange, divorce, estate, relocation)? That informs how much negotiation room exists.
- Schools are F-rated, which usually means shorter tenancies and higher turnover. Who's the typical renter profile here, and what's been the actual vacancy rate?
- The area grade is low — what's the realistic commute time and amenity access for the typical tenant pool here? Any planned neighborhood developments (good or bad) we should know about?
- What's the average days-on-market for RENTAL listings here right now (not sales)? A rising rental-DOM trend means longer vacancies and softer asking-rent achievability than the comps imply.
- What's the recent tenant-quality profile in this submarket — average credit score on applications, eviction rate, late-payment / NSF rate, and stable-employment percentage? A property-management company in the area should have these aggregated.
- How much new for-sale + rental construction is in the pipeline within 1–3 miles? Heavy new supply typically softens prices + rents 12–24 months out; constrained supply supports both.
Investment metrics
- 1% rule
- 0.79% ✗
- Cap rate
- 6.55%
- Cash-on-cash
- 0.92%
- DSCR
- 1.04
- GRM
- 10.6
CMA / ARV
- ARV (on-the-fly)
- $354,120
- Comps found
- 12
Show comp detail 12 sales within ~0.75 mi
| Address | Dist | Beds/Ba | Sqft | Sold | Price | $/sf | Match |
|---|---|---|---|---|---|---|---|
| 2310 Coakley St | 0.34mi | 3/2.0 | 1,648 (+6%) | 9mo | $376,500 | $228 | 64 |
| 82 Tall Pine Ave | 0.21mi | 4/2.0 (+1) | 1,616 (+4%) | 14mo | $309,000 | $191 | 63 |
| 3204 Hazel St | 0.26mi | 4/2.0 (+1) | 1,634 (+5%) | 15mo | $300,000 | $184 | 59 |
| 1910 Linnhurst Dr | 0.54mi | 3/2.0 | 1,440 (-8%) | 1mo | $310,000 | $215 | 57 |
| 3108 Butler Ave | 0.48mi | 3/2.0 | 1,485 (-5%) | 12mo | $341,000 | $230 | 55 |
| 2808 Whatley Ave | 0.45mi | 3/3.0 | 1,410 (-10%) | 1mo | $360,000 | $255 | 54 |
| 3130 Robertson Ave | 0.73mi | 3/2.0 | 1,462 (-6%) | 1mo | $410,000 | $280 | 51 |
| 3010 Leonard St | 0.60mi | 3/2.0 | 1,715 (+10%) | 3mo | $390,000 | $227 | 49 |
| 2338 Fleet St | 0.42mi | 3/2.0 | 1,400 (-10%) | 14mo | $257,000 | $184 | 47 |
| 2301 Pinetree Rd | 0.68mi | 3/1.0 | 1,372 (-12%) | 11mo | $250,000 | $182 | 39 |
| 2211 E 59th St | 0.67mi | 3/2.5 | 1,414 (-9%) | 15mo | $412,000 | $291 | 35 |
| 2314 Shirley Dr | 0.74mi | 4/2.0 (+1) | 1,384 (-11%) | 11mo | $299,900 | $217 | 28 |
Match score weights: distance 35% · size 25% · config 20% · recency 20%. Top-matched comps best support the ARV.
Projected returns pro-forma
-3.0% appreciation · 3.62% rent growth · sell at horizon
- IRR
- -14.3%
- Equity multiple
- 0.49×
- Total profit
- $-42,877
- Equity at exit
- $44,433
- IRR
- -4.7%
- Equity multiple
- 0.68×
- Total profit
- $-26,506
- Equity at exit
- $25,766
Cash invested: $83,440 (down + closing). Projections, not guarantees.
Landlord ↔ Tenant lean methodology
- Overall (STATE)
- 90 Strongly Landlord-Friendly
- State Georgia
- 90 Strongly Landlord-Friendly · R+3
- County
- — inherits STATE
- City
- — inherits STATE
ZIP-level market 31404
- Rents YoY
- 3.6%
- Active inventory
- 226
- Price-to-rent
- 10.6×
Monthly cashflow live
- Estimated rent
- $2,346 high interval (Pro) →
- Mortgage (P&I)
- −$1,563
- Tax from tax record
- −$103 /mo · $1,233/yr
- Insurance
- −$124
- HOA
- −$0
- Vacancy / Maint / Mgmt
- −$493
- Net cashflow
- $64
Break-even live
UW: 25.0% down · 7.5% · 30yr · 1.5% tax · 5.0% vac · 8.0% maint · 8.0% mgmt
Financing live
Cash to close
- Down payment
- $74,500
- Closing costs
- $8,940
- Reserves months
- —
- Total cash needed
- —
Loan-product check · same deal, 3 products live
Conventional
25% down · 7.5% · 30yr
- Down + closing
- —
- Monthly P&I
- —
- Monthly cashflow
- —
- DSCR
- —
- Eligible?
- —
Personal DTI + credit; lowest rate.
DSCR
20% down · 8.5% · 30yr
- Down + closing
- —
- Monthly P&I
- —
- Monthly cashflow
- —
- DSCR
- —
- Eligible?
- —
No personal income docs; deal must DSCR.
Hard money
10% down · 12.0% · 12mo
- Down + closing
- —
- Monthly P&I
- —
- Monthly cashflow
- —
- DSCR
- —
- Eligible?
- —
Short-term bridge; refi at stabilization.
Rent comps 40 comps
| Address | Beds | Baths | Sqft | Rent | $/sqft | DOM | Units | Dist |
|---|---|---|---|---|---|---|---|---|
| 24 N Parkwood Dr Savannah, GA | 3.0 | 2.0 | 1277 | $2,200 | $1.72 | 14d | 1 | 0.21mi |
| 3715 Skidaway Rd Savannah, GA | 3.0 | 2.0 | 1154 | $1,895 | $1.64 | 23d | 1 | 0.36mi |
| 2112 Clars Ave Unit A Savannah, GA | 2.0 | 1.0 | 1500 | $1,700 | $1.13 | 44d | 1 | 0.52mi |
| 1904 E 51st St Savannah, GA | 4.0 | 2.5 | 1800 | $2,300 | $1.28 | 14d | 1 | 0.59mi |
| 2637 Evergreen Ave Savannah, GA | 3.0 | 2.0 | 1642 | $2,000 | $1.22 | 44d | 1 | 0.62mi |
| 2337 Shirley Dr Savannah, GA | 3.0 | 2.0 | 1850 | $2,600 | $1.41 | 23d | 1 | 0.70mi |
| 3712 Oakland Ct Savannah, GA | 3.0 | 1.5 | 1903 | $2,495 | $1.31 | 14d | 1 | 0.71mi |
| 2220 E Victory Dr #24 Savannah, GA | 2.0 | 1.5 | 1102 | $1,700 | $1.54 | 23d | 1 | 0.72mi |
| 3601 Eastgate Dr Savannah, GA | 3.0 | 2.0 | 1400 | $2,500 | $1.79 | 44d | 1 | 0.72mi |
| 2323 Downing Ave Savannah, GA | 2.0–3.0 | 1.5–2.0 | 1014 | $1,899 | $1.87 | 14d | 14 | 0.73mi |
| 2902 River Dr Unit D301 Savannah, GA | 3.0 | 2.0 | 1800 | $4,700 | $2.61 | 44d | 1 | 0.74mi |
| 5020 La Roche Ave Savannah, GA | 3.0 | 2.5 | 2170 | $3,350 | $1.54 | 14d | 1 | 0.75mi |
| 2110 E 56th St Savannah, GA | 3.0 | 2.0 | 1140 | $2,200 | $1.93 | 44d | 1 | 0.76mi |
| 2345 Ranchland Dr Savannah, GA | 3.0 | 1.0 | 1098 | $2,100 | $1.91 | 14d | 1 | 0.78mi |
| 2612 Dogwood Ave Savannah, GA | 1.0–3.0 | 1.0–2.0 | 1020 | $1,775 | $1.74 | 14d | 11 | 0.83mi |
| 3206 Robertson Ave Savannah, GA | 4.0 | 3.0 | 2221 | $5,500 | $2.48 | 23d | 1 | 0.85mi |
| 2328 E 41st St Savannah, GA | 2.0 | 1.0 | 1072 | $1,700 | $1.59 | 44d | 1 | 0.87mi |
| 2033 E 41st St Savannah, GA | 4.0 | 2.0 | 1448 | $2,800 | $1.93 | 44d | 1 | 0.90mi |
| 1901 E 57th St Savannah, GA | 3.0 | 1.0 | 1215 | $1,750 | $1.44 | 44d | 1 | 0.95mi |
| 1815 E 58th St Savannah, GA | 3.0 | 2.0 | 1176 | $2,400 | $2.04 | 44d | 1 | 1.00mi |
| 2233 E De Renne Ave Savannah, GA | 4.0 | 2.0 | 1476 | $2,400 | $1.63 | 23d | 1 | 1.01mi |
| 30 Pine Valley Rd Savannah, GA | 3.0 | 1.0 | 1133 | $1,950 | $1.72 | 44d | 1 | 1.05mi |
| 2201 E 37th St Savannah, GA | 3.0 | 1.5 | 1424 | $1,800 | $1.26 | 23d | 1 | 1.06mi |
| 1802 E 62nd St Savannah, GA | 4.0 | 2.0 | 1475 | $2,800 | $1.90 | 44d | 1 | 1.07mi |
| 2840 Wicklow St Savannah, GA | 1.0–3.0 | 1.0–2.0 | 1071 | $2,869 | $2.68 | 14d | 50 | 1.07mi |
| 1534 E 53rd St Unit A Savannah, GA | 3.0 | 2.0 | 1606 | $2,950 | $1.84 | 23d | 1 | 1.09mi |
| 375 Laurel Oak Ln Thunderbolt, GA | 3.0 | 2.5 | 1200 | $1,800 | $1.50 | 44d | 1 | 1.09mi |
| 1315 Bonaventure Rd Unit upstair Savannah, GA | 2.0 | 1.0 | 1650 | $1,500 | $0.91 | 14d | 1 | 1.10mi |
| 5505 Betty Dr Savannah, GA | 3.0 | 2.0 | 1550 | $1,859 | $1.20 | 44d | 1 | 1.12mi |
| 2619 Livingston Ave Savannah, GA | 3.0 | 1.5 | 1300 | $1,555 | $1.20 | 23d | 1 | 1.13mi |
| 1507 E 51st St Savannah, GA | 3.0 | 2.0 | 2135 | $2,880 | $1.35 | 44d | 1 | 1.18mi |
| 1413 E 55th St Savannah, GA | 3.0 | 1.0 | 1100 | $2,500 | $2.27 | 44d | 1 | 1.21mi |
| 2149 Vermont Ave Savannah, GA | 3.0 | 2.0 | 1213 | $1,955 | $1.61 | 44d | 1 | 1.21mi |
| 1405 E 51st St Savannah, GA | 3.0 | 2.0 | 1458 | $2,850 | $1.95 | 44d | 1 | 1.26mi |
| 1804 Georgia Ave Savannah, GA | 3.0 | 2.0 | 1528 | $2,950 | $1.93 | 44d | 1 | 1.28mi |
| 114 Oleander Ave Unit Na Savannah, GA | 3.0 | 1.0 | 1128 | $2,100 | $1.86 | 44d | 1 | 1.34mi |
| 1411 E 58th St Savannah, GA | 3.0 | 2.0 | 1100 | $1,900 | $1.73 | 23d | 1 | 1.34mi |
| 1331 E 48th St Savannah, GA | 3.0 | 2.0 | 1408 | $3,450 | $2.45 | 44d | 1 | 1.36mi |
| 2222 Bacon Park Dr Savannah, GA | 4.0 | 2.0 | 2246 | $2,995 | $1.33 | 44d | 1 | 1.38mi |
| 1436 E 42nd St Savannah, GA | 3.0 | 2.0 | 1447 | $2,290 | $1.58 | 14d | 1 | 1.42mi |
Listing history 13 events
-
2026-06-18days on market $298,000 Active 16 DOM
-
2026-06-17days on market $298,000 Active 15 DOM
-
2026-06-16days on market $298,000 Active 14 DOM
-
2026-06-15days on market $298,000 Active 13 DOM
-
2026-06-14days on market $298,000 Active 11 DOM
-
2026-06-13days on market $298,000 Active 10 DOM
-
2026-06-10days on market $298,000 Active 8 DOM
-
2026-06-09days on market $298,000 Active 7 DOM
-
2026-06-08days on market $298,000 Active 6 DOM
-
2026-06-07days on market $298,000 Active 5 DOM
-
2026-06-05days on market $298,000 Active 2 DOM
-
2026-06-02remarks 673-char remark
-
2026-06-02$298,000 Active 1 DOM
ⓘ Source: listings_history table (triggers on properties + properties_extension) + one-shot
backfill from property_details.listing_events for pre-trigger history.
Tax reassessment forecast GA · Resets to sale price
- Current annual tax
- $1,233 · $103/mo
- Projected year-2 tax
- $2,742 · $228/mo
- Expected delta
- +$1,509/yr (+$126/mo · 122.4%)
ⓘ Screening estimate from a state-policy table — verify with the county assessor before closing.
Climate risk First Street
- Flood 1/10 Low FEMA zone X (unshaded) · 0% chance over 30 yrs
- Wildfire 3/10 Moderate
- Heat 10/10 Extreme 7 d/yr ≥107°F today · 18 d/yr by 30 yrs out
- Wind 9/10 Extreme 99% chance of damaging wind over 30 yrs
- Air quality 2/10 Low 2 unhealthy d/yr today · 2 by 30 yrs out
Nearby sold comps map
Loading sold comps map…
Walkable amenities ~0.75 mi
Loading nearby amenities…
Taxation est. · year 1
- Rental income
- $28,155
- − Mortgage interest
- −$16,693
- − Property taxes
- −$1,233
- − Insurance
- −$1,490
- − Repairs & maintenance
- −$2,252
- − Management
- −$2,252
- − Depreciation
- −$8,669
- Taxable loss
- −$4,434
- Est. tax savings @ 24.0%
- +$1,064
- After-tax cash flow
- $1,831/yr
For passive investors: Depreciation is non-cash, so a rental often shows a tax loss while cash-flowing — sheltering income. Rental losses are passive: they offset passive income freely, and up to $25,000/yr can offset ordinary (W-2) income if you actively participate and your MAGI is under $100k (phasing out to $0 by $150k); unused losses carry forward. On sale, claimed depreciation is recaptured at up to 25%, and gains may owe capital-gains tax (a 1031 exchange can defer both). Figures are a year-1 estimate at your 24.0% rate — not tax advice; consult a CPA.
Schools (NCES district)
- District
- Savannah-Chatham County
- NCES district ID
- 1301020
- Math proficiency
- 20% ▼ -11.00%
- Reading proficiency
- 26% ▼ -5.00%
- Median HH income
- $47,443
- Composite
- 20.14/100
- National rank
- #8639
- State rank
- #134 of 174 in GA
Livability — Savannah
- Score
- 86/100
- State rank
- #1
- US rank
- #397
Category grades
Schools grade is shown separately in the Schools card above.
Census & demographics
- Census place
- Savannah, GA
- County
- Chatham County · 271,602 people
- City population
- 216,564
- Metro
- Savannah, GA
- Population (ZIP)
- 30,062
- Household income
- $53,303
- Rent vs Own
- Severe rent burden
- 1649.0
Population outlook (Chatham County) Hauer SSP2
- Today (2025)
- 332,584 people
- By 2030
- 355,508 · +6.9%
- By 2040
- 400,030 · +20.3%
- By 2050
- 443,019 · +33.2%
- By 2075
- 534,579 · +60.7%
- By 2100
- 583,863 · +75.6%
Race, ethnicity, and origin ACS 2023
- Neighborhood character
- Majority Black (60%)
- Race & ethnicity
- Black 60% White 33% Two or more races 4% Hispanic / Latino 3% Asian 1%
- Common ancestry
- Romanian 2% Lithuanian 1% Slovak 1%
- Foreign-born
- 4% · Canada, Vietnam
- Languages at home
- 93% English-only · Spanish 3% Other Asian/Pacific 1% French/Haitian/Cajun 1%
Political lean MEDSL · Chatham
- 2024 margin
- D (+18.0) · D 58.6% · R 40.6%
- 2008→2024 swing
- +3.6pp toward D · 2008: 14.4pp · 2024: 18.0pp
- All cycles
- 2024: D+18.0 2020: D+18.8 2016: D+14.5 2012: D+12.0 2008: D+14.4
Not yet ingested
- Civics
- —
Market trends
- HPI YoY
- ▼ -187.86%
- Current HPI
- 310.0764
- Rent YoY
- ▲ 3.62%
- Metro
- Savannah, GA
- State GDP YoY
- ▲ 2.66%
- F500 in state
- 28
Industry mix (Fortune 500 HQ in GA)
| Industry | F500 HQs | Revenue |
|---|---|---|
| Paper / Packaging | 2 | $29B |
|
||
| Retail | 1 | $160B |
|
||
| Transportation / Logistics | 1 | $91B |
|
||
| Airlines | 1 | $62B |
|
||
| Consumer Goods | 1 | $47B |
|
||
| Utilities | 1 | $25B |
|
||
Price history
+1286.0% since first listed8 events — show timeline
- 2026-06-01 Listed $298,000 Hive MLS
- 2025-10-08 Sold (Public Records) $290,000 Public Records
- 2025-10-06 Sold (MLS) $290,000 Hive MLS
- 2025-08-11 Listed $290,000 Hive MLS
- 2025-06-25 Sold (Public Records) $217,000 Public Records
- 2006-12-29 Sold (Public Records) $112,500 Public Records
- 2004-11-19 Sold (Public Records) $87,900 Public Records
- 1975-12-01 Sold (Public Records) $21,500 Public Records
Property tax history
+7.6%/yrLatest (2025): $1,233 · -48.6% YoY. Source: county tax records.
Cash-flow waterfall
monthlySold comps — $/sqft
last 12 mo · ≤1 miLoading sold comps…