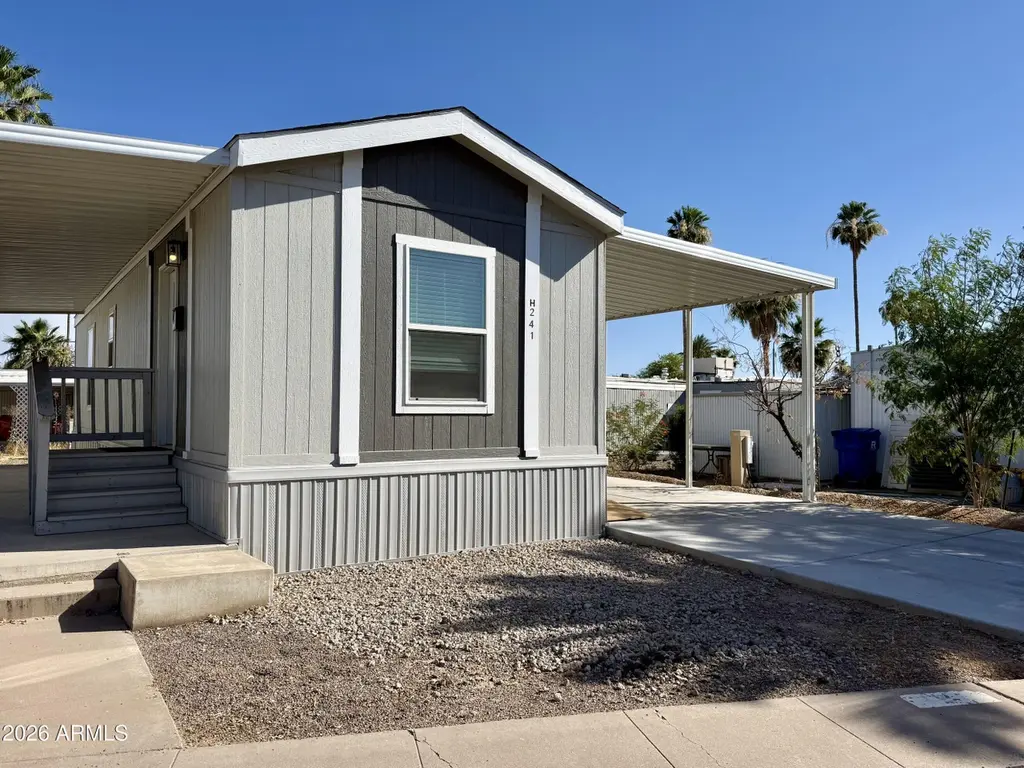
5201 W Camelback Rd Unit H241 · Phoenix, AZ
Flood risk 1/10 · Minimal
- FEMA flood zone
- X (shaded)
- Chance of flooding over 30 yrs
- 0.0%
- Est. flood insurance / yr
- $507 – $1,088
Fire risk 1/10 · Minimal
- Est. fire insurance / yr
- $610 – $1,132
Heat risk 9/10 · Severe
- Hot days now (above 112°F)
- 4 days/yr
- Hot days in 30 yrs
- 12 days/yr
Wind risk 1/10 · Minimal
- Chance of severe wind over 30 yrs
- —
Air-quality risk 2/10 · Minimal
- Unhealthy air days now
- 0 days/yr
- Unhealthy air days in 30 yrs
- 1 days/yr
Risk factors via First Street. Map © Google.
Why this score? — see what drove the B- grade
The composite is a weighted blend of 9 inputs, each scored 0–100. Each bar is that input's sub-score; the figure is the points it added to the 100-point composite (weight × sub-score).
- Cash flow +30.0/30.0
- 1% rule +10.0/10.0
- DSCR +10.0/10.0
- ARV discount +7.5/15.0
- Condition / age +4.0/5.0
- Livability +3.8/5.0
- Rent growth +3.3/5.0
- Schools +1.1/10.0
- Appreciation +0.0/10.0
$41,000
🖨 Deal sheet 📄 Offer letter ✓ Due diligence
Listing remarks
Welcome to this lovely, barely lived-in 2023 manufactured home in a 55+ adult community offers modern comfort and convenience. This move-in-ready home comes furnished, making it the perfect seasonal retreat or full-time residence. Enjoy an open and inviting floor plan with contemporary finishes, abundant natural light, and a well-appointed kitchen with a gas stove. The home also features ramp access for added accessibility and ease of entry. Don't miss this opportunity to own a like-new home that's ready for you to enjoy from day one!
Key facts
- Move-in ready
- Open floor plan
- Gas stove
Tags
Property features AI
Finance
- HOA & community: Land lease (monthly $955); Association maintains grounds and streets; Community pool; Pickleball courts; Gated community; Heated community spa; Community media room; Coin-operated laundry; Fitness center
Exterior
- Parking: 2 covered parking spaces; 2 carport spaces
- Utilities: City water; Public sewer
- Home design: Manufactured/mobile home; Leasehold ownership
- Construction: Vinyl siding; Panelized construction; Composition roof; Building area per builder
- Exterior features: Gravel/stone front yard; Gravel/stone back yard; No fencing indicated
Interior
- Kitchen: Laminate counters; Refrigerator; Dishwasher
- Bedrooms: 2 possible bedrooms
- Flooring: Vinyl
- Bathrooms: 1 full bathroom
- Heating & cooling: Electric heating; Central air conditioning
- Interior features: Furnished (see remarks); No interior steps; Laminate counters; Dual-pane windows; Accessible approach with ramp
- Laundry & utility: Indoor laundry with washer/dryer hookup only
Neighborhood map
What this means for you Summary
Snapshot
- This is a 2-bed/1.0-bath manufactured listed at $41k. Condition is rated good.
Deal economics
- At list price, monthly cash flow is $794 ($10k/yr) — positive.
- The deal already cash-flows at list — no discount required.
- Meets the 1% rule at list price ($1k rent vs $41k).
- Recommended offer: $40k (1.5% below list) — sets the bar for market timing.
- Cap rate 29.5% vs local median 3.3% in Phoenix — top-decile yield for the area; either an underpriced asset or a hidden risk that comps aren't pricing in. Stress-test before assuming the spread holds.
Location & tenants
- Location reads 75/100 on livability (#16 in AZ, #3,924 nationally) — a middle-class / working-renter tenant base. Strengths: amenities A+, commute A+, housing A+; Watch: health & safety C-, crime F.
- Phoenix Union High School District (4286) (urban): math 10% / reading 15% proficiency, ranked #224 of 249 in AZ (top 90%) — low school quality limits family demand, transient renter base, plan for 1-2y turnover.
- Market conditions: Rents rising (+3.1%/yr); 70 active listings in the ZIP; 19 comparable units currently listed for rent nearby; rentals leasing fast (median 1d on market — plan ~1-2 weeks tenant-placement turnaround); 36,011 units permitted in Maricopa County in 2024 (12,801 in 5+ unit buildings).
Forward outlook
- Local home prices are declining (-3.0%/yr); year-one equity from $283 of loan paydown is wiped out by about $1k of value loss. Plan a longer hold.
- Maricopa County population projected at +38% by 2050 — long-run rental-demand tailwind backs the buy-and-hold thesis.
- At projected returns (-3.0% appreciation + 3.1% rent growth), your $11k cash investment doubles in ~2 years — after that, you're playing with house money.
Negotiation context
- It's been on market 20 days — a 2% lower offer ($40k) is reasonable based on typical stale-listing flexibility.
Risks & watch-outs
- Climate carrying-cost: extreme-heat days projected 4→12/yr by 2055 (HVAC capex compounding) — expect insurance premiums to compound above CPI over the hold.
Questions for the listing agent
- Is there a deadline driving the sale (1031 exchange, divorce, estate, relocation)? That informs how much negotiation room exists.
- Crime grade is F in this area — have there been break-ins, vandalism, or insurance claims at this property in the last 3 years? What carrier currently insures it and at what premium?
- What's the average days-on-market for RENTAL listings here right now (not sales)? A rising rental-DOM trend means longer vacancies and softer asking-rent achievability than the comps imply.
- What's the recent tenant-quality profile in this submarket — average credit score on applications, eviction rate, late-payment / NSF rate, and stable-employment percentage? A property-management company in the area should have these aggregated.
- How much new for-sale + rental construction is in the pipeline within 1–3 miles? Heavy new supply typically softens prices + rents 12–24 months out; constrained supply supports both.
Investment metrics
- 1% rule
- 3.33% ✓
- Cap rate
- 29.53%
- Cash-on-cash
- 83.01%
- DSCR
- 4.69
- GRM
- 2.5
CMA / ARV
- ARV (on-the-fly)
- $20,160
- Comps found
- 4
Show comp detail 4 sales within ~0.75 mi
| Address | Dist | Beds/Ba | Sqft | Sold | Price | $/sf | Match |
|---|---|---|---|---|---|---|---|
| 5201 W Camelback Rd Unit F127 | 0.12mi | 2/1.5 | 660 (-2%) | 22mo | $20,000 | $30 | 71 |
| 5201 W Camelback Rd Unit A-168 | 0.10mi | 2/1.0 | 720 (+7%) | 20mo | $25,000 | $35 | 67 |
| 5201 W Camelback Rd Unit F122 | 0.12mi | 2/1.0 | 720 (+7%) | 22mo | $8,000 | $11 | 64 |
| 5201 W Camelback Rd Unit C110 | 0.12mi | 2/1.0 | 756 (+12%) | 14mo | $14,900 | $20 | 62 |
Match score weights: distance 35% · size 25% · config 20% · recency 20%. Top-matched comps best support the ARV.
Projected returns pro-forma
-3.0% appreciation · 3.09% rent growth · sell at horizon
- IRR
- 83.4%
- Equity multiple
- 4.84×
- Total profit
- $44,077
- Equity at exit
- $6,113
- IRR
- 86.7%
- Equity multiple
- 10.07×
- Total profit
- $104,098
- Equity at exit
- $3,545
Cash invested: $11,480 (down + closing). Projections, not guarantees.
Landlord ↔ Tenant lean methodology
- Overall (STATE)
- 87 Strongly Landlord-Friendly
- State Arizona
- 87 Strongly Landlord-Friendly · R+3
- County
- — inherits STATE
- City
- — inherits STATE
ZIP-level market 85031
- Home prices YoY
- -23.5%
- Rents YoY
- 3.1%
- Active inventory
- 70
- Price-to-rent
- 2.5×
Monthly cashflow live
- Estimated rent
- $1,364 high interval (Pro) →
- Mortgage (P&I)
- −$215
- Tax est. 1.5%
- −$51 /mo · $615/yr
- Insurance
- −$17
- HOA
- −$0
- Vacancy / Maint / Mgmt
- −$286
- Net cashflow
- $794
Break-even live
UW: 25.0% down · 7.5% · 30yr · 1.5% tax · 5.0% vac · 8.0% maint · 8.0% mgmt
Financing live
Cash to close
- Down payment
- $10,250
- Closing costs
- $1,230
- Reserves months
- —
- Total cash needed
- —
Loan-product check · same deal, 3 products live
Conventional
25% down · 7.5% · 30yr
- Down + closing
- —
- Monthly P&I
- —
- Monthly cashflow
- —
- DSCR
- —
- Eligible?
- —
Personal DTI + credit; lowest rate.
DSCR
20% down · 8.5% · 30yr
- Down + closing
- —
- Monthly P&I
- —
- Monthly cashflow
- —
- DSCR
- —
- Eligible?
- —
No personal income docs; deal must DSCR.
Hard money
10% down · 12.0% · 12mo
- Down + closing
- —
- Monthly P&I
- —
- Monthly cashflow
- —
- DSCR
- —
- Eligible?
- —
Short-term bridge; refi at stabilization.
Rent comps 19 comps
| Address | Beds | Baths | Sqft | Rent | $/sqft | DOM | Units | Dist |
|---|---|---|---|---|---|---|---|---|
| 5201 W Camelback Rd Lot FC200 Phoenix, AZ | 2.0 | 1.0 | 672 | $1,400 | $2.08 | 1d | 1 | 0.03mi |
| 5038 N 55th Ave Glendale, AZ | 1.0 | 1.0 | 404 | $1,200 | $2.97 | 1d | 22 | 0.49mi |
| 5190 N 55th Ave Glendale, AZ | 1.0–2.0 | 1.0–2.0 | 708 | $1,560 | $2.20 | 1d | 15 | 0.53mi |
| 5039 N 57th Ave Glendale, AZ | 1.0–2.0 | 1.0–2.0 | 800 | $2,403 | $3.00 | 1d | 15 | 0.60mi |
| 4337 N 53rd Ln Phoenix, AZ | 1.0 | 1.0 | 675 | $1,135 | $1.68 | 1d | 1 | 0.61mi |
| 4337 N 53rd Ln Unit A1 Phoenix, AZ | 1.0 | 1.0 | 675 | $1,185 | $1.76 | 1d | 1 | 0.62mi |
| 5631 W Colter St Glendale, AZ | 1.0–3.0 | 1.0–2.0 | 885 | $1,324 | $1.50 | 1d | 5 | 0.65mi |
| 5045 N 58th Ave Glendale, AZ | 1.0–2.0 | 1.0–2.0 | 821 | $1,399 | $1.70 | 1d | 1 | 0.73mi |
| 3810 N Maryvale Pkwy Phoenix, AZ | 1.0–2.0 | 1.0–2.0 | 804 | $1,100 | $1.37 | 1d | 2 | 1.09mi |
| 5755 N 59th Ave Glendale, AZ | 1.0 | 1.0 | 632 | $1,167 | $1.85 | 17d | 1 | 1.15mi |
| 4441 W Bethany Home Rd Glendale, AZ | 1.0 | 1.0 | 550 | $1,190 | $2.16 | 1d | 21 | 1.36mi |
| 4413 W Bethany Home Rd Glendale, AZ | 1.0 | 1.0 | 600 | $1,150 | $1.92 | 1d | 1 | 1.39mi |
| 5750 N 59th Ave Unit 1A Glendale, AZ | 1.0 | 1.0 | 500 | $854 | $1.71 | 1d | 1 | 1.39mi |
| 5750 N 59th Ave Unit 1B Glendale, AZ | 1.0 | 1.0 | 650 | $984 | $1.51 | 1d | 1 | 1.39mi |
| 4030 N 44th Ave Phoenix, AZ | 1.0 | 1.0 | 525 | $1,195 | $2.28 | 1d | 16 | 1.40mi |
| 5740 N 59th Ave Unit 1A Glendale, AZ | 1.0 | 1.0 | 545 | $876 | $1.61 | 1d | 1 | 1.40mi |
| 5740 N 59th Ave Unit 1B Glendale, AZ | 1.0 | 1.0 | 676 | $886 | $1.31 | 1d | 1 | 1.40mi |
| 4404 W Bethany Home Rd Glendale, AZ | 1.0–2.0 | 1.0 | 665 | $1,370 | $2.06 | 1d | 4 | 1.48mi |
| 6105 N 59th Ave Glendale, AZ | 1.0 | 1.0 | 475 | $899 | $1.89 | 1d | 1 | 1.50mi |
Listing history 14 events
-
2026-06-18days on market $41,000 Active 20 DOM
-
2026-06-17days on market $41,000 Active 19 DOM
-
2026-06-16days on market $41,000 Active 18 DOM
-
2026-06-15days on market $41,000 Active 17 DOM
-
2026-06-13days on market $41,000 Active 15 DOM
-
2026-06-13days on market $41,000 Active 14 DOM
-
2026-06-09days on market $41,000 Active 11 DOM
-
2026-06-08days on market $41,000 Active 10 DOM
-
2026-06-07days on market $41,000 Active 9 DOM
-
2026-06-04days on market $41,000 Active 6 DOM
-
2026-06-03days on market $41,000 Active 5 DOM
-
2026-06-02days on market $41,000 Active 4 DOM
-
2026-06-01days on market $41,000 Active 3 DOM
-
2026-05-31days on market $41,000 Active 2 DOM
ⓘ Source: listings_history table (triggers on properties + properties_extension) + one-shot
backfill from property_details.listing_events for pre-trigger history.
Climate risk First Street
- Flood 1/10 Low FEMA zone X (shaded) · 0% chance over 30 yrs
- Wildfire 1/10 Low
- Heat 9/10 Extreme 4 d/yr ≥112°F today · 12 d/yr by 30 yrs out
- Wind 1/10 Low
- Air quality 2/10 Low 0 unhealthy d/yr today · 1 by 30 yrs out
Nearby sold comps map
Loading sold comps map…
Walkable amenities ~0.75 mi
Loading nearby amenities…
Taxation est. · year 1
- Rental income
- $16,366
- − Mortgage interest
- −$2,297
- − Property taxes
- −$615
- − Insurance
- −$205
- − Repairs & maintenance
- −$1,309
- − Management
- −$1,309
- − Depreciation
- −$1,193
- Taxable income
- $9,438
- Est. tax owed @ 24.0%
- −$2,265
- After-tax cash flow
- $7,264/yr
For passive investors: Depreciation is non-cash, so a rental often shows a tax loss while cash-flowing — sheltering income. Rental losses are passive: they offset passive income freely, and up to $25,000/yr can offset ordinary (W-2) income if you actively participate and your MAGI is under $100k (phasing out to $0 by $150k); unused losses carry forward. On sale, claimed depreciation is recaptured at up to 25%, and gains may owe capital-gains tax (a 1031 exchange can defer both). Figures are a year-1 estimate at your 24.0% rate — not tax advice; consult a CPA.
Condition & rehab AI · 12 photos
This move-in-ready manufactured home in a 55+ community offers modern comfort and is in excellent condition with no visible repairs needed. It's ready for immediate occupancy and can be further enhanced with minor updates to boost its resale and rental value.
Value-add opportunities
- Both Painting exterior and interior walls — Enhances curb appeal and interior aesthetics
- Both Landscaping improvements — Enhances curb appeal and adds value
- Both Add a small outdoor seating area — Improves outdoor living space and adds value
Renovation cost estimate screening
Value-add ROI direction
- Both Painting exterior and interior walls — Enhances curb appeal and interior aesthetics ↑
- Both Landscaping improvements — Enhances curb appeal and adds value ↑
- Both Add a small outdoor seating area — Improves outdoor living space and adds value ↑
ⓘ Cost ranges are severity-bucket heuristics (US national rule-of-thumb). Get contractor quotes + a written scope before underwriting a rehab budget.
Schools (NCES district)
- District
- Phoenix Union High School District (4286)
- NCES district ID
- 0406330
- Math proficiency
- 10% ▼ -27.00%
- Reading proficiency
- 15% ▼ -18.00%
- Median HH income
- $39,055
- Composite
- 10.63/100
- National rank
- #9773
- State rank
- #224 of 249 in AZ
Livability — Phoenix
- Score
- 75/100
- State rank
- #16
- US rank
- #3924
Category grades
Schools grade is shown separately in the Schools card above.
Census & demographics
- Census place
- Phoenix, AZ
- County
- Maricopa County · 4,537,380 people
- City population
- 1,500,198
- Metro
- Phoenix-Mesa-Chandler, AZ
- Population (ZIP)
- 31,191
- Household income
- $70,412
- Rent vs Own
- Severe rent burden
- 822.0
Population outlook (Maricopa County) Hauer SSP2
- Today (2025)
- 4,979,203 people
- By 2030
- 5,378,229 · +8.0%
- By 2040
- 6,156,598 · +23.6%
- By 2050
- 6,872,376 · +38.0%
- By 2075
- 8,401,270 · +68.7%
- By 2100
- 9,247,439 · +85.7%
Race, ethnicity, and origin ACS 2023
- Neighborhood character
- Predominantly Hispanic (79%)
- Race & ethnicity
- Hispanic / Latino 79% Two or more races 19% White 13% Black 5% Native American 1%
- Hispanic origin (detail)
- Mexican 74%
- Foreign-born
- 30% · Canada, United Kingdom
- Languages at home
- 37% English-only · Spanish 60%
Political lean MEDSL · Maricopa
- 2024 margin
- Toss-up / Even · D 47.7% · R 51.2% · Other 1.1%
- 2008→2024 swing
- +7.1pp toward D · 2008: -10.6pp · 2024: -3.5pp
- All cycles
- 2024: R+3.5 2020: D+2.2 2016: R+3.5 2012: R+12.0 2008: R+10.6
Not yet ingested
- Civics
- —
Market trends
- HPI YoY
- ▼ -139.76%
- Current HPI
- 456.0053
- Rent YoY
- ▲ 3.09%
- Metro
- Phoenix-Mesa-Chandler, AZ
- State GDP YoY
- ▲ 4.54%
- F500 in state
- 20
Industry mix (Fortune 500 HQ in AZ)
| Industry | F500 HQs | Revenue |
|---|---|---|
| Technology | 2 | $13B |
|
||
| Mining / Metals | 1 | $23B |
|
||
| Environmental Services | 1 | $16B |
|
||
| Metals / Steel | 1 | $14B |
|
||
| Technology Distribution | 1 | $9B |
|
||
| Homebuilding | 1 | $8B |
|
||
Price history
1 event — show timeline
- 2026-05-29 Listed $41,000 ARMLS
Cash-flow waterfall
monthlySold comps — $/sqft
last 12 mo · ≤1 miLoading sold comps…