2165 Clyde Park Ave SW · Wyoming, MI
Flood risk 1/10 · Minimal
- FEMA flood zone
- X (unshaded)
- Chance of flooding over 30 yrs
- 0.0%
- Est. flood insurance / yr
- $473 – $860
Fire risk 1/10 · Minimal
- Est. fire insurance / yr
- $784 – $1,456
Heat risk 2/10 · Minimal
- Hot days now (above 97°F)
- 7 days/yr
- Hot days in 30 yrs
- 16 days/yr
Wind risk 2/10 · Minimal
- Chance of severe wind over 30 yrs
- —
Air-quality risk 2/10 · Minimal
- Unhealthy air days now
- 2 days/yr
- Unhealthy air days in 30 yrs
- 2 days/yr
Risk factors via First Street. Map © Google.
Why this score? — see what drove the C- grade
The composite is a weighted blend of 9 inputs, each scored 0–100. Each bar is that input's sub-score; the figure is the points it added to the 100-point composite (weight × sub-score).
- Cash flow +17.3/30.0
- 1% rule +10.0/10.0
- ARV discount +7.5/15.0
- DSCR +5.4/10.0
- Livability +3.9/5.0
- Rent growth +2.5/5.0
- Condition / age +2.5/5.0
- Schools +1.5/10.0
- Appreciation +0.0/10.0
$75,000
🖨 Deal sheet 📄 Offer letter ✓ Due diligence
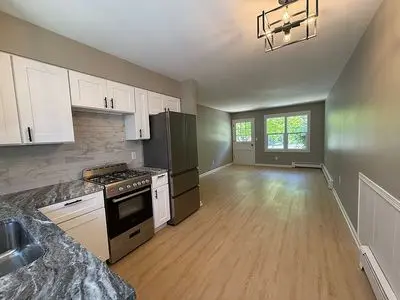
Listing remarks
Exceptional value under $80,000 & acirc; & euro; & rdquo; with ALL utilities and landscaping included. In Leisure Acres, one of Wyoming, Michigan& apos; s most sought-after 55+ communities, this is as good as it gets. Welcome to Leisure Acres, where comfort, community, and truly maintenance-free living come together. Heat, electric, water, trash, and landscaping are all covered & acirc; & euro; & rdquo; lock the door and live your life. This fully remodeled 2-bedroom, 1-bath condo is the opportunity buyers in this market have been waiting for, and at this price point, it will not last long. Every single inch has been upgraded. Brand new luxury vinyl plank floor
Key facts
- Brand new bathroom
- Landscaping included
- Granite countertops
Tags
Property features AI
Exterior
- Home design: Built in 1965
- Construction: Living area of approximately 590 (listed)
- Exterior features: Located in the Urbandale subdivision
Neighborhood map
What this means for you Summary
Snapshot
- This is a 2-bed/1.0-bath condo listed at $75k.
Deal economics
- At list price, monthly cash flow is $55 ($662/yr) — positive.
- The deal already cash-flows at list — no discount required.
- Meets the 1% rule at list price ($1k rent vs $75k).
- Cap rate 7.2% vs local median 3.8% in Wyoming — top-decile yield for the area; either an underpriced asset or a hidden risk that comps aren't pricing in. Stress-test before assuming the spread holds.
Location & tenants
- Location reads 77/100 on livability (#126 in MI, #3,095 nationally) — a middle-class / working-renter tenant base. Strengths: cost of living A+, housing A+, health & safety A+; Watch: schools D+, crime D-, amenities F.
- Godfrey-Lee Public Schools (urban): math 9% / reading 27% proficiency, ranked #482 of 540 in MI (top 89%) — low school quality limits family demand, transient renter base, plan for 1-2y turnover; 82% free/reduced lunch — lower-income household profile, screen leases tightly.
- Market conditions: 88 active listings in the ZIP; 8 comparable units currently listed for rent nearby; rentals at typical pace (median 14d on market — plan ~3-4 weeks tenant-placement turnaround); 2,253 units permitted in Kent County in 2024 (969 in 5+ unit buildings).
Forward outlook
- Local home prices are declining (-3.0%/yr); year-one equity from $519 of loan paydown is wiped out by about $2k of value loss. Plan a longer hold.
- Kent County population projected at +22% by 2050 — long-run rental-demand tailwind backs the buy-and-hold thesis.
Negotiation context
- Only 10 days on market — expect competitive offers; lowballing is unlikely to land.
- 13 sale attempts since 37y ago with the ask held roughly flat each time — persistent listings suggest the price (not the market) is what's stuck; bring a comps-based counter.
- Current owner paid $22k; list at $75k implies a 242% gain — meaningful room to come down on a strong offer.
Risks & watch-outs
- Watch-outs: HOA is 39% of rent.
Questions for the listing agent
- Built in 1965 — when were the roof, HVAC, electrical panel, plumbing, and water heater last replaced?
- What does the HOA fee cover, when was the last increase, and are there any pending special assessments or reserve-fund shortfalls?
- Any open or pending special assessments — roof, HVAC, plumbing, elevator, façade? What's the per-unit balance and payoff schedule, and is the seller paying it off at close or rolling it to the buyer?
- Is there a deadline driving the sale (1031 exchange, divorce, estate, relocation)? That informs how much negotiation room exists.
- Schools are D-rated, which usually means shorter tenancies and higher turnover. Who's the typical renter profile here, and what's been the actual vacancy rate?
- Crime grade is D in this area — have there been break-ins, vandalism, or insurance claims at this property in the last 3 years? What carrier currently insures it and at what premium?
- What's the average days-on-market for RENTAL listings here right now (not sales)? A rising rental-DOM trend means longer vacancies and softer asking-rent achievability than the comps imply.
- What's the recent tenant-quality profile in this submarket — average credit score on applications, eviction rate, late-payment / NSF rate, and stable-employment percentage? A property-management company in the area should have these aggregated.
- How much new apartment / multifamily construction is in the pipeline within 1–3 miles? Heavy new supply (>2% of stock underway) typically softens rents 12–24 months out; light construction supports rent growth.
Investment metrics
- 1% rule
- 1.93% ✓
- Cap rate
- 7.18%
- Cash-on-cash
- 3.15%
- DSCR
- 1.14
- GRM
- 4.3
CMA / ARV
No comps found within radius.
Projected returns pro-forma
-3.0% appreciation · 3.0% rent growth · sell at horizon
- IRR
- -10.8%
- Equity multiple
- 0.61×
- Total profit
- $-8,269
- Equity at exit
- $11,183
- IRR
- -0.8%
- Equity multiple
- 0.94×
- Total profit
- $-1,167
- Equity at exit
- $6,485
Cash invested: $21,000 (down + closing). Projections, not guarantees.
Landlord ↔ Tenant lean methodology
- Overall (STATE)
- 62 Landlord-Friendly
- State Michigan
- 62 Landlord-Friendly · EVEN
- County
- — inherits STATE
- City
- — inherits STATE
ZIP-level market 49509
- Active inventory
- 88
- Price-to-rent
- 4.3×
Monthly cashflow live
- Estimated rent
- $1,446 high interval (Pro) →
- Mortgage (P&I)
- −$393
- Tax est. 1.5%
- −$94 /mo · $1,125/yr
- Insurance
- −$31
- HOA est. from 3 same-building comps
- −$569
- Vacancy / Maint / Mgmt
- −$304
- Net cashflow
- $55
Break-even live
UW: 25.0% down · 7.5% · 30yr · 1.5% tax · 5.0% vac · 8.0% maint · 8.0% mgmt
Financing live
Cash to close
- Down payment
- $18,750
- Closing costs
- $2,250
- Reserves months
- —
- Total cash needed
- —
Loan-product check · same deal, 3 products live
Conventional
25% down · 7.5% · 30yr
- Down + closing
- —
- Monthly P&I
- —
- Monthly cashflow
- —
- DSCR
- —
- Eligible?
- —
Personal DTI + credit; lowest rate.
DSCR
20% down · 8.5% · 30yr
- Down + closing
- —
- Monthly P&I
- —
- Monthly cashflow
- —
- DSCR
- —
- Eligible?
- —
No personal income docs; deal must DSCR.
Hard money
10% down · 12.0% · 12mo
- Down + closing
- —
- Monthly P&I
- —
- Monthly cashflow
- —
- DSCR
- —
- Eligible?
- —
Short-term bridge; refi at stabilization.
Rent comps 8 comps
| Address | Beds | Baths | Sqft | Rent | $/sqft | DOM | Units | Dist |
|---|---|---|---|---|---|---|---|---|
| 2134 Cleveland Ave SW Wyoming, MI | 1.0 | 1.0 | 602 | $945 | $1.57 | 21d | 1 | 0.57mi |
| 2727 Madelyn Dr SW Unit A Wyoming, MI | 2.0 | 1.0 | 700 | $1,225 | $1.75 | 23d | 1 | 0.90mi |
| 2040 Division Ave S Unit 205 Grand Rapids, MI | 1.0 | 1.0 | 719 | $1,490 | $2.07 | 2d | 1 | 1.01mi |
| 1401 Prairie Pkwy SW Wyoming, MI | 3.0 | 1.0–2.0 | 790 | $1,958 | $2.48 | 19d | 1 | 1.21mi |
| 3123 Copley St SW Unit C Wyoming, MI | 2.0 | 1.0 | 700 | $1,495 | $2.14 | 2d | 1 | 1.27mi |
| 3131 Copley St SW Unit A Wyoming, MI | 2.0 | 1.0 | 700 | $1,495 | $2.14 | 2d | 1 | 1.28mi |
| 2931 Burlingame Ave SW Wyoming, MI | 1.0–2.0 | 1.0 | 800 | $1,380 | $1.73 | 2d | 1 | 1.35mi |
| 3200 Charlesgate Ave SW Unit A Wyoming, MI | 2.0 | 1.0 | 700 | $1,100 | $1.57 | 14d | 1 | 1.39mi |
HOA detail condo
- Monthly dues
- $0 · $0/yr
- Likely covers
- watertrashelectriclandscaping
- Assessments
- None detected in remarks — confirm with the listing agent.
Listing history 8 events
-
2026-06-18days on market $75,000 Active 10 DOM
-
2026-06-17days on market $75,000 Active 9 DOM
-
2026-06-16days on market $75,000 Active 8 DOM
-
2026-06-15days on market $75,000 Active 7 DOM
-
2026-06-14days on market $75,000 Active 5 DOM
-
2026-06-10days on market $75,000 Active 2 DOM
-
2026-06-09remarks 671-char remark
-
2026-06-09$75,000 Active 1 DOM
ⓘ Source: listings_history table (triggers on properties + properties_extension) + one-shot
backfill from property_details.listing_events for pre-trigger history.
Climate risk First Street
- Flood 1/10 Low FEMA zone X (unshaded) · 0% chance over 30 yrs
- Wildfire 1/10 Low
- Heat 2/10 Low 7 d/yr ≥97°F today · 16 d/yr by 30 yrs out
- Wind 2/10 Low
- Air quality 2/10 Low 2 unhealthy d/yr today · 2 by 30 yrs out
Nearby sold comps map
Loading sold comps map…
Walkable amenities ~0.75 mi
Loading nearby amenities…
Taxation est. · year 1
- Rental income
- $17,354
- − Mortgage interest
- −$4,201
- − Property taxes
- −$1,125
- − Insurance
- −$375
- − Repairs & maintenance
- −$1,388
- − Management
- −$1,388
- − HOA
- −$6,828
- − Depreciation
- −$2,182
- Taxable loss
- −$134
- Est. tax savings @ 24.0%
- +$32
- After-tax cash flow
- $694/yr
For passive investors: Depreciation is non-cash, so a rental often shows a tax loss while cash-flowing — sheltering income. Rental losses are passive: they offset passive income freely, and up to $25,000/yr can offset ordinary (W-2) income if you actively participate and your MAGI is under $100k (phasing out to $0 by $150k); unused losses carry forward. On sale, claimed depreciation is recaptured at up to 25%, and gains may owe capital-gains tax (a 1031 exchange can defer both). Figures are a year-1 estimate at your 24.0% rate — not tax advice; consult a CPA.
Schools (NCES district)
- District
- Godfrey-Lee Public Schools
- NCES district ID
- 2616080
- Math proficiency
- 9% ▼ -1.00%
- Reading proficiency
- 27% ▲ 5.00%
- Median HH income
- $39,436
- Composite
- 15.17/100
- National rank
- #9345
- State rank
- #482 of 540 in MI
Livability — Wyoming
- Score
- 77/100
- State rank
- #126
- US rank
- #3095
Category grades
Schools grade is shown separately in the Schools card above.
Census & demographics
- Census place
- Wyoming, MI
- County
- Kent County · 533,805 people
- City population
- 56,117
- Metro
- Grand Rapids-Kentwood, MI
- Population (ZIP)
- 28,152
- Household income
- $65,132
- Rent vs Own
- Severe rent burden
- 681.0
Population outlook (Kent County) Hauer SSP2
- Today (2025)
- 712,484 people
- By 2030
- 748,618 · +5.1%
- By 2040
- 814,777 · +14.4%
- By 2050
- 868,556 · +21.9%
- By 2075
- 966,487 · +35.7%
- By 2100
- 967,975 · +35.9%
Race, ethnicity, and origin ACS 2023
- Neighborhood character
- Diverse neighborhood (Simpson 0.64)
- Race & ethnicity
- White 49% Hispanic / Latino 34% Two or more races 20% Black 10% Native American 2% Asian 2%
- Hispanic origin (detail)
- Mexican 20% Puerto Rican 2% Cuban 2% Dominican 2%
- Common ancestry
- Iranian 12% Romanian 6% Lithuanian 2%
- Foreign-born
- 17% · Canada, Vietnam
- Languages at home
- 70% English-only · Spanish 26% Vietnamese 1%
Political lean MEDSL · Kent
- 2024 margin
- Lean D (+5.4) · D 51.8% · R 46.5% · Other 1.7%
- 2008→2024 swing
- +4.8pp toward D · 2008: 0.5pp · 2024: 5.4pp
- All cycles
- 2024: D+5.4 2020: D+6.1 2016: R+3.1 2012: R+7.9 2008: D+0.5
Not yet ingested
- Civics
- —
Market trends
- HPI YoY
- ▼ -255.45%
- Current HPI
- 345.1978
- Rent YoY
- —
- Metro
- Grand Rapids-Kentwood, MI
- State GDP YoY
- ▲ 1.37%
- F500 in state
- 28
Industry mix (Fortune 500 HQ in MI)
| Industry | F500 HQs | Revenue |
|---|---|---|
| Automotive Parts | 3 | $48B |
|
||
| Automotive | 2 | $372B |
|
||
| Chemicals | 1 | $45B |
|
||
| Automotive Retail | 1 | $29B |
|
||
| Healthcare / Medical Devices | 1 | $23B |
|
||
| Automotive Technology | 1 | $20B |
|
||
Price history
+123.9% since first listed24 events — show timeline
- 2026-06-09 Listed $75,000 FSBO.com
- 2015-01-24 Listing Removed — SW Michigan MLS
- 2015-01-24 Listing Removed — SW Michigan MLS
- 2015-01-24 Listing Removed — SW Michigan MLS
- 2015-01-07 Listing Removed — SW Michigan MLS
- 2014-10-17 Sold (MLS) $21,900 SW Michigan MLS
- 2014-10-17 Sold (MLS) $21,900 REALCOMP
- 2014-06-10 Listed $21,900 SW Michigan MLS
- 2014-06-10 Listed $21,900 REALCOMP
- 2006-07-25 Sold (MLS) $15,000 REALCOMP
- 2006-07-25 Sold (MLS) $15,000 SW Michigan MLS
- 2006-02-13 Listed $19,900 REALCOMP
- 2006-02-13 Listed $19,900 SW Michigan MLS
- 1990-07-24 Sold (MLS) $21,500 REALCOMP
- 1990-07-24 Sold (MLS) $21,500 SW Michigan MLS
- 1990-05-04 Listed $22,900 REALCOMP
- 1990-05-04 Listed $22,900 SW Michigan MLS
- 1990-05-02 Listing Removed — REALCOMP
- 1990-02-02 Listed $24,900 REALCOMP
- 1990-02-02 Listed $24,900 SW Michigan MLS
- 1989-05-22 Listed $26,900 REALCOMP
- 1989-05-22 Listed $26,900 SW Michigan MLS
- 1989-01-18 Listed $33,500 REALCOMP
- 1989-01-18 Listed $33,500 SW Michigan MLS
Cash-flow waterfall
monthlySold comps — $/sqft
last 12 mo · ≤1 miLoading sold comps…