201 Bronco Cir #0 · Como, CO
Flood risk 1/10 · Minimal
- FEMA flood zone
- X (unshaded)
- Chance of flooding over 30 yrs
- 0.0%
- Est. flood insurance / yr
- $473 – $860
Fire risk 5/10 · Moderate
- Est. fire insurance / yr
- $939 – $1,743
Heat risk 1/10 · Minimal
- Hot days now (above 80°F)
- 7 days/yr
- Hot days in 30 yrs
- 20 days/yr
Wind risk 2/10 · Minimal
- Chance of severe wind over 30 yrs
- —
Air-quality risk 1/10 · Minimal
- Unhealthy air days now
- 0 days/yr
- Unhealthy air days in 30 yrs
- 0 days/yr
Risk factors via First Street. Map © Google.
Why this score? — see what drove the C grade
The composite is a weighted blend of 9 inputs, each scored 0–100. Each bar is that input's sub-score; the figure is the points it added to the 100-point composite (weight × sub-score).
- Cash flow +22.3/30.0
- ARV discount +7.5/15.0
- DSCR +7.1/10.0
- 1% rule +5.9/10.0
- Condition / age +3.8/5.0
- Appreciation +3.3/10.0
- Schools +3.1/10.0
- Rent growth +2.5/5.0
- Livability +2.5/5.0
$178,000
🖨 Deal sheet 📄 Offer letter ✓ Due diligence
Listing remarks
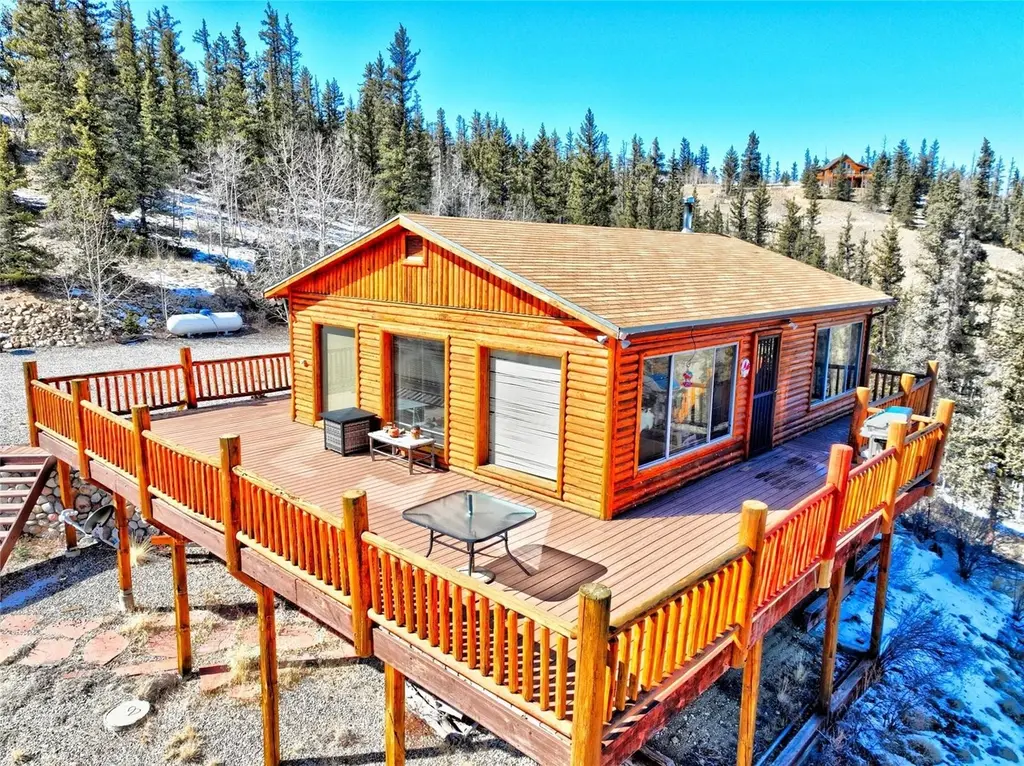
You could own a 1/3 PARTNERSHIP In this charming cabin in Indian Mountain. Each partner is entitled to an equivalent share of the annual use. The location can't be beat, privacy and stunning views. The property has massive mountain views, and Tarryall Creek runs right through the large ranch that the lot backs up to. The main level of the cabin has a warm, open, inviting great room with two separate seating areas and a dining space. A wood burning stove will keep you cozy in the winter. The open kitchen has an island with additional seating. A 3/4 bath with Washer/Dryer completes the main level. Downstairs you have 2 bedrooms and a full bath, ideal accommodations for family and guests. Sitt
Key facts
- Beautiful deck
- Tarryall creek
- Open kitchen
Tags
Property features AI
Finance
- Other: Residential rural zoning; Has view; Subdivision: INDIAN MOUNTAIN
- HOA & community: Homeowners association with an annual fee of $50; Community clubhouse
Exterior
- Parking: Detached garage (2 spaces) — see remarks
- Utilities: Private well water; Septic tank; Electricity available; Propane available; Phone available
- Home design: Two levels; Log construction; Timeshare residential property
- Construction: Composition roof
- Exterior features: Deck; Barbecue; Satellite dish; Rolling, sloped lot with many trees; Dirt road access (publicly maintained)
Interior
- Kitchen: Gas range; Microwave; Refrigerator
- Flooring: Carpet; Tile
- Bathrooms: 1 full bathroom; 1 three-quarter bathroom
- Heating & cooling: Propane heating; Wood stove heating
- Interior features: Furnished; Wood burning stove / fireplace; Finished basement
- Laundry & utility: Washer; Dryer; Gas water heater
Neighborhood map
What this means for you Summary
Snapshot
- This is a 2-bed/2.0-bath single-family listed at $178k. Condition is rated good.
Deal economics
- At list price, monthly cash flow is $293 ($4k/yr) — positive.
- The deal already cash-flows at list — no discount required.
- Meets the 1% rule at list price ($2k rent vs $178k).
- Recommended offer: $167k (6.0% below list) — sets the bar for market timing.
- Cap rate 8.3% vs local median 2.2% in Como — top-decile yield for the area; either an underpriced asset or a hidden risk that comps aren't pricing in. Stress-test before assuming the spread holds.
Location & tenants
- Location reads: area grade C — affects rentability + tenant quality, not the cash-flow math above.
- Park County School District No. Re-2 (rural): math 25% / reading 39% proficiency, ranked #89 of 176 in CO (top 51%) — families likely to look elsewhere, expect single-tenant / working-renter base with shorter leases.
- Market conditions: 140 active listings in the ZIP; 144 units permitted in Park County in 2024 (0 in 5+ unit buildings).
Forward outlook
- Local home prices are declining (-3.0%/yr); year-one equity from $1k of loan paydown is wiped out by about $5k of value loss. Plan a longer hold.
- Park County population projected to shrink 7% by 2050 — rents likely to lag national; underwrite the cash flow, not the appreciation.
Negotiation context
- It's been on market 87 days — a 6% lower offer ($167k) is reasonable based on typical stale-listing flexibility.
Risks & watch-outs
- Climate carrying-cost: moderate wildfire risk — expect insurance premiums to compound above CPI over the hold.
Questions for the listing agent
- It's been on market 87 days. Have you received any prior offers? Is the seller open to a 6% concession, seller financing, or rate buy-down credit?
- What does the HOA fee cover, when was the last increase, and are there any pending special assessments or reserve-fund shortfalls?
- Why hasn't it sold? Are there any deal-killer items the seller is aware of (foundation, flood, title, zoning, code violations)?
- Is there a deadline driving the sale (1031 exchange, divorce, estate, relocation)? That informs how much negotiation room exists.
- What's the average days-on-market for RENTAL listings here right now (not sales)? A rising rental-DOM trend means longer vacancies and softer asking-rent achievability than the comps imply.
- What's the recent tenant-quality profile in this submarket — average credit score on applications, eviction rate, late-payment / NSF rate, and stable-employment percentage? A property-management company in the area should have these aggregated.
- How much new for-sale + rental construction is in the pipeline within 1–3 miles? Heavy new supply typically softens prices + rents 12–24 months out; constrained supply supports both.
Investment metrics
- 1% rule
- 1.09% ✓
- Cap rate
- 8.27%
- Cash-on-cash
- 7.05%
- DSCR
- 1.31
- GRM
- 7.7
CMA / ARV
No comps found within radius.
Projected returns pro-forma
-3.0% appreciation · 3.0% rent growth · sell at horizon
- IRR
- -5.5%
- Equity multiple
- 0.80×
- Total profit
- $-10,173
- Equity at exit
- $26,540
- IRR
- 4.2%
- Equity multiple
- 1.31×
- Total profit
- $15,270
- Equity at exit
- $15,390
Cash invested: $49,840 (down + closing). Projections, not guarantees.
Landlord ↔ Tenant lean methodology
- Overall (STATE)
- 38 Tenant-Leaning
- State Colorado
- 38 Tenant-Leaning · D+4
- County
- — inherits STATE
- City
- — inherits STATE
ZIP-level market 80432
- Home prices YoY
- -1.3%
- Active inventory
- 140
- Price-to-rent
- 7.7×
Monthly cashflow live
- Estimated rent
- $1,933 medium interval (Pro) →
- Mortgage (P&I)
- −$933
- Tax est. 1.5%
- −$222 /mo · $2,670/yr
- Insurance
- −$74
- HOA
- −$4
- Vacancy / Maint / Mgmt
- −$406
- Net cashflow
- $293
Break-even live
UW: 25.0% down · 7.5% · 30yr · 1.5% tax · 5.0% vac · 8.0% maint · 8.0% mgmt
Financing live
Cash to close
- Down payment
- $44,500
- Closing costs
- $5,340
- Reserves months
- —
- Total cash needed
- —
Loan-product check · same deal, 3 products live
Conventional
25% down · 7.5% · 30yr
- Down + closing
- —
- Monthly P&I
- —
- Monthly cashflow
- —
- DSCR
- —
- Eligible?
- —
Personal DTI + credit; lowest rate.
DSCR
20% down · 8.5% · 30yr
- Down + closing
- —
- Monthly P&I
- —
- Monthly cashflow
- —
- DSCR
- —
- Eligible?
- —
No personal income docs; deal must DSCR.
Hard money
10% down · 12.0% · 12mo
- Down + closing
- —
- Monthly P&I
- —
- Monthly cashflow
- —
- DSCR
- —
- Eligible?
- —
Short-term bridge; refi at stabilization.
HOA detail
- Monthly dues
- $4 · $48/yr
Listing history 16 events
-
2026-06-19days on market $178,000 Active 87 DOM
-
2026-06-18days on market $178,000 Active 86 DOM
-
2026-06-17days on market $178,000 Active 85 DOM
-
2026-06-17days on market $178,000 Active 84 DOM
-
2026-06-15days on market $178,000 Active 83 DOM
-
2026-06-14days on market $178,000 Active 81 DOM
-
2026-06-12days on market $178,000 Active 80 DOM
-
2026-06-09days on market $178,000 Active 77 DOM
-
2026-06-08days on market $178,000 Active 76 DOM
-
2026-06-07days on market $178,000 Active 75 DOM
-
2026-06-05days on market $178,000 Active 72 DOM
-
2026-06-02days on market $178,000 Active 70 DOM
-
2026-06-01days on market $178,000 Active 69 DOM
-
2026-05-31days on market $178,000 Active 68 DOM
-
2026-05-30days on market $178,000 Active 67 DOM
-
2026-03-24$178,000 Active
ⓘ Source: listings_history table (triggers on properties + properties_extension) + one-shot
backfill from property_details.listing_events for pre-trigger history.
Climate risk First Street
- Flood 1/10 Low FEMA zone X (unshaded) · 0% chance over 30 yrs
- Wildfire 5/10 Major
- Heat 1/10 Low 7 d/yr ≥80°F today · 20 d/yr by 30 yrs out
- Wind 2/10 Low
- Air quality 1/10 Low 0 unhealthy d/yr today · 0 by 30 yrs out
Nearby sold comps map
Loading sold comps map…
Walkable amenities ~0.75 mi
Loading nearby amenities…
Taxation est. · year 1
- Rental income
- $23,191
- − Mortgage interest
- −$9,971
- − Property taxes
- −$2,670
- − Insurance
- −$890
- − Repairs & maintenance
- −$1,855
- − Management
- −$1,855
- − HOA
- −$48
- − Depreciation
- −$5,178
- Taxable income
- $724
- Est. tax owed @ 24.0%
- −$174
- After-tax cash flow
- $3,338/yr
For passive investors: Depreciation is non-cash, so a rental often shows a tax loss while cash-flowing — sheltering income. Rental losses are passive: they offset passive income freely, and up to $25,000/yr can offset ordinary (W-2) income if you actively participate and your MAGI is under $100k (phasing out to $0 by $150k); unused losses carry forward. On sale, claimed depreciation is recaptured at up to 25%, and gains may owe capital-gains tax (a 1031 exchange can defer both). Figures are a year-1 estimate at your 24.0% rate — not tax advice; consult a CPA.
Condition & rehab AI · 13 photos
This charming cabin in Indian Mountain is in good condition with a good condition score of 75. It has a good roof, exterior, and interior walls. The kitchen and living room could benefit from minor repairs and painting. The property has a good curb appeal and is ideal for both resale and rental due to its location and views.
Repairs flagged
- Minor kitchen cabinets — slight wear
- Minor living room carpet — some wear
Value-add opportunities
- Resale paint interior walls — fresh paint enhances curb appeal
- Resale update kitchen cabinets — new cabinets improve functionality and aesthetics
- Both landscaping — improved landscaping enhances curb appeal and outdoor living space
Renovation cost estimate screening
| Repair item | Severity | Est. cost |
|---|---|---|
| kitchen cabinets · slight wear | Minor | $500–3,000 |
| living room carpet · some wear | Minor | $500–3,000 |
| Total estimated repair cost · 2 items | $1,000–6,000 |
Value-add ROI direction
- Resale paint interior walls — fresh paint enhances curb appeal ↑
- Resale update kitchen cabinets — new cabinets improve functionality and aesthetics ↑
- Both landscaping — improved landscaping enhances curb appeal and outdoor living space ↑
ⓘ Cost ranges are severity-bucket heuristics (US national rule-of-thumb). Get contractor quotes + a written scope before underwriting a rehab budget.
Schools (NCES district)
- District
- Park County School District No. Re-2
- NCES district ID
- 0803840
- Math proficiency
- 25% ▲ 6.00%
- Reading proficiency
- 39% ▲ 2.00%
- Median HH income
- $51,367
- Composite
- 30.72/100
- National rank
- #11416
- State rank
- #89 of 176 in CO
Livability — Como
No livability data for this city. (Only ~50 U.S. cities are tracked.)
Census & demographics
- Population (ZIP)
- 309
Population outlook (Park County) Hauer SSP2
- Today (2025)
- 17,411 people
- By 2030
- 17,584 · +1.0%
- By 2040
- 17,261 · -0.9%
- By 2050
- 16,115 · -7.4%
- By 2075
- 14,174 · -18.6%
- By 2100
- 11,928 · -31.5%
Race, ethnicity, and origin ACS 2023
- Neighborhood character
- Predominantly White (70%)
- Race & ethnicity
- White 70% Asian 27% Black 4%
- Common ancestry
- Serbian 16% Romanian 13%
- Foreign-born
- 21% · Canada, Dominican Republic
- Languages at home
- 90% English-only · Other Indo-European 5% Tagalog/Filipino 5%
Political lean MEDSL · Park
- 2024 margin
- R (+16.5) · D 40.2% · R 56.7% · Other 3.1%
- 2008→2024 swing
- -9.6pp toward R · 2008: -6.9pp · 2024: -16.5pp
- All cycles
- 2024: R+16.5 2020: R+17.0 2016: R+26.4 2012: R+15.1 2008: R+6.9
Not yet ingested
- Civics
- —
Market trends
- HPI YoY
- ▼ -3.35%
- Current HPI
- 255.2617
- Rent YoY
- —
- Metro
- —
- State GDP YoY
- ▲ 1.95%
- F500 in state
- 14
Industry mix (Fortune 500 HQ in CO)
| Industry | F500 HQs | Revenue |
|---|---|---|
| Technology Distribution | 1 | $31B |
|
||
| Food / Agriculture | 1 | $18B |
|
||
| Packaging | 1 | $14B |
|
||
| Healthcare | 1 | $13B |
|
||
| Energy | 1 | $10B |
|
||
| Technology | 1 | $4B |
|
||
Price history
1 event — show timeline
- 2026-03-24 Listed $178,000 SAR
Cash-flow waterfall
monthlySold comps — $/sqft
last 12 mo · ≤1 miLoading sold comps…