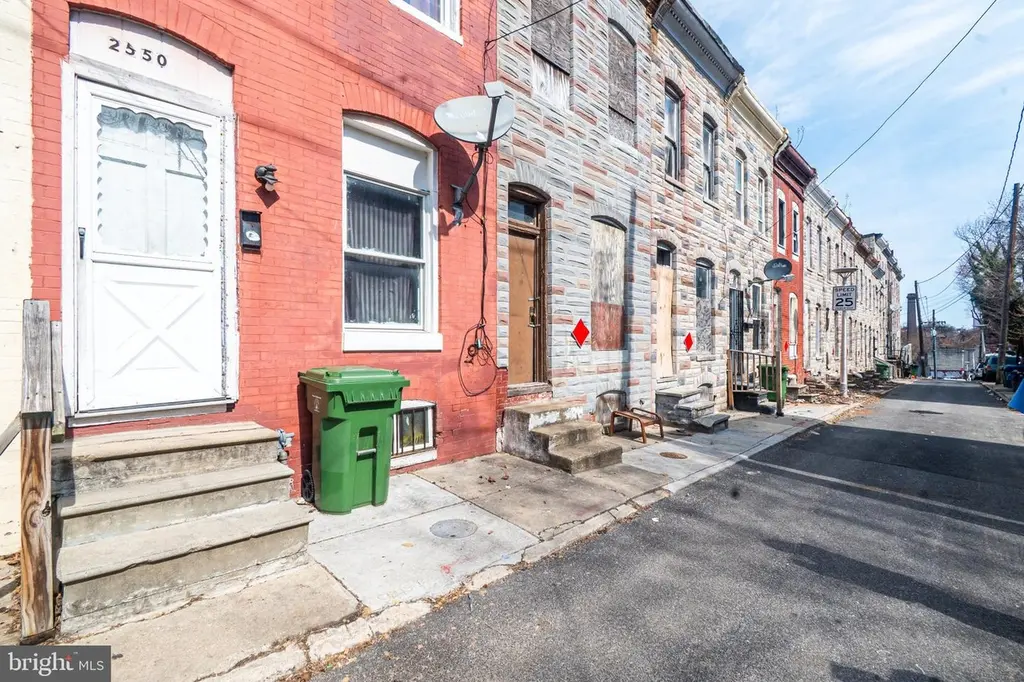
2550 Boyd St · Baltimore, MD
Flood risk 1/10 · Minimal
- FEMA flood zone
- X (unshaded)
- Chance of flooding over 30 yrs
- 0.0%
- Est. flood insurance / yr
- $473 – $860
Fire risk 1/10 · Minimal
- Est. fire insurance / yr
- $755 – $1,403
Heat risk 7/10 · Major
- Hot days now (above 103°F)
- 7 days/yr
- Hot days in 30 yrs
- 15 days/yr
Wind risk 6/10 · Moderate
- Chance of severe wind over 30 yrs
- 27.0%
Air-quality risk 3/10 · Minor
- Unhealthy air days now
- 3 days/yr
- Unhealthy air days in 30 yrs
- 4 days/yr
Risk factors via First Street. Map © Google.
Why this score? — see what drove the C+ grade
The composite is a weighted blend of 9 inputs, each scored 0–100. Each bar is that input's sub-score; the figure is the points it added to the 100-point composite (weight × sub-score).
- Cash flow +30.0/30.0
- 1% rule +10.0/10.0
- DSCR +10.0/10.0
- Rent growth +4.4/5.0
- Livability +3.8/5.0
- ARV discount +2.7/15.0
- Condition / age +2.5/5.0
- Schools +1.0/10.0
- Appreciation +0.0/10.0
$45,000
🖨 Deal sheet 📄 Offer letter ✓ Due diligence
Listing remarks MLS
Discover a hidden gem in the heart of Shipley Hill, where potential meets charm in this delightful 2-bedroom, 1-bathroom townhouse. Built in 1900, this brick beauty offers a unique opportunity for savvy investors looking to capitalize on a prime location with strong rental demand. The interior features a classic side-by-side design, providing a cozy atmosphere that invites creativity and personalization. With an unfinished basement, you have the perfect canvas to expand your living space or create additional rental income. Imagine transforming this area into a stylish entertainment zone or a functional workspace-endless possibilities await! The property boasts a low-maintenance exterior and on-street parking, making it an attractive option for future tenants. The surrounding Shipley Hill neighborhood is known for its vibrant community spirit and accessibility, ensuring a steady stream of potential renters. Investors will appreciate the potential for appreciation in this historic area, coupled with the opportunity to enhance the property's value through thoughtful renovations. With no association fees to worry about, your investment remains straightforward and profitable. This townhouse is not just a property; it's a chance to create a lasting legacy in a community that values both history and growth. Don't miss out on this opportunity to invest in a property that promises both comfort and financial returns. Schedule a viewing today and envision the possibilities!
Key facts
- No association fees
- Unfinished basement
- On street parking
Tags
Neighborhood map
What this means for you Summary
Snapshot
- This is a 2-bed/1.0-bath townhouse listed at $45k.
Deal economics
- At list price, monthly cash flow is $795 ($10k/yr) — positive.
- The deal already cash-flows at list — no discount required.
- Meets the 1% rule at list price ($1k rent vs $45k).
- Recommended offer: $42k (6.0% below list) — sets the bar for market timing.
- Cap rate 27.5% vs local median 6.0% in Baltimore — top-decile yield for the area; either an underpriced asset or a hidden risk that comps aren't pricing in. Stress-test before assuming the spread holds.
Location & tenants
- Location reads 76/100 on livability (#90 in MD, #3,396 nationally) — a middle-class / working-renter tenant base. Strengths: amenities A+, commute A+, housing A+; Watch: schools D, crime F.
- Baltimore City Public Schools (urban): math 7% / reading 16% proficiency, ranked #24 of 24 in MD (top 100%) — low school quality limits family demand, transient renter base, plan for 1-2y turnover; 79% free/reduced lunch — lower-income household profile, screen leases tightly.
- Market conditions: Rents rising fast (+7.5%/yr); 422 active listings in the ZIP; 8 comparable units currently listed for rent nearby; rentals lingering (median 44d on market — plan ~5-8 weeks vacancy on turnover, expect pricing pressure); 50% of comp listings sitting > 30 days — soft ceiling on asking rent; 1,273 units permitted in Baltimore city in 2024 (1,104 in 5+ unit buildings).
- This rent runs 37% of the median local income ($46k/yr) — at the standard rent-burdened threshold; future hikes will face affordability resistance.
Forward outlook
- Local home prices are declining (-3.0%/yr); year-one equity from $311 of loan paydown is wiped out by about $1k of value loss. Plan a longer hold.
- Baltimore County population projected to shrink 4% by 2050 — rents likely to lag national; underwrite the cash flow, not the appreciation.
- At projected returns (-3.0% appreciation + 7.5% rent growth), your $13k cash investment doubles in ~2 years — after that, you're playing with house money.
Negotiation context
- It's been on market 82 days — a 6% lower offer ($42k) is reasonable based on typical stale-listing flexibility.
- 6 sale attempts since 11y ago; this cycle's ask has dropped $3k (6%) from the opening price — seller is motivated, your offer sets the floor, not the list.
- Current owner paid $12k; list at $45k implies a 275% gain — meaningful room to come down on a strong offer.
Risks & watch-outs
- Watch-outs: built in 1900 — expect roof / HVAC / electrical / plumbing capex.
- Climate carrying-cost: major wind risk, 27% chance of damaging wind over 30y; extreme-heat days projected 7→15/yr by 2055 (HVAC capex compounding) — expect insurance premiums to compound above CPI over the hold.
Questions for the listing agent
- It's been on market 82 days. Have you received any prior offers? Is the seller open to a 6% concession, seller financing, or rate buy-down credit?
- Built in 1900 — when were the roof, HVAC, electrical panel, plumbing, and water heater last replaced?
- Why hasn't it sold? Are there any deal-killer items the seller is aware of (foundation, flood, title, zoning, code violations)?
- Is there a deadline driving the sale (1031 exchange, divorce, estate, relocation)? That informs how much negotiation room exists.
- Schools are D-rated, which usually means shorter tenancies and higher turnover. Who's the typical renter profile here, and what's been the actual vacancy rate?
- Crime grade is F in this area — have there been break-ins, vandalism, or insurance claims at this property in the last 3 years? What carrier currently insures it and at what premium?
- What's the average days-on-market for RENTAL listings here right now (not sales)? A rising rental-DOM trend means longer vacancies and softer asking-rent achievability than the comps imply.
- What's the recent tenant-quality profile in this submarket — average credit score on applications, eviction rate, late-payment / NSF rate, and stable-employment percentage? A property-management company in the area should have these aggregated.
- How much new for-sale + rental construction is in the pipeline within 1–3 miles? Heavy new supply typically softens prices + rents 12–24 months out; constrained supply supports both.
Investment metrics
- 1% rule
- 3.10% ✓
- Cap rate
- 27.48%
- Cash-on-cash
- 75.69%
- DSCR
- 4.37
- GRM
- 2.7
CMA / ARV
- ARV (median comp)
- $40,680
- List price
- $45,000
- Delta
- 10.62%
- Verdict
- OVERPRICED
- Comps
- 20 within 1.0 mi
Show comp detail 8 sales within ~0.75 mi
| Address | Dist | Beds/Ba | Sqft | Sold | Price | $/sf | Match |
|---|---|---|---|---|---|---|---|
| 525 S Catherine St | 0.47mi | 2/1.0 | 720 (-2%) | 11mo | $65,000 | $90 | 66 |
| 2629 Lehman St | 0.41mi | 2/1.0 | 768 (+5%) | 16mo | $38,500 | $50 | 59 |
| 1926 Wilhelm St | 0.56mi | 2/1.0 | 684 (-6%) | 7mo | $7,500 | $11 | 57 |
| 2629 Wilkens Ave | 0.54mi | 3/1.0 (+1) | 700 (-4%) | 11mo | $54,000 | $77 | 54 |
| 1812 Wilkens Ave | 0.71mi | 2/1.0 | 688 (-6%) | 11mo | $48,000 | $70 | 48 |
| 2225 Wilkens Ave | 0.54mi | 3/1.0 (+1) | 820 (+12%) | 13mo | $66,500 | $81 | 38 |
| 2411 Christian St | 0.47mi | 2/1.0 | 840 (+15%) | 20mo | $19,000 | $23 | 37 |
| 3232 Lohrs Ln | 0.75mi | 2/1.5 | 840 (+15%) | 22mo | $4,500 | $5 | 20 |
Match score weights: distance 35% · size 25% · config 20% · recency 20%. Top-matched comps best support the ARV.
Projected returns pro-forma
-3.0% appreciation · 7.51% rent growth · sell at horizon
- IRR
- 80.7%
- Equity multiple
- 4.97×
- Total profit
- $49,965
- Equity at exit
- $6,710
- IRR
- 85.2%
- Equity multiple
- 12.00×
- Total profit
- $138,597
- Equity at exit
- $3,891
Cash invested: $12,600 (down + closing). Projections, not guarantees.
Landlord ↔ Tenant lean methodology
- Overall (CITY)
- 12 Strongly Tenant-Friendly
- State Maryland
- 27 Tenant-Leaning · D+14
- County
- — inherits STATE
- City Baltimore
- 12 Strongly Tenant-Friendly · D+58
ZIP-level market 21223
- Rents YoY
- 7.5%
- Active inventory
- 422
- Price-to-rent
- 2.7×
Monthly cashflow live
- Estimated rent
- $1,396 high interval (Pro) →
- Mortgage (P&I)
- −$236
- Tax from tax record
- −$53 /mo · $642/yr
- Insurance
- −$19
- HOA
- −$0
- Vacancy / Maint / Mgmt
- −$293
- Net cashflow
- $795
Break-even live
UW: 25.0% down · 7.5% · 30yr · 1.5% tax · 5.0% vac · 8.0% maint · 8.0% mgmt
Financing live
Cash to close
- Down payment
- $11,250
- Closing costs
- $1,350
- Reserves months
- —
- Total cash needed
- —
Loan-product check · same deal, 3 products live
Conventional
25% down · 7.5% · 30yr
- Down + closing
- —
- Monthly P&I
- —
- Monthly cashflow
- —
- DSCR
- —
- Eligible?
- —
Personal DTI + credit; lowest rate.
DSCR
20% down · 8.5% · 30yr
- Down + closing
- —
- Monthly P&I
- —
- Monthly cashflow
- —
- DSCR
- —
- Eligible?
- —
No personal income docs; deal must DSCR.
Hard money
10% down · 12.0% · 12mo
- Down + closing
- —
- Monthly P&I
- —
- Monthly cashflow
- —
- DSCR
- —
- Eligible?
- —
Short-term bridge; refi at stabilization.
Rent comps 8 comps
| Address | Beds | Baths | Sqft | Rent | $/sqft | DOM | Units | Dist |
|---|---|---|---|---|---|---|---|---|
| 1712 W Lombard St #4 Baltimore, MD | 1.0 | 1.0 | 550 | $900 | $1.64 | 43d | 1 | 0.74mi |
| 28 N Norris St Baltimore, MD | 1.0 | 2.0 | 700 | $1,450 | $2.07 | 43d | 1 | 0.97mi |
| 48 S Carrollton Ave Unit 4 Baltimore, MD | 2.0 | 1.0 | 670 | $1,600 | $2.39 | 43d | 1 | 1.14mi |
| 600 Linnard St Baltimore, MD | 1.0 | 1.0 | 600 | $1,300 | $2.17 | 43d | 1 | 1.16mi |
| 3706 W Franklin St Unit 1 Baltimore, MD | 2.0 | 1.0 | 735 | $1,100 | $1.50 | 4d | 1 | 1.22mi |
| 1339 W Lafayette Ave #1 Baltimore, MD | 2.0 | 2.0 | 700 | $1,600 | $2.29 | 12d | 1 | 1.32mi |
| 101 N Schroeder St Baltimore, MD | 3.0 | 1.0–2.0 | 1037 | $2,481 | $2.39 | 2d | 12 | 1.35mi |
| 709 N Carrollton Ave Unit 1A Baltimore, MD | 1.0 | 1.0 | 500 | $800 | $1.60 | 16d | 1 | 1.36mi |
Listing history 34 events
-
2026-06-18days on market $45,000 Active 82 DOM
-
2026-06-17days on market $45,000 Active 81 DOM
-
2026-06-16days on market $45,000 Active 80 DOM
-
2026-06-15days on market $45,000 Active 79 DOM
-
2026-06-13days on market $45,000 Active 77 DOM
-
2026-06-09days on market $45,000 Active 73 DOM
-
2026-06-08days on market $45,000 Active 72 DOM
-
2026-06-07days on market $45,000 Active 71 DOM
-
2026-06-04days on market $45,000 Active 68 DOM
-
2026-06-03days on market $45,000 Active 67 DOM
-
2026-06-02days on market $45,000 Active 66 DOM
-
2026-06-01days on market $45,000 Active 65 DOM
-
2026-05-31days on market $45,000 Active 64 DOM
-
2026-04-25price $45,000 1487-char remark
Show marketing remark (1487 chars)
Discover a hidden gem in the heart of Shipley Hill, where potential meets charm in this delightful 2-bedroom, 1-bathroom townhouse. Built in 1900, this brick beauty offers a unique opportunity for savvy investors looking to capitalize on a prime location with strong rental demand. The interior features a classic side-by-side design, providing a cozy atmosphere that invites creativity and personalization. With an unfinished basement, you have the perfect canvas to expand your living space or create additional rental income. Imagine transforming this area into a stylish entertainment zone or a functional workspace-endless possibilities await! The property boasts a low-maintenance exterior and on-street parking, making it an attractive option for future tenants. The surrounding Shipley Hill neighborhood is known for its vibrant community spirit and accessibility, ensuring a steady stream of potential renters. Investors will appreciate the potential for appreciation in this historic area, coupled with the opportunity to enhance the property's value through thoughtful renovations. With no association fees to worry about, your investment remains straightforward and profitable. This townhouse is not just a property; it's a chance to create a lasting legacy in a community that values both history and growth. Don't miss out on this opportunity to invest in a property that promises both comfort and financial returns. Schedule a viewing today and envision the possibilities!
-
2026-03-28$48,000 Active 1487-char remark
Show marketing remark (1487 chars)
Discover a hidden gem in the heart of Shipley Hill, where potential meets charm in this delightful 2-bedroom, 1-bathroom townhouse. Built in 1900, this brick beauty offers a unique opportunity for savvy investors looking to capitalize on a prime location with strong rental demand. The interior features a classic side-by-side design, providing a cozy atmosphere that invites creativity and personalization. With an unfinished basement, you have the perfect canvas to expand your living space or create additional rental income. Imagine transforming this area into a stylish entertainment zone or a functional workspace-endless possibilities await! The property boasts a low-maintenance exterior and on-street parking, making it an attractive option for future tenants. The surrounding Shipley Hill neighborhood is known for its vibrant community spirit and accessibility, ensuring a steady stream of potential renters. Investors will appreciate the potential for appreciation in this historic area, coupled with the opportunity to enhance the property's value through thoughtful renovations. With no association fees to worry about, your investment remains straightforward and profitable. This townhouse is not just a property; it's a chance to create a lasting legacy in a community that values both history and growth. Don't miss out on this opportunity to invest in a property that promises both comfort and financial returns. Schedule a viewing today and envision the possibilities!
-
2026-02-16historical
-
2025-12-19price $53,000
-
2025-10-18$60,000 Active
-
2025-08-18historical
-
2025-04-30$59,900 Active
-
2024-02-19historical
-
2024-01-20historical $1,050
-
2023-11-25price $55,000
-
2023-11-13price $58,000
-
2023-10-08$1,050
-
2023-09-22$60,000 Active
-
2015-08-27soldstatus $12,000
-
2015-08-27soldstatus $12,000 Sold
-
2015-08-09status Contract
-
2015-06-26$12,900 Active
-
2006-07-20soldstatus $406
-
1995-07-18soldstatus $15,000
-
1995-07-18soldstatus $15,000
-
1994-08-19soldstatus $22,100
ⓘ Source: listings_history table (triggers on properties + properties_extension) + one-shot
backfill from property_details.listing_events for pre-trigger history.
Tax reassessment forecast MD · Partial reset (capped growth)
- Current annual tax
- $642 · $53/mo
- Projected year-2 tax
- $642 · $53/mo
- Expected delta
- $0/yr ($0/mo · 0.0%)
ⓘ Screening estimate from a state-policy table — verify with the county assessor before closing.
Climate risk First Street
- Flood 1/10 Low FEMA zone X (unshaded) · 0% chance over 30 yrs
- Wildfire 1/10 Low
- Heat 7/10 Severe 7 d/yr ≥103°F today · 15 d/yr by 30 yrs out
- Wind 6/10 Major 27% chance of damaging wind over 30 yrs
- Air quality 3/10 Moderate 3 unhealthy d/yr today · 4 by 30 yrs out
Nearby sold comps map
Loading sold comps map…
Walkable amenities ~0.75 mi
Loading nearby amenities…
Taxation est. · year 1
- Rental income
- $16,753
- − Mortgage interest
- −$2,521
- − Property taxes
- −$642
- − Insurance
- −$225
- − Repairs & maintenance
- −$1,340
- − Management
- −$1,340
- − Depreciation
- −$1,309
- Taxable income
- $9,376
- Est. tax owed @ 24.0%
- −$2,250
- After-tax cash flow
- $7,286/yr
For passive investors: Depreciation is non-cash, so a rental often shows a tax loss while cash-flowing — sheltering income. Rental losses are passive: they offset passive income freely, and up to $25,000/yr can offset ordinary (W-2) income if you actively participate and your MAGI is under $100k (phasing out to $0 by $150k); unused losses carry forward. On sale, claimed depreciation is recaptured at up to 25%, and gains may owe capital-gains tax (a 1031 exchange can defer both). Figures are a year-1 estimate at your 24.0% rate — not tax advice; consult a CPA.
Schools (NCES district)
- District
- Baltimore City Public Schools
- NCES district ID
- 2400090
- Math proficiency
- 7% ▼ -9.00%
- Reading proficiency
- 16% ▼ -5.00%
- Median HH income
- $42,108
- Composite
- 10.08/100
- National rank
- #9805
- State rank
- #24 of 24 in MD
Livability — Baltimore
- Score
- 76/100
- State rank
- #90
- US rank
- #3396
Category grades
Schools grade is shown separately in the Schools card above.
Census & demographics
- Census place
- Baltimore, MD
- County
- Baltimore City · 558,601 people
- City population
- 588,727
- Metro
- Baltimore-Columbia-Towson, MD
- Population (ZIP)
- 19,572
- Household income
- $45,840
- Rent vs Own
- Severe rent burden
- 1755.0
Population outlook (Baltimore County) Hauer SSP2
- Today (2025)
- 624,249 people
- By 2030
- 621,541 · -0.4%
- By 2040
- 609,756 · -2.3%
- By 2050
- 597,249 · -4.3%
- By 2075
- 552,236 · -11.5%
- By 2100
- 513,934 · -17.7%
Race, ethnicity, and origin ACS 2023
- Neighborhood character
- Predominantly Black (72%)
- Race & ethnicity
- Black 72% White 16% Hispanic / Latino 7% Two or more races 6% Asian 1%
- Hispanic origin (detail)
- Mexican 3% Puerto Rican 1%
- Common ancestry
- Romanian 1%
- Foreign-born
- 8% · Canada
- Languages at home
- 90% English-only · Spanish 6% French/Haitian/Cajun 2% Other Indo-European 1%
Political lean MEDSL · Baltimore
- 2024 margin
- Solid D (+73.0) · D 85.2% · R 12.2% · Other 2.6%
- 2008→2024 swing
- -2.5pp toward R · 2008: 75.5pp · 2024: 73.0pp
- All cycles
- 2024: D+73.0 2020: D+76.6 2016: D+74.6 2012: D+76.4 2008: D+75.5
Not yet ingested
- Civics
- —
Market trends
- HPI YoY
- ▼ -97.99%
- Current HPI
- 140.5836
- Rent YoY
- ▲ 7.51%
- Metro
- Baltimore-Columbia-Towson, MD
- State GDP YoY
- ▲ 2.97%
- F500 in state
- 12
Industry mix (Fortune 500 HQ in MD)
| Industry | F500 HQs | Revenue |
|---|---|---|
| Aerospace / Defense | 1 | $71B |
|
||
| Utilities | 1 | $25B |
|
||
| Hotels | 1 | $24B |
|
||
| Consumer Goods | 1 | $7B |
|
||
| Real Estate | 1 | $6B |
|
||
| Chemicals | 1 | $2B |
|
||
Price history
+103.6% since first listed21 events — show timeline
- 2026-04-25 Price Changed $45,000 BRIGHT MLS
- 2026-03-28 Listed $48,000 BRIGHT MLS
- 2026-02-16 Listing Removed — BRIGHT MLS
- 2025-12-19 Price Changed $53,000 BRIGHT MLS
- 2025-10-18 Listed $60,000 BRIGHT MLS
- 2025-08-18 Listing Removed — BRIGHT MLS
- 2025-04-30 Listed $59,900 BRIGHT MLS
- 2024-02-19 Listing Removed — BRIGHT MLS
- 2024-01-20 Rental Removed $1,050 APPFOLIO
- 2023-11-25 Price Changed $55,000 BRIGHT MLS
- 2023-11-13 Price Changed $58,000 BRIGHT MLS
- 2023-10-08 Listed for Rent $1,050 APPFOLIO
- 2023-09-22 Listed $60,000 BRIGHT MLS
- 2015-08-27 Sold (MLS) $12,000 MRIS
- 2015-08-27 Sold (MLS) $12,000 BRIGHT MLS
- 2015-08-09 Pending — MRIS
- 2015-06-26 Listed $12,900 MRIS
- 2006-07-20 Sold (Public Records) $406 Public Records
- 1995-07-18 Sold (Public Records) $15,000 Public Records
- 1995-07-18 Sold (Public Records) $15,000 Public Records
- 1994-08-19 Sold (Public Records) $22,100 Public Records
Property tax history
+5.5%/yrLatest (2025): $642 · +6.5% YoY. Source: county tax records.
Cash-flow waterfall
monthlySold comps — $/sqft
last 12 mo · ≤1 miLoading sold comps…