 🏗️ New Construction
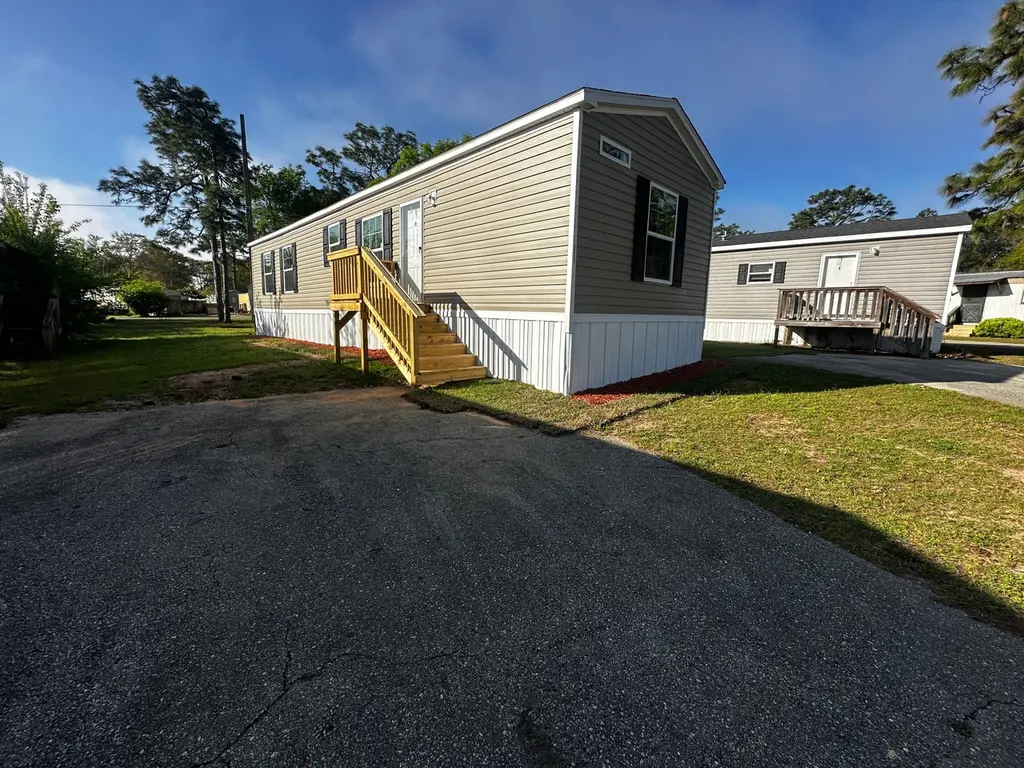
Fleetwood Home 311 Plan · Tallahassee, FL
Flood risk No data
- FEMA flood zone
- —
- Chance of flooding over 30 yrs
- —
- Est. flood insurance / yr
- —
Fire risk No data
- Est. fire insurance / yr
- —
Heat risk No data
- Hot days now (above threshold)
- —
- Hot days in 30 yrs
- —
Wind risk No data
- Chance of severe wind over 30 yrs
- —
Air-quality risk No data
- Unhealthy air days now
- —
- Unhealthy air days in 30 yrs
- —
Risk factors via First Street. Map © Google.
Why this score? — see what drove the C grade
The composite is a weighted blend of 9 inputs, each scored 0–100. Each bar is that input's sub-score; the figure is the points it added to the 100-point composite (weight × sub-score).
- Cash flow +20.4/30.0
- ARV discount +7.5/15.0
- DSCR +6.5/10.0
- 1% rule +5.4/10.0
- Appreciation +4.7/10.0
- Schools +4.3/10.0
- Livability +4.3/5.0
- Condition / age +4.0/5.0
- Rent growth +2.5/5.0
$55,000
🖨 Deal sheet (PDF) 📄 Offer letter ✓ Due diligence
Listing remarks
Designated 2 car parking next to your home.
Key facts
- 2 parking spots
- Listed 21 days
Property features AI
Finance
- Other: Address listed as: Fleetwood Home 311 Plan, Brz8d7 Tallahassee, FL 32310
- Financial info: Listed price: $55,000
Exterior
- Parking: 2 parking spaces
- Utilities: Electric heating; Central air conditioning
- Home design: Plan: Fleetwood Home 311; New construction plan
Interior
- Bedrooms: 2 bedrooms
- Bathrooms: 2 bathrooms
- Heating & cooling: Electric heating; Central air conditioning
- Interior features: Open living area (896 living area)
Neighborhood map
What this means for you Summary
Snapshot
- This is a 2-bed/2.0-bath single-family listed at $55k. Condition is rated good.
Deal economics
- At list price, monthly cash flow is $148 ($2k/yr) — positive.
- The deal already cash-flows at list — no discount required.
- Meets the 1% rule at list price ($1k rent vs $55k).
- Recommended offer: $54k (1.5% below list) — sets the bar for market timing.
- Cap rate 7.8% vs local median 4.2% in Tallahassee — top-decile yield for the area; either an underpriced asset or a hidden risk that comps aren't pricing in. Stress-test before assuming the spread holds.
Location & tenants
- Location reads 86/100 on livability (#19 in FL, #429 nationally) — a professional / high-income tenant draw. Strengths: amenities A+, commute A+, health & safety A+; Watch: employment D.
- Leon (urban): math 48% / reading 53% proficiency, ranked #33 of 73 in FL (top 45%) — acceptable for families but not a draw, mixed tenant base, ~2y average lease.
- Zoned schools: Pineview Elementary School (math 32% / reading 32%, grade F, #1,797 of 2,144 statewide, top 86%, 362 students, 83% FRL); R. Frank Nims Middle School (math 20% / reading 24%, grade F, #549 of 571 statewide, top 97%, 609 students, 82% FRL); James Rickards High School (math 23% / reading 37%, grade F, #441 of 667 statewide, top 67%, 1,581 students, 57% FRL) — zoned schools average 74% FRL vs 45% district-wide (29 pts higher); higher-poverty schools than district average — tighter screening recommended.
- Zoned-school proficiency averages 28% at this address vs 50% district-wide (-22 pts) — the specific schools serving this property underperform the Leon average; the district grade overstates school quality for this exact location.
- Market conditions: 94 active listings in the ZIP; 1 comparable units currently listed for rent nearby; lower-income renter base — watch delinquency; 1,765 units permitted in Leon County in 2024 (975 in 5+ unit buildings).
- This rent runs 37% of the median local income ($38k/yr) — at the standard rent-burdened threshold; future hikes will face affordability resistance.
Forward outlook
- In year one you build about $172 of equity ($793 loan paydown + $-621 appreciation (-0.5% local appreciation)).
- Leon County population projected at +23% by 2050 — long-run rental-demand tailwind backs the buy-and-hold thesis.
- At projected returns (-0.5% appreciation + 3.0% rent growth), your $32k cash investment doubles in ~10 years — after that, you're playing with house money.
Negotiation context
- It's been on market 21 days — a 2% lower offer ($54k) is reasonable based on typical stale-listing flexibility.
Risks & watch-outs
- Watch-outs: property tax is 3.1% of price.
Questions for the listing agent
- Property tax is high relative to price — has the assessment been appealed recently, and will the sale trigger a re-assessment?
- Is there a deadline driving the sale (1031 exchange, divorce, estate, relocation)? That informs how much negotiation room exists.
- Schools are B-rated — typically a magnet for longer-tenancy family renters. What's the average tenant stay here, and is there a school-zone premium baked into asking?
- What's the average days-on-market for RENTAL listings here right now (not sales)? A rising rental-DOM trend means longer vacancies and softer asking-rent achievability than the comps imply.
- What's the recent tenant-quality profile in this submarket — average credit score on applications, eviction rate, late-payment / NSF rate, and stable-employment percentage? A property-management company in the area should have these aggregated.
- How much new for-sale + rental construction is in the pipeline within 1–3 miles? Heavy new supply typically softens prices + rents 12–24 months out; constrained supply supports both.
Investment metrics
- 1% rule
- 1.04% ✓
- Cap rate
- 7.84%
- Cash-on-cash
- 5.53%
- DSCR
- 1.25
- GRM
- 8.0
CMA / ARV
- ARV (on-the-fly)
- $114,688
- Comps found
- 1
Show comp detail 1 sale within ~0.75 mi
| Address | Dist | Beds/Ba | Sqft | Sold | Price | $/sf | Match |
|---|---|---|---|---|---|---|---|
| 3345 Lakeview Dr | 0.52mi | 2/2.0 | 976 (+9%) | 18mo | $125,000 | $128 | 46 |
Match score weights: distance 35% · size 25% · config 20% · recency 20%. Top-matched comps best support the ARV.
Projected returns pro-forma
-0.54% appreciation · 3.0% rent growth · sell at horizon
- IRR
- 2.2%
- Equity multiple
- 1.10×
- Total profit
- $3,205
- Equity at exit
- $30,232
- IRR
- 8.2%
- Equity multiple
- 1.84×
- Total profit
- $26,868
- Equity at exit
- $33,973
Cash invested: $32,113 (down + closing). Projections, not guarantees.
Landlord ↔ Tenant lean methodology
- Overall (STATE)
- 87 Strongly Landlord-Friendly
- State Florida
- 87 Strongly Landlord-Friendly · R+3
- County
- — inherits STATE
- City
- — inherits STATE
ZIP-level market 32310
- Home prices YoY
- -0.2%
- Active inventory
- 94
- Price-to-rent
- 3.8×
Monthly cashflow live
- Estimated rent
- $1,191 medium interval (Pro) →
- Mortgage (P&I)
- −$601
- Tax est. 1.5%
- −$143 /mo · $1,720/yr
- Insurance
- −$48
- HOA
- −$0
- Lot rent
- −$0
- Vacancy / Maint / Mgmt
- −$250
- Net cashflow
- $148
Break-even live
Sensitivity live
| Price | -10% $227 | -5% $188 | +0% $148 | +5% $108 | +10% $69 |
|---|---|---|---|---|---|
| Rent | -10% $54 | -5% $101 | +0% $148 | +5% $195 | +10% $242 |
| Rate | -1.0pp $206 | -0.5pp $177 | base $148 | +0.5pp $118 | +1.0pp $88 |
UW: 25.0% down · 7.5% · 30yr · 1.5% tax · 5.0% vac · 8.0% maint · 8.0% mgmt
Financing live
Cash to close
- Down payment
- $28,672
- Closing costs
- $3,441
- Reserves months
- —
- Total cash needed
- —
Loan-product check · same deal, 3 products live
Conventional
25% down · 7.5% · 30yr
- Down + closing
- —
- Monthly P&I
- —
- Monthly cashflow
- —
- DSCR
- —
- Eligible?
- —
Personal DTI + credit; lowest rate.
DSCR
20% down · 8.5% · 30yr
- Down + closing
- —
- Monthly P&I
- —
- Monthly cashflow
- —
- DSCR
- —
- Eligible?
- —
No personal income docs; deal must DSCR.
Hard money
10% down · 12.0% · 12mo
- Down + closing
- —
- Monthly P&I
- —
- Monthly cashflow
- —
- DSCR
- —
- Eligible?
- —
Short-term bridge; refi at stabilization.
Rent comps 1 comps
| Address | Beds | Baths | Sqft | Rent | $/sqft | DOM | Units | Dist |
|---|---|---|---|---|---|---|---|---|
| 3178 N Ridge Rd Apt A Tallahassee, FL | 2.0 | 2.0 | 995 | $1,350 | $1.36 | 16d | 1 | 1.29mi |
Listing history 16 events
-
2026-06-22days on market $55,000 Active 21 DOM
-
2026-06-18days on market $55,000 Active 18 DOM
-
2026-06-17days on market $55,000 Active 17 DOM
-
2026-06-16days on market $55,000 Active 16 DOM
-
2026-06-15days on market $55,000 Active 15 DOM
-
2026-06-14days on market $55,000 Active 13 DOM
-
2026-06-10days on market $55,000 Active 10 DOM
-
2026-06-09days on market $55,000 Active 9 DOM
-
2026-06-08days on market $55,000 Active 8 DOM
-
2026-06-07days on market $55,000 Active 7 DOM
-
2026-06-05days on market $55,000 Active 4 DOM
-
2026-06-03days on market $55,000 Active 3 DOM
-
2026-06-02days on market $55,000 Active 2 DOM
-
2026-06-01days on market $55,000 Active 1 DOM
-
2026-05-31days on market $55,000 Active 11 DOM
-
2026-05-30days on market $55,000 Active 10 DOM
ⓘ Source: listings_history table (triggers on properties + properties_extension) + one-shot
backfill from property_details.listing_events for pre-trigger history.
Nearby sold comps map
Loading sold comps map…
Walkable amenities ~0.75 mi
Loading nearby amenities…
Taxation est. · year 1
- Rental income
- $14,288
- − Mortgage interest
- −$6,424
- − Property taxes
- −$1,720
- − Insurance
- −$573
- − Repairs & maintenance
- −$1,143
- − Management
- −$1,143
- − Depreciation
- −$3,336
- Taxable loss
- −$53
- Est. tax savings @ 24.0%
- +$13
- After-tax cash flow
- $1,789/yr
For passive investors: Depreciation is non-cash, so a rental often shows a tax loss while cash-flowing — sheltering income. Rental losses are passive: they offset passive income freely, and up to $25,000/yr can offset ordinary (W-2) income if you actively participate and your MAGI is under $100k (phasing out to $0 by $150k); unused losses carry forward. On sale, claimed depreciation is recaptured at up to 25%, and gains may owe capital-gains tax (a 1031 exchange can defer both). Figures are a year-1 estimate at your 24.0% rate — not tax advice; consult a CPA.
Condition & rehab AI · 11 photos
This home is in excellent condition with modern updates and a move-in-ready appearance. It offers a good balance of curb appeal and interior upgrades, making it an attractive option for both resale and rental markets.
Value-add opportunities
- Both Painting exterior and interior walls — Fresh paint enhances curb appeal and interior aesthetics
- Both Landscaping improvements — Enhances curb appeal and adds value
- Both Add a small outdoor seating area — Improves outdoor living space and adds value
Renovation cost estimate screening
Value-add ROI direction
- Both Painting exterior and interior walls — Fresh paint enhances curb appeal and interior aesthetics ↑
- Both Landscaping improvements — Enhances curb appeal and adds value ↑
- Both Add a small outdoor seating area — Improves outdoor living space and adds value ↑
ⓘ Cost ranges are severity-bucket heuristics (US national rule-of-thumb). Get contractor quotes + a written scope before underwriting a rehab budget.
Schools (NCES district)
- District
- Leon
- NCES district ID
- 1201110
- Math proficiency
- 48% ▼ -13.00%
- Reading proficiency
- 53% ▼ -5.00%
- Median HH income
- $46,339
- Composite
- 42.84/100
- National rank
- #3131
- State rank
- #33 of 73 in FL
Livability — Tallahassee
- Score
- 86/100
- State rank
- #19
- US rank
- #429
Category grades
Schools grade is shown separately in the Schools card above.
Census & demographics
- County
- Leon County · 294,472 people
- City population
- 294,472
- Metro
- Tallahassee, FL
- Population (ZIP)
- 14,888
- Household income
- $38,288
- Rent vs Own
- Severe rent burden
- 1272.0
Population outlook (Leon County) Hauer SSP2
- Today (2025)
- 315,507 people
- By 2030
- 330,677 · +4.8%
- By 2040
- 358,465 · +13.6%
- By 2050
- 386,804 · +22.6%
- By 2075
- 465,480 · +47.5%
- By 2100
- 519,959 · +64.8%
Race, ethnicity, and origin ACS 2023
- Neighborhood character
- Diverse neighborhood (Simpson 0.61)
- Race & ethnicity
- Black 50% White 36% Hispanic / Latino 9% Two or more races 5%
- Hispanic origin (detail)
- Mexican 3%
- Common ancestry
- Italian 1% Lithuanian 1% Slovak 1%
- Foreign-born
- 4% · Canada
- Languages at home
- 92% English-only · Spanish 6% French/Haitian/Cajun 1% German/W. Germanic 1%
Political lean MEDSL · Leon
- 2024 margin
- Strong D (+21.8) · D 60.3% · R 38.5% · Other 1.2%
- 2008→2024 swing
- -2.5pp toward R · 2008: 24.3pp · 2024: 21.8pp
- All cycles
- 2024: D+21.8 2020: D+28.3 2016: D+25.1 2012: D+23.6 2008: D+24.3
Not yet ingested
- Civics
- —
Market trends
- HPI YoY
- ▼ -0.54%
- Current HPI
- 270.5721
- Rent YoY
- —
- Metro
- Tallahassee, FL
- State GDP YoY
- ▲ 3.28%
- F500 in state
- 36
Industry mix (Fortune 500 HQ in FL)
| Industry | F500 HQs | Revenue |
|---|---|---|
| Industrial Technology | 2 | $29B |
|
||
| Insurance | 2 | $17B |
|
||
| Retail | 1 | $60B |
|
||
| Technology Distribution | 1 | $58B |
|
||
| Homebuilding | 1 | $35B |
|
||
| Technology Manufacturing | 1 | $35B |
|
||
Cash-flow waterfall
monthlySold comps — $/sqft
last 12 mo · ≤1 miLoading sold comps…