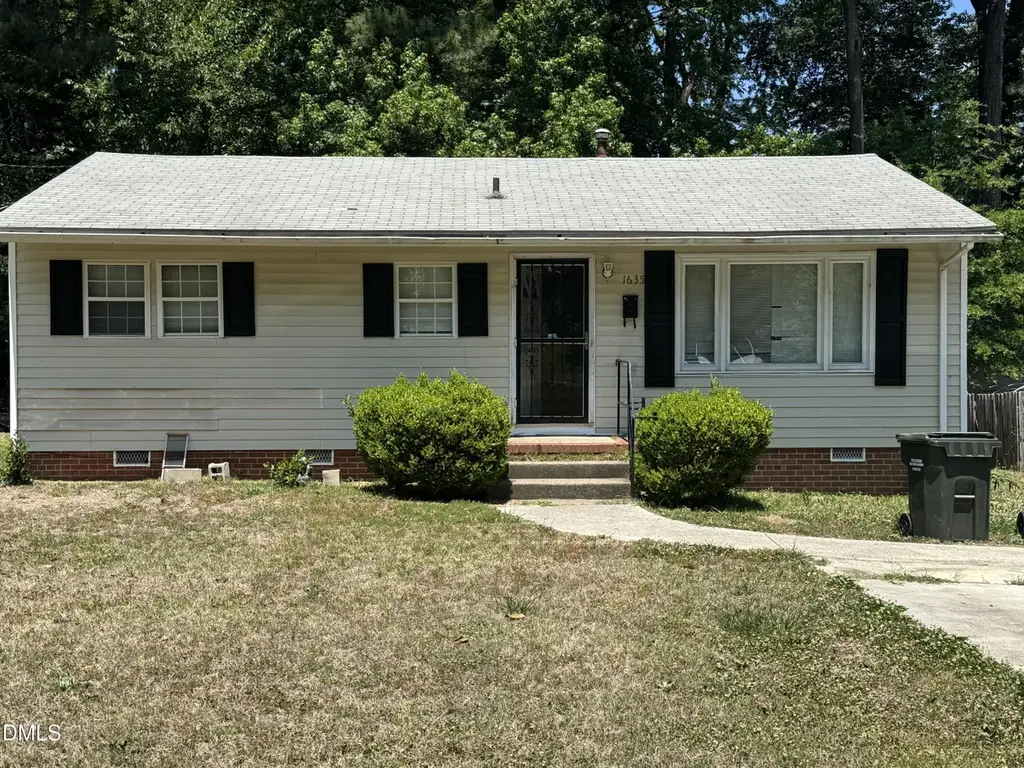
1635 Greenbriar Rd · Durham, NC
Flood risk 1/10 · Minimal
- FEMA flood zone
- X (unshaded)
- Chance of flooding over 30 yrs
- 0.0%
- Est. flood insurance / yr
- $507 – $1,088
Fire risk 1/10 · Minimal
- Est. fire insurance / yr
- $906 – $1,684
Heat risk 6/10 · Moderate
- Hot days now (above 106°F)
- 7 days/yr
- Hot days in 30 yrs
- 16 days/yr
Wind risk 6/10 · Moderate
- Chance of severe wind over 30 yrs
- 27.0%
Air-quality risk 2/10 · Minimal
- Unhealthy air days now
- 1 days/yr
- Unhealthy air days in 30 yrs
- 1 days/yr
Risk factors via First Street. Map © Google.
Why this score? — see what drove the C- grade
The composite is a weighted blend of 9 inputs, each scored 0–100. Each bar is that input's sub-score; the figure is the points it added to the 100-point composite (weight × sub-score).
- ARV discount +15.0/15.0
- Cash flow +14.7/30.0
- DSCR +4.5/10.0
- Livability +4.0/5.0
- 1% rule +3.9/10.0
- Rent growth +3.3/5.0
- Schools +3.0/10.0
- Condition / age +2.5/5.0
- Appreciation +0.0/10.0
$190,000
🖨 Deal sheet (PDF) 📄 Offer letter ✓ Due diligence
Listing remarks
Excellent opportunity in a convenient Durham location. This 3-bedroom, 1-bath home has been used as a rental for several years and is ready for its next chapter. The property is in need of updating, making it a strong option for an investor, renovation buyer, or owner-occupant looking to add value over time. The home offers a practical single-level layout and is located near Downtown Durham, Duke University, Duke Hospital, RTP, shopping, dining, and everyday conveniences. With easy access to major routes including NC-147/Durham Freeway, I-885, I-85, and US-70, commuting throughout Durham and the greater Triangle area is convenient. This property is being offered with renovation potential an
Key facts
- Near duke university
- Near shopping
- Near duke hospital
Tags
Property features AI
Finance
- Other: Zoned R-5
- HOA & community: No homeowners association
Exterior
- Utilities: Public water; Public sewer
- Home design: Site-built single-story home; One level
- Construction: Vinyl siding construction; Site built
- Exterior features: Shingle roof; Lot roughly 0.24 acres (publicly maintained road access)
Interior
- Bedrooms: 3 bedrooms (all on the main level)
- Flooring: Vinyl flooring; Wood flooring
- Bathrooms: 1 full bathroom
- Heating & cooling: Forced air heating; Central air conditioning
- Interior features: Vinyl and wood flooring
Neighborhood map
What this means for you Summary
Snapshot
- This is a 3-bed/1.0-bath single-family listed at $190k.
Deal economics
- At list price, monthly cash flow is $50 ($604/yr) — positive.
- The deal already cash-flows at list — no discount required.
- To meet the 1% rule (rent ≥ 1% of price), the offer needs to be $168k (11.4% below list).
- Recommended offer: $168k (11.4% below list) — sets the bar for 1% rule.
- Cap rate 6.6% vs local median 3.0% in Durham — top-decile yield for the area; either an underpriced asset or a hidden risk that comps aren't pricing in. Stress-test before assuming the spread holds.
Location & tenants
- Location reads 81/100 on livability (#15 in NC, #1,411 nationally) — a professional / high-income tenant draw. Strengths: amenities A+, commute A+, housing A+; Watch: crime F.
- Durham Public Schools (urban): math 29% / reading 39% proficiency, ranked #132 of 178 in NC (top 74%) — families likely to look elsewhere, expect single-tenant / working-renter base with shorter leases.
- Zoned schools: Holt Elementary (math 10% / reading 26%, grade F, #1,280 of 1,410 statewide, top 91%, 636 students, 83% FRL); Lucas Middle (math 17% / reading 27%, grade F, #416 of 475 statewide, top 89%, 371 students, 70% FRL); Northern High (math 30% / reading 35%, grade F, #441 of 535 statewide, top 83%, 1,308 students, 64% FRL).
- Market conditions: Rents rising (+3.2%/yr); 198 active listings in the ZIP; 23 comparable units currently listed for rent nearby; rentals at typical pace (median 23d on market — plan ~3-4 weeks tenant-placement turnaround); 2,905 units permitted in Durham County in 2024 (955 in 5+ unit buildings).
Forward outlook
- Local home prices are declining (-3.0%/yr); year-one equity from $1k of loan paydown is wiped out by about $6k of value loss. Plan a longer hold.
- Durham County population projected at +44% by 2050 — long-run rental-demand tailwind backs the buy-and-hold thesis.
Negotiation context
- It's been on market 23 days — a 2% lower offer ($187k) is reasonable based on typical stale-listing flexibility.
Risks & watch-outs
- Watch-outs: built in 1958 — expect roof / HVAC / electrical / plumbing capex.
- Climate carrying-cost: major wind risk, 27% chance of damaging wind over 30y; extreme-heat days projected 7→16/yr by 2055 (HVAC capex compounding) — expect insurance premiums to compound above CPI over the hold.
Questions for the listing agent
- Built in 1958 — when were the roof, HVAC, electrical panel, plumbing, and water heater last replaced?
- Is there a deadline driving the sale (1031 exchange, divorce, estate, relocation)? That informs how much negotiation room exists.
- Schools are D-rated, which usually means shorter tenancies and higher turnover. Who's the typical renter profile here, and what's been the actual vacancy rate?
- Crime grade is F in this area — have there been break-ins, vandalism, or insurance claims at this property in the last 3 years? What carrier currently insures it and at what premium?
- What's the average days-on-market for RENTAL listings here right now (not sales)? A rising rental-DOM trend means longer vacancies and softer asking-rent achievability than the comps imply.
- What's the recent tenant-quality profile in this submarket — average credit score on applications, eviction rate, late-payment / NSF rate, and stable-employment percentage? A property-management company in the area should have these aggregated.
- How much new for-sale + rental construction is in the pipeline within 1–3 miles? Heavy new supply typically softens prices + rents 12–24 months out; constrained supply supports both.
Investment metrics
- 1% rule
- 0.89% ✗
- Cap rate
- 6.61%
- Cash-on-cash
- 1.14%
- DSCR
- 1.05
- GRM
- 9.4
CMA / ARV
- ARV (on-the-fly)
- $241,300
- Comps found
- 12
Show comp detail 12 sales within ~0.75 mi
| Address | Dist | Beds/Ba | Sqft | Sold | Price | $/sf | Match |
|---|---|---|---|---|---|---|---|
| 1609 Juniper St | 0.30mi | 3/1.0 | 1,022 (+8%) | 3mo | $163,750 | $160 | 71 |
| 1107 N Hyde Park Ave | 0.65mi | 3/1.0 | 960 (+1%) | 7mo | $299,500 | $312 | 62 |
| 1116 Delano St | 0.61mi | 3/1.0 | 990 (+4%) | 3mo | $222,000 | $224 | 62 |
| 1522 London Cir | 0.14mi | 2/1.0 (-1) | 826 (-13%) | 6mo | $257,500 | $312 | 61 |
| 1613 Kilmer Ter | 0.23mi | 2/1.0 (-1) | 845 (-11%) | 10mo | $249,000 | $295 | 57 |
| 1309 N Hyde Park Ave | 0.53mi | 3/1.0 | 875 (-8%) | 7mo | $175,000 | $200 | 56 |
| 1112 N Driver St | 0.49mi | 2/1.0 (-1) | 1,036 (+9%) | 4mo | $268,500 | $259 | 54 |
| 1147 Delano St | 0.59mi | 3/1.0 | 1,067 (+12%) | 2mo | $250,000 | $234 | 50 |
| 1402 Robinhood Rd | 0.26mi | 2/1.0 (-1) | 808 (-15%) | 11mo | $264,500 | $327 | 49 |
| 2013 Aiken Ave | 0.72mi | 3/2.0 | 1,008 (+6%) | 6mo | $250,000 | $248 | 48 |
| 1121 Raynor St | 0.64mi | 3/2.0 | 1,062 (+12%) | 5mo | $270,000 | $254 | 42 |
| 919 Chester St | 0.74mi | 2/1.0 (-1) | 855 (-10%) | 9mo | $200,000 | $234 | 36 |
Match score weights: distance 35% · size 25% · config 20% · recency 20%. Top-matched comps best support the ARV.
Projected returns pro-forma
-3.0% appreciation · 3.25% rent growth · sell at horizon
- IRR
- -14.2%
- Equity multiple
- 0.49×
- Total profit
- $-27,153
- Equity at exit
- $28,330
- IRR
- -5.0%
- Equity multiple
- 0.67×
- Total profit
- $-17,745
- Equity at exit
- $16,428
Cash invested: $53,200 (down + closing). Projections, not guarantees.
Landlord ↔ Tenant lean methodology
- Overall (STATE)
- 85 Strongly Landlord-Friendly
- State North Carolina
- 85 Strongly Landlord-Friendly · R+3
- County
- — inherits STATE
- City
- — inherits STATE
ZIP-level market 27701
- Rents YoY
- 3.2%
- Active inventory
- 198
- Price-to-rent
- 9.4×
Monthly cashflow live
- Estimated rent
- $1,684 high interval (Pro) →
- Mortgage (P&I)
- −$996
- Tax from tax record
- −$205 /mo · $2,456/yr
- Insurance
- −$79
- HOA
- −$0
- Vacancy / Maint / Mgmt
- −$354
- Net cashflow
- $50
Break-even live
Sensitivity live
| Price | -10% $158 | -5% $104 | +0% $50 | +5% $-3 | +10% $-57 |
|---|---|---|---|---|---|
| Rent | -10% $-83 | -5% $-16 | +0% $50 | +5% $117 | +10% $183 |
| Rate | -1.0pp $146 | -0.5pp $99 | base $50 | +0.5pp $1 | +1.0pp $-49 |
UW: 25.0% down · 7.5% · 30yr · 1.5% tax · 5.0% vac · 8.0% maint · 8.0% mgmt
Financing live
Cash to close
- Down payment
- $47,500
- Closing costs
- $5,700
- Reserves months
- —
- Total cash needed
- —
Loan-product check · same deal, 3 products live
Conventional
25% down · 7.5% · 30yr
- Down + closing
- —
- Monthly P&I
- —
- Monthly cashflow
- —
- DSCR
- —
- Eligible?
- —
Personal DTI + credit; lowest rate.
DSCR
20% down · 8.5% · 30yr
- Down + closing
- —
- Monthly P&I
- —
- Monthly cashflow
- —
- DSCR
- —
- Eligible?
- —
No personal income docs; deal must DSCR.
Hard money
10% down · 12.0% · 12mo
- Down + closing
- —
- Monthly P&I
- —
- Monthly cashflow
- —
- DSCR
- —
- Eligible?
- —
Short-term bridge; refi at stabilization.
Rent comps 23 comps
| Address | Beds | Baths | Sqft | Rent | $/sqft | DOM | Units | Dist |
|---|---|---|---|---|---|---|---|---|
| 1516 London Cir Durham, NC | 3.0 | 1.0 | 1118 | $1,650 | $1.48 | 25d | 1 | 0.17mi |
| 1609 Evergreen St Durham, NC | 2.0 | 1.0 | 1051 | $1,695 | $1.61 | 23d | 1 | 0.44mi |
| 1237 Naples Pl Durham, NC | 1.0–4.0 | 1.0–2.0 | 995 | $1,567 | $1.57 | 13d | 1 | 0.46mi |
| 916 Fiske St Unit A Durham, NC | 2.0 | 1.0 | 800 | $1,050 | $1.31 | 25d | 1 | 0.59mi |
| 910 Fiske St Unit B Durham, NC | 2.0 | 1.0 | 750 | $1,025 | $1.37 | 25d | 1 | 0.61mi |
| 1600 N Alston Ave Unit C Durham, NC | 2.0 | 1.0 | 800 | $1,150 | $1.44 | 15d | 1 | 0.66mi |
| 518 N Hardee St Durham, NC | 1.0–2.0 | 1.0–1.5 | 665 | $1,299 | $1.95 | 25d | 1 | 0.67mi |
| 2011 Aiken Ave Durham, NC | 3.0 | 2.0 | 1120 | $1,595 | $1.42 | 25d | 1 | 0.70mi |
| 607 Dowd St Durham, NC | 2.0 | 1.0 | 720 | $1,550 | $2.15 | 25d | 1 | 0.83mi |
| 1828 Liberty St Unit B Durham, NC | 2.0 | 1.0 | 1100 | $1,450 | $1.32 | 15d | 1 | 0.96mi |
| 721 Liberty St Unit C Durham, NC | 2.0 | 1.0 | 800 | $1,495 | $1.87 | 25d | 1 | 1.11mi |
| 506 Gurley St Unit A Durham, NC | 2.0 | 1.0 | 775 | $1,300 | $1.68 | 15d | 1 | 1.11mi |
| 208 Gray Ave Apt 4H Durham, NC | 2.0 | 1.0 | 800 | $1,250 | $1.56 | 25d | 1 | 1.20mi |
| 200 W Geer St Unit 200-C Durham, NC | 2.0 | 1.0 | 850 | $1,400 | $1.65 | 15d | 1 | 1.25mi |
| 2408 Hart St Durham, NC | 3.0 | 1.0 | 960 | $1,445 | $1.51 | 25d | 1 | 1.36mi |
| 311 W Corporation St Durham, NC | 2.0 | 1.0–2.0 | 691 | $3,505 | $5.07 | 23d | 5 | 1.41mi |
| 311 W Corporation St Unit 3-201 Durham, NC | 2.0 | 2.0 | 985 | $3,355 | $3.41 | 25d | 1 | 1.41mi |
| 815 Madison St Durham, NC | 2.0 | 1.0–2.0 | 859 | $2,854 | $3.32 | 23d | 5 | 1.41mi |
| 406 Green St Durham, NC | 2.0 | 1.0 | 912 | $1,990 | $2.18 | 25d | 1 | 1.41mi |
| 321 W Corporation St Durham, NC | 2.0 | 2.0 | 977 | $2,530 | $2.59 | 15d | 1 | 1.42mi |
| 318 W Corporation St Durham, NC | 3.0 | 1.0–2.0 | 900 | $3,750 | $4.17 | 15d | 55 | 1.44mi |
| 500 E Main St Durham, NC | 3.0 | 1.0–2.0 | 1002 | $3,556 | $3.55 | 15d | 40 | 1.45mi |
| 620 Foster St Durham, NC | 2.0 | 1.0–2.0 | 888 | $3,303 | $3.72 | 15d | 43 | 1.49mi |
Listing history 12 events
-
2026-06-22days on market $190,000 Active 23 DOM
-
2026-06-18status $190,000 Active 20 DOM
-
2026-06-09status $190,000 Pending 20 DOM
-
2026-06-08days on market $190,000 Active 20 DOM
-
2026-06-07pricedays on market $190,000 Active 19 DOM
-
2026-06-05days on market $250,000 Active 16 DOM
-
2026-06-03days on market $250,000 Active 15 DOM
-
2026-06-02days on market $250,000 Active 14 DOM
-
2026-06-01days on market $250,000 Active 13 DOM
-
2026-05-31days on market $250,000 Active 12 DOM
-
2026-05-30days on market $250,000 Active 11 DOM
-
2026-05-18$250,000 Active
ⓘ Source: listings_history table (triggers on properties + properties_extension) + one-shot
backfill from property_details.listing_events for pre-trigger history.
Tax reassessment forecast NC · Resets to sale price
- Current annual tax
- $2,456 · $205/mo
- Projected year-2 tax
- $2,456 · $205/mo
- Expected delta
- $0/yr ($0/mo · 0.0%)
ⓘ Screening estimate from a state-policy table — verify with the county assessor before closing.
Climate risk First Street
- Flood 1/10 Low FEMA zone X (unshaded) · 0% chance over 30 yrs
- Wildfire 1/10 Low
- Heat 6/10 Major 7 d/yr ≥106°F today · 16 d/yr by 30 yrs out
- Wind 6/10 Major 27% chance of damaging wind over 30 yrs
- Air quality 2/10 Low 1 unhealthy d/yr today · 1 by 30 yrs out
Nearby sold comps map
Loading sold comps map…
Walkable amenities ~0.75 mi
Loading nearby amenities…
Taxation est. · year 1
- Rental income
- $20,211
- − Mortgage interest
- −$10,643
- − Property taxes
- −$2,456
- − Insurance
- −$950
- − Repairs & maintenance
- −$1,617
- − Management
- −$1,617
- − Depreciation
- −$5,527
- Taxable loss
- −$2,599
- Est. tax savings @ 24.0%
- +$624
- After-tax cash flow
- $1,228/yr
For passive investors: Depreciation is non-cash, so a rental often shows a tax loss while cash-flowing — sheltering income. Rental losses are passive: they offset passive income freely, and up to $25,000/yr can offset ordinary (W-2) income if you actively participate and your MAGI is under $100k (phasing out to $0 by $150k); unused losses carry forward. On sale, claimed depreciation is recaptured at up to 25%, and gains may owe capital-gains tax (a 1031 exchange can defer both). Figures are a year-1 estimate at your 24.0% rate — not tax advice; consult a CPA.
Schools (NCES district)
- District
- Durham Public Schools
- NCES district ID
- 3701260
- Math proficiency
- 29% ▼ -3.00%
- Reading proficiency
- 39% ▲ 2.00%
- Median HH income
- $52,143
- Composite
- 29.69/100
- National rank
- #6457
- State rank
- #132 of 178 in NC
Livability — Durham
- Score
- 81/100
- State rank
- #15
- US rank
- #1411
Category grades
Schools grade is shown separately in the Schools card above.
Census & demographics
- Census place
- Durham, NC
- County
- Durham County · 288,747 people
- City population
- 288,747
- Metro
- Durham-Chapel Hill, NC
- Population (ZIP)
- 24,793
- Household income
- $69,740
- Rent vs Own
- Severe rent burden
- 1402.0
Population outlook (Durham County) Hauer SSP2
- Today (2025)
- 368,962 people
- By 2030
- 402,686 · +9.1%
- By 2040
- 468,677 · +27.0%
- By 2050
- 531,727 · +44.1%
- By 2075
- 660,446 · +79.0%
- By 2100
- 739,971 · +100.6%
Race, ethnicity, and origin ACS 2023
- Neighborhood character
- Diverse neighborhood (Simpson 0.69)
- Race & ethnicity
- White 40% Black 32% Hispanic / Latino 19% Two or more races 9% Asian 3%
- Hispanic origin (detail)
- Mexican 9%
- Common ancestry
- Romanian 2% Italian 2% Slovak 2%
- Foreign-born
- 18% · Canada, Vietnam
- Languages at home
- 76% English-only · Spanish 18% Other Indo-European 2% German/W. Germanic 1%
Political lean MEDSL · Durham
- 2024 margin
- Solid D (+61.9) · D 80.2% · R 18.2% · Other 1.6%
- 2008→2024 swing
- +10.0pp toward D · 2008: 51.9pp · 2024: 61.9pp
- All cycles
- 2024: D+61.9 2020: D+62.4 2016: D+60.4 2012: D+52.7 2008: D+51.9
Not yet ingested
- Civics
- —
Market trends
- HPI YoY
- ▼ -272.19%
- Current HPI
- 347.5371
- Rent YoY
- ▲ 3.25%
- Metro
- Durham-Chapel Hill, NC
- State GDP YoY
- ▲ 3.28%
- F500 in state
- 26
Industry mix (Fortune 500 HQ in NC)
| Industry | F500 HQs | Revenue |
|---|---|---|
| Financial Services | 2 | $213B |
|
||
| Retail | 2 | $95B |
|
||
| Industrial Conglomerate | 1 | $38B |
|
||
| Metals / Steel | 1 | $35B |
|
||
| Utilities | 1 | $30B |
|
||
| Industrial Machinery | 1 | $19B |
|
||
Price history
1 event — show timeline
- 2026-05-18 Listed $250,000 TMLS
Property tax history
+6.6%/yrLatest (2025): $2,456 · +78.7% YoY. Source: county tax records.
Cash-flow waterfall
monthlySold comps — $/sqft
last 12 mo · ≤1 miLoading sold comps…