 Duplex
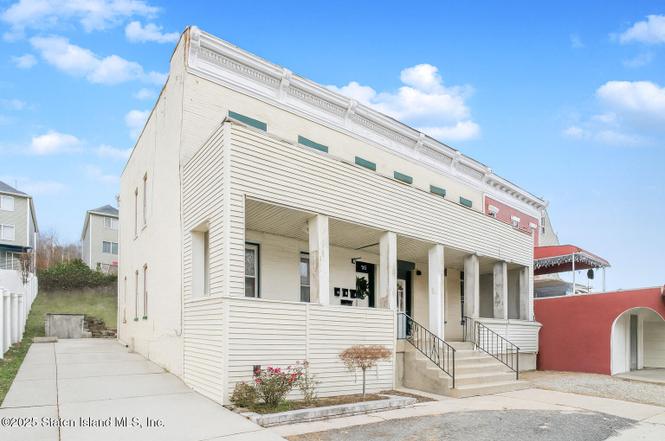
125 Brighton Ave · New York, NY
Flood risk 8/10 · Major
- FEMA flood zone
- X (unshaded)
- Chance of flooding over 30 yrs
- 0.99%
- Est. flood insurance / yr
- $507 – $1,088
Fire risk 1/10 · Minimal
- Est. fire insurance / yr
- $691 – $1,283
Heat risk 7/10 · Major
- Hot days now (above 98°F)
- 7 days/yr
- Hot days in 30 yrs
- 15 days/yr
Wind risk 6/10 · Moderate
- Chance of severe wind over 30 yrs
- 53.0%
Air-quality risk 4/10 · Minor
- Unhealthy air days now
- 5 days/yr
- Unhealthy air days in 30 yrs
- 7 days/yr
Risk factors via First Street. Map © Google.
Why this score? — see what drove the D- grade
The composite is a weighted blend of 9 inputs, each scored 0–100. Each bar is that input's sub-score; the figure is the points it added to the 100-point composite (weight × sub-score).
- Cash flow +14.6/30.0
- Schools +5.0/10.0
- DSCR +4.5/10.0
- Rent growth +4.0/5.0
- Livability +3.8/5.0
- 1% rule +2.8/10.0
- ARV discount +2.5/15.0
- Condition / age +2.5/5.0
- Appreciation +0.0/10.0
$799,888
🖨 Deal sheet (PDF) 📄 Offer letter ✓ Due diligence
Multi-family units
County records classify this as Multi-Family (2-4 Unit). Listing-text estimate: 2 units. confirmed
Listing remarks MLS
ALL BRICK, 2 FAMILY SEMI ATTACHED COLONIAL WITH HARDWOOD FLOORS THRU OUT! NEW KITCHEN ON FIRST FLOOR, NEW VANITY IN BOTH BATHROOMS. FULL FINISHED BASEMENT WITH SUMMER KITCHEN, FULL BATH AND TWO ADDITIONAL ROOMS. PRICED TO SELL!!
Key facts
- Fully remodeled
- Washer dryer hookup
- Income producing
Tags
Neighborhood map
What this means for you Summary
Snapshot
- This is a 2 × 2-bed/2.0-bath units multifamily listed at $800k.
Deal economics
- At list price, monthly cash flow is $128 ($2k/yr) — positive. Per door: $64/mo.
- The deal already cash-flows at list — no discount required.
- To meet the 1% rule (rent ≥ 1% of price), the offer needs to be $621k (22.4% below list).
- Recommended offer: $621k (22.4% below list) — sets the bar for 1% rule.
- Cap rate 6.6% vs local median 2.6% in New York — top-decile yield for the area; either an underpriced asset or a hidden risk that comps aren't pricing in. Stress-test before assuming the spread holds.
Location & tenants
- Location reads 75/100 on livability (#268 in NY, #4,188 nationally) — a middle-class / working-renter tenant base. Strengths: amenities A+, commute A+, health & safety A; Watch: crime F, cost of living F.
- Zoned schools: Elm Tree Elementary School (math 27% / reading 52%, grade F, #1,444 of 2,108 statewide, top 71%, 806 students, 94% FRL); Is 61 William A Morris (math 22% / reading 57%, grade F, #418 of 729 statewide, top 59%, 932 students, 84% FRL); Midwood High School (math 94% / reading 96%, grade A+, #83 of 1,100 statewide, top 8%, 4,062 students, 73% FRL).
- Market conditions: Rents rising fast (+6.1%/yr); 265 active listings in the ZIP; 3 comparable units currently listed for rent nearby; rentals at typical pace (median 17d on market — plan ~3-4 weeks tenant-placement turnaround); solid renter incomes; 480 units permitted in Richmond County in 2024 (22 in 5+ unit buildings).
- At $6,206/mo this rent would consume 87% of the median local household income ($86k/yr) (locally 2008% of renters already pay >50% of income on rent) — very limited rent-growth headroom before tenants either downsize or default.
Forward outlook
- Local home prices are declining (-3.0%/yr); year-one equity from $6k of loan paydown is wiped out by about $24k of value loss. Plan a longer hold.
- Richmond County population projected to shrink 5% by 2050 — rents likely to lag national; underwrite the cash flow, not the appreciation.
Negotiation context
- It's been on market 104 days — a 9% lower offer ($728k) is reasonable based on typical stale-listing flexibility.
- 7 sale attempts since 21y ago with the ask held roughly flat each time — persistent listings suggest the price (not the market) is what's stuck; bring a comps-based counter.
- Current owner paid $460k; list at $800k implies a 74% gain — meaningful room to come down on a strong offer.
Risks & watch-outs
- Watch-outs: flood insurance adds $66/mo; built in 1901 — expect roof / HVAC / electrical / plumbing capex.
- Climate carrying-cost: severe flood risk; major wind risk, 53% chance of damaging wind over 30y; extreme-heat days projected 7→15/yr by 2055 (HVAC capex compounding) — expect insurance premiums to compound above CPI over the hold.
Questions for the listing agent
- It's been on market 104 days. Have you received any prior offers? Is the seller open to a 22% concession, seller financing, or rate buy-down credit?
- Can we see the unit-by-unit rent roll, current vacancy, and any below-market leases? What's the average tenancy length?
- What capital expenditures (roof, boiler, parking lot, exteriors) have been made in the last 5 years, and what's planned in the next 2?
- Built in 1901 — when were the roof, HVAC, electrical panel, plumbing, and water heater last replaced?
- What's the actual annual flood-insurance premium (NFIP or private), and is the property in a SFHA with mandatory coverage?
- Why hasn't it sold? Are there any deal-killer items the seller is aware of (foundation, flood, title, zoning, code violations)?
- Is there a deadline driving the sale (1031 exchange, divorce, estate, relocation)? That informs how much negotiation room exists.
- Schools are B-rated — typically a magnet for longer-tenancy family renters. What's the average tenant stay here, and is there a school-zone premium baked into asking?
- Crime grade is F in this area — have there been break-ins, vandalism, or insurance claims at this property in the last 3 years? What carrier currently insures it and at what premium?
- The area grade is low — what's the realistic commute time and amenity access for the typical tenant pool here? Any planned neighborhood developments (good or bad) we should know about?
- What's the average days-on-market for RENTAL listings here right now (not sales)? A rising rental-DOM trend means longer vacancies and softer asking-rent achievability than the comps imply.
- What's the recent tenant-quality profile in this submarket — average credit score on applications, eviction rate, late-payment / NSF rate, and stable-employment percentage? A property-management company in the area should have these aggregated.
- How much new apartment / multifamily construction is in the pipeline within 1–3 miles? Heavy new supply (>2% of stock underway) typically softens rents 12–24 months out; light construction supports rent growth.
Investment metrics
- 1% rule
- 0.78% ✗
- Cap rate
- 6.58%
- Cash-on-cash
- 1.04%
- DSCR
- 1.05
- GRM
- 10.7
CMA / ARV
- ARV (on-the-fly)
- $720,200
- Comps found
- 12
Show comp detail 12 sales within ~0.75 mi
| Address | Dist | Beds/Ba | Sqft | Sold | Price | $/sf | Match |
|---|---|---|---|---|---|---|---|
| 125 Brighton Ave | 0.00mi | 4/4.0 | 2,126 (-4%) | 0mo | $750,000 | $353 | 93 |
| 70 Brighton Ave | 0.08mi | 4/2.0 | 2,288 (+3%) | 5mo | $600,000 | $262 | 79 |
| 181 Benziger Ave | 0.40mi | 4/3.5 | 2,258 (+2%) | 4mo | $700,000 | $310 | 73 |
| 24 Webster Ave | 0.07mi | 5/2.5 (+1) | 2,024 (-9%) | 5mo | $705,000 | $348 | 68 |
| 129 Benziger Ave | 0.48mi | 4/3.5 | 2,244 (+1%) | 9mo | $850,000 | $379 | 66 |
| 177-179 W Buchanan Ave | 0.55mi | 5/2.0 (+1) | 2,232 (+1%) | 4mo | $690,000 | $309 | 56 |
| 230 Fillmore St | 0.61mi | 4/3.0 | 2,090 (-6%) | 4mo | $680,000 | $325 | 54 |
| 75 Taft Ave | 0.43mi | 3/1.0 (-1) | 2,128 (-4%) | 8mo | $490,000 | $230 | 50 |
| 125 Walbrooke Ave | 0.73mi | 4/2.0 | 2,383 (+8%) | 0mo | $835,000 | $350 | 45 |
| 330 Van Duzer St | 0.70mi | 5/4.5 (+1) | 2,012 (-9%) | 1mo | $740,000 | $368 | 44 |
| 115 Corson Ave | 0.42mi | 3/1.0 (-1) | 2,415 (+9%) | 9mo | $550,000 | $228 | 41 |
| 165 Daniel Low Ter | 0.61mi | 3/1.0 (-1) | 2,430 (+10%) | 7mo | $650,000 | $267 | 32 |
Match score weights: distance 35% · size 25% · config 20% · recency 20%. Top-matched comps best support the ARV.
Projected returns pro-forma
-3.0% appreciation · 6.07% rent growth · sell at horizon
- IRR
- -12.3%
- Equity multiple
- 0.54×
- Total profit
- $-102,077
- Equity at exit
- $119,266
- IRR
- 0.4%
- Equity multiple
- 1.03×
- Total profit
- $6,468
- Equity at exit
- $69,160
Cash invested: $223,969 (down + closing). Projections, not guarantees.
Landlord ↔ Tenant lean methodology
- Overall (CITY)
- 0 Strongly Tenant-Friendly
- State New York
- 15 Strongly Tenant-Friendly · D+10
- County
- — inherits STATE
- City New York
- 0 Strongly Tenant-Friendly · D+34
ZIP-level market 10301
- Rents YoY
- 6.1%
- Active inventory
- 265
- Price-to-rent
- 21.5×
Monthly cashflow live
- Estimated rent
- $6,206 high interval (Pro) →
- Mortgage (P&I)
- −$4,195
- Tax from tax record
- −$180 /mo · $2,164/yr
- Insurance
- −$333
- Flood insurance flood zone
- −$66 /mo · $798/yr
- HOA
- −$0
- Vacancy / Maint / Mgmt
- −$1,303
- Net cashflow
- $128
Break-even live
Sensitivity live
| Price | -10% $581 | -5% $354 | +0% $128 | +5% $-98 | +10% $-325 |
|---|---|---|---|---|---|
| Rent | -10% $-362 | -5% $-117 | +0% $128 | +5% $373 | +10% $618 |
| Rate | -1.0pp $531 | -0.5pp $331 | base $128 | +0.5pp $-79 | +1.0pp $-290 |
2-unit breakdown (identical units grouped — click to expand)
| Units | Beds | Baths | Est. rent |
|---|---|---|---|
| 2× units | 2 | 2 | $6,206 |
| #1 | 2 | 2 | $3,103 |
| #2 | 2 | 2 | $3,103 |
| Total (2 units) | $6,206 | ||
UW: 25.0% down · 7.5% · 30yr · 1.5% tax · 5.0% vac · 8.0% maint · 8.0% mgmt
Financing live
Cash to close
- Down payment
- $199,972
- Closing costs
- $23,997
- Reserves months
- —
- Total cash needed
- —
Loan-product check · same deal, 3 products live
Conventional
25% down · 7.5% · 30yr
- Down + closing
- —
- Monthly P&I
- —
- Monthly cashflow
- —
- DSCR
- —
- Eligible?
- —
Personal DTI + credit; lowest rate.
DSCR
20% down · 8.5% · 30yr
- Down + closing
- —
- Monthly P&I
- —
- Monthly cashflow
- —
- DSCR
- —
- Eligible?
- —
No personal income docs; deal must DSCR.
Hard money
10% down · 12.0% · 12mo
- Down + closing
- —
- Monthly P&I
- —
- Monthly cashflow
- —
- DSCR
- —
- Eligible?
- —
Short-term bridge; refi at stabilization.
Rent comps 3 comps
| Address | Beds | Baths | Sqft | Rent | $/sqft | DOM | Units | Dist |
|---|---|---|---|---|---|---|---|---|
| 37 Ely St Staten Island, NY | 4.0 | 2.0 | 2600 | $3,999 | $1.54 | 8d | 1 | 0.16mi |
| 24 Clinton Ave Unit 2 Staten Island, NY | 3.0 | 1.0 | 1680 | $3,753 | $2.23 | 17d | 1 | 0.71mi |
| 65 Bard Ave Staten Island, NY | 3.0 | 2.0 | 1400 | $2,950 | $2.11 | 26d | 1 | 1.08mi |
Listing history 24 events
-
2026-04-01status Pending
-
2025-12-18$799,888 Active
-
2020-04-15soldstatus $460,000 Sold 232-char remark
Show marketing remark (232 chars)
ALL BRICK, 2 FAMILY SEMI ATTACHED COLONIAL WITH HARDWOOD FLOORS THRU OUT! NEW KITCHEN ON FIRST FLOOR, NEW VANITY IN BOTH BATHROOMS. FULL FINISHED BASEMENT WITH SUMMER KITCHEN, FULL BATH AND TWO ADDITIONAL ROOMS. PRICED TO SELL!!
-
2020-01-24soldstatus $460,000 Closed 230-char remark
Show marketing remark (230 chars)
ALL BRICK, 2 FAMILY SEMI ATTACHED COLONIAL WITH HARDWOOD FLOORS THRU OUT! NEW KITCHEN ON FIRST FLOOR. NEW VANITY IN BOTH BATHROOMS. FULL FINISHED BASEMENT WITH SUMMER KITCHEN, FULL BATH AND TWO ADDITIONAL ROOMS. PRICED TO SELL!
-
2019-12-05historical 232-char remark
Show marketing remark (230 chars)
ALL BRICK, 2 FAMILY SEMI ATTACHED COLONIAL WITH HARDWOOD FLOORS THRU OUT! NEW KITCHEN ON FIRST FLOOR. NEW VANITY IN BOTH BATHROOMS. FULL FINISHED BASEMENT WITH SUMMER KITCHEN, FULL BATH AND TWO ADDITIONAL ROOMS. PRICED TO SELL!
-
2019-12-05status Pending 230-char remark
Show marketing remark (230 chars)
ALL BRICK, 2 FAMILY SEMI ATTACHED COLONIAL WITH HARDWOOD FLOORS THRU OUT! NEW KITCHEN ON FIRST FLOOR. NEW VANITY IN BOTH BATHROOMS. FULL FINISHED BASEMENT WITH SUMMER KITCHEN, FULL BATH AND TWO ADDITIONAL ROOMS. PRICED TO SELL!
-
2019-11-14historical 230-char remark
Show marketing remark (230 chars)
ALL BRICK, 2 FAMILY SEMI ATTACHED COLONIAL WITH HARDWOOD FLOORS THRU OUT! NEW KITCHEN ON FIRST FLOOR. NEW VANITY IN BOTH BATHROOMS. FULL FINISHED BASEMENT WITH SUMMER KITCHEN, FULL BATH AND TWO ADDITIONAL ROOMS. PRICED TO SELL!
-
2019-10-31price $479,000 232-char remark
Show marketing remark (232 chars)
ALL BRICK, 2 FAMILY SEMI ATTACHED COLONIAL WITH HARDWOOD FLOORS THRU OUT! NEW KITCHEN ON FIRST FLOOR, NEW VANITY IN BOTH BATHROOMS. FULL FINISHED BASEMENT WITH SUMMER KITCHEN, FULL BATH AND TWO ADDITIONAL ROOMS. PRICED TO SELL!!
-
2019-10-30price $479,000 230-char remark
Show marketing remark (230 chars)
ALL BRICK, 2 FAMILY SEMI ATTACHED COLONIAL WITH HARDWOOD FLOORS THRU OUT! NEW KITCHEN ON FIRST FLOOR. NEW VANITY IN BOTH BATHROOMS. FULL FINISHED BASEMENT WITH SUMMER KITCHEN, FULL BATH AND TWO ADDITIONAL ROOMS. PRICED TO SELL!
-
2019-10-24status Active 230-char remark
Show marketing remark (230 chars)
ALL BRICK, 2 FAMILY SEMI ATTACHED COLONIAL WITH HARDWOOD FLOORS THRU OUT! NEW KITCHEN ON FIRST FLOOR. NEW VANITY IN BOTH BATHROOMS. FULL FINISHED BASEMENT WITH SUMMER KITCHEN, FULL BATH AND TWO ADDITIONAL ROOMS. PRICED TO SELL!
-
2019-10-22historical 230-char remark
Show marketing remark (230 chars)
ALL BRICK, 2 FAMILY SEMI ATTACHED COLONIAL WITH HARDWOOD FLOORS THRU OUT! NEW KITCHEN ON FIRST FLOOR. NEW VANITY IN BOTH BATHROOMS. FULL FINISHED BASEMENT WITH SUMMER KITCHEN, FULL BATH AND TWO ADDITIONAL ROOMS. PRICED TO SELL!
-
2019-10-11price $499,000 232-char remark
Show marketing remark (232 chars)
ALL BRICK, 2 FAMILY SEMI ATTACHED COLONIAL WITH HARDWOOD FLOORS THRU OUT! NEW KITCHEN ON FIRST FLOOR, NEW VANITY IN BOTH BATHROOMS. FULL FINISHED BASEMENT WITH SUMMER KITCHEN, FULL BATH AND TWO ADDITIONAL ROOMS. PRICED TO SELL!!
-
2019-10-10price $499,000 230-char remark
Show marketing remark (230 chars)
ALL BRICK, 2 FAMILY SEMI ATTACHED COLONIAL WITH HARDWOOD FLOORS THRU OUT! NEW KITCHEN ON FIRST FLOOR. NEW VANITY IN BOTH BATHROOMS. FULL FINISHED BASEMENT WITH SUMMER KITCHEN, FULL BATH AND TWO ADDITIONAL ROOMS. PRICED TO SELL!
-
2019-09-25$529,900 Active 232-char remark
Show marketing remark (232 chars)
ALL BRICK, 2 FAMILY SEMI ATTACHED COLONIAL WITH HARDWOOD FLOORS THRU OUT! NEW KITCHEN ON FIRST FLOOR, NEW VANITY IN BOTH BATHROOMS. FULL FINISHED BASEMENT WITH SUMMER KITCHEN, FULL BATH AND TWO ADDITIONAL ROOMS. PRICED TO SELL!!
-
2019-09-24$529,900 Active 230-char remark
Show marketing remark (230 chars)
ALL BRICK, 2 FAMILY SEMI ATTACHED COLONIAL WITH HARDWOOD FLOORS THRU OUT! NEW KITCHEN ON FIRST FLOOR. NEW VANITY IN BOTH BATHROOMS. FULL FINISHED BASEMENT WITH SUMMER KITCHEN, FULL BATH AND TWO ADDITIONAL ROOMS. PRICED TO SELL!
-
2016-02-17historical
-
2014-11-28historical
-
2014-11-28historical
-
2010-05-17$499,900
-
2009-10-16$675,000
-
2005-04-29$399,000
-
2003-01-08soldstatus $400,000
-
1996-04-01soldstatus $145,000
-
1985-06-28soldstatus $55,000
ⓘ Source: listings_history table (triggers on properties + properties_extension) + one-shot
backfill from property_details.listing_events for pre-trigger history.
Tax reassessment forecast NY · Partial reset (capped growth)
- Current annual tax
- $2,164 · $180/mo
- Projected year-2 tax
- $7,841 · $653/mo
- Expected delta
- +$5,677/yr (+$473/mo · 262.3%)
ⓘ Screening estimate from a state-policy table — verify with the county assessor before closing.
Climate risk First Street
- Flood 8/10 Severe FEMA zone X (unshaded) · 99% chance over 30 yrs
- Wildfire 1/10 Low
- Heat 7/10 Severe 7 d/yr ≥98°F today · 15 d/yr by 30 yrs out
- Wind 6/10 Major 53% chance of damaging wind over 30 yrs
- Air quality 4/10 Moderate 5 unhealthy d/yr today · 7 by 30 yrs out
Nearby sold comps map
Loading sold comps map…
Walkable amenities ~0.75 mi
Loading nearby amenities…
Taxation est. · year 1
- Rental income
- $74,472
- − Mortgage interest
- −$44,806
- − Property taxes
- −$2,164
- − Insurance
- −$4,797
- − Repairs & maintenance
- −$5,958
- − Management
- −$5,958
- − Depreciation
- −$23,269
- Taxable loss
- −$12,480
- Est. tax savings @ 24.0%
- +$2,995
- After-tax cash flow
- $4,531/yr
For passive investors: Depreciation is non-cash, so a rental often shows a tax loss while cash-flowing — sheltering income. Rental losses are passive: they offset passive income freely, and up to $25,000/yr can offset ordinary (W-2) income if you actively participate and your MAGI is under $100k (phasing out to $0 by $150k); unused losses carry forward. On sale, claimed depreciation is recaptured at up to 25%, and gains may owe capital-gains tax (a 1031 exchange can defer both). Figures are a year-1 estimate at your 24.0% rate — not tax advice; consult a CPA.
Schools (NCES district)
No district data.
Livability — New York
- Score
- 75/100
- State rank
- #268
- US rank
- #4188
Category grades
Schools grade is shown separately in the Schools card above.
Census & demographics
- Census place
- New York, NY
- County
- Richmond County · 404,174 people
- City population
- 7,731,280
- Metro
- New York-Newark-Jersey City, NY-NJ-PA
- Population (ZIP)
- 41,052
- Household income
- $85,609
- Rent vs Own
- Severe rent burden
- 2008.0
Population outlook (Richmond County) Hauer SSP2
- Today (2025)
- 482,784 people
- By 2030
- 481,831 · -0.2%
- By 2040
- 473,159 · -2.0%
- By 2050
- 457,242 · -5.3%
- By 2075
- 408,029 · -15.5%
- By 2100
- 341,459 · -29.3%
Race, ethnicity, and origin ACS 2023
- Neighborhood character
- Highly diverse neighborhood (Simpson 0.72)
- Race & ethnicity
- White 37% Hispanic / Latino 29% Black 23% Two or more races 16% Asian 7%
- Hispanic origin (detail)
- Mexican 5% Puerto Rican 10% Cuban 2% Dominican 6%
- Common ancestry
- Romanian 3% Scotch-Irish 2% Italian 1%
- Foreign-born
- 22% · Canada, China, Jamaica
- Languages at home
- 68% English-only · Spanish 16% Other Indo-European 5% Russian/Polish/Slavic 3%
Political lean MEDSL · Richmond
- 2024 margin
- Strong R (+29.8) · D 35.1% · R 64.9%
- 2008→2024 swing
- -25.7pp toward R · 2008: -4.0pp · 2024: -29.8pp
- All cycles
- 2024: R+29.8 2020: R+14.9 2016: R+16.8 2012: D+0.8 2008: R+4.0
Not yet ingested
- Civics
- —
Market trends
- HPI YoY
- ▼ -407.37%
- Current HPI
- 319.0616
- Rent YoY
- ▲ 6.07%
- Metro
- New York-Newark-Jersey City, NY-NJ-PA
- State GDP YoY
- ▲ 2.60%
- F500 in state
- 92
Industry mix (Fortune 500 HQ in NY)
| Industry | F500 HQs | Revenue |
|---|---|---|
| Financial Services | 10 | $950B |
|
||
| Consumer Goods | 9 | $162B |
|
||
| Insurance | 4 | $225B |
|
||
| Telecommunications | 2 | $144B |
|
||
| Pharmaceuticals | 2 | $112B |
|
||
| Media / Entertainment | 2 | $69B |
|
||
Price history
+1354.3% since first listed24 events — show timeline
- 2026-04-01 Pending — SIBORMLS
- 2025-12-18 Listed $799,888 SIBORMLS
- 2020-04-15 Sold (MLS) $460,000 BNYMLS
- 2020-01-24 Sold (MLS) $460,000 SIBORMLS
- 2019-12-05 Delisted — BNYMLS
- 2019-12-05 Pending — SIBORMLS
- 2019-11-14 Listing Removed — SIBORMLS
- 2019-10-31 Price Changed $479,000 BNYMLS
- 2019-10-30 Price Changed $479,000 SIBORMLS
- 2019-10-24 Relisted — SIBORMLS
- 2019-10-22 Listing Removed — SIBORMLS
- 2019-10-11 Price Changed $499,000 BNYMLS
- 2019-10-10 Price Changed $499,000 SIBORMLS
- 2019-09-25 Listed $529,900 BNYMLS
- 2019-09-24 Listed $529,900 SIBORMLS
- 2016-02-17 Listing Removed — SIBORMLS
- 2014-11-28 Listing Removed — SIBORMLS
- 2014-11-28 Listing Removed — SIBORMLS
- 2010-05-17 Listed $499,900 SIBORMLS
- 2009-10-16 Listed $675,000 SIBORMLS
- 2005-04-29 Listed $399,000 SIBORMLS
- 2003-01-08 Sold (Public Records) $400,000 Public Records
- 1996-04-01 Sold (Public Records) $145,000 Public Records
- 1985-06-28 Sold (Public Records) $55,000 Public Records
Property tax history
-5.0%/yrLatest (2025): $2,164 · +0.8% YoY. Source: county tax records.
Cash-flow waterfall
monthlySold comps — $/sqft
last 12 mo · ≤1 miLoading sold comps…