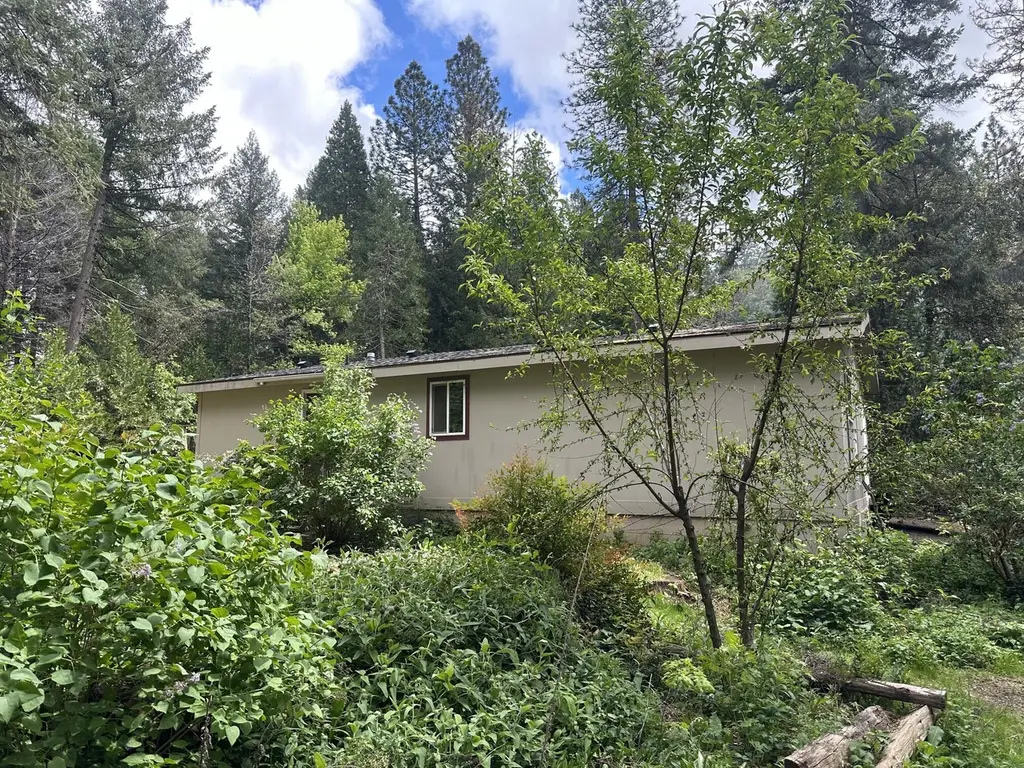
15691 Phillips Rd · Round Mountain, CA
Flood risk 1/10 · Minimal
- FEMA flood zone
- X (unshaded)
- Chance of flooding over 30 yrs
- 0.0%
- Est. flood insurance / yr
- $507 – $1,088
Fire risk 8/10 · Major
- Est. fire insurance / yr
- $659 – $1,223
Heat risk 5/10 · Moderate
- Hot days now (above 94°F)
- 5 days/yr
- Hot days in 30 yrs
- 11 days/yr
Wind risk 1/10 · Minimal
- Chance of severe wind over 30 yrs
- —
Air-quality risk 10/10 · Severe
- Unhealthy air days now
- 25 days/yr
- Unhealthy air days in 30 yrs
- 29 days/yr
Risk factors via First Street. Map © Google.
Why this score? — see what drove the B- grade
The composite is a weighted blend of 9 inputs, each scored 0–100. Each bar is that input's sub-score; the figure is the points it added to the 100-point composite (weight × sub-score).
- Cash flow +26.4/30.0
- DSCR +9.0/10.0
- ARV discount +7.5/15.0
- 1% rule +6.3/10.0
- Appreciation +5.0/10.0
- Schools +4.6/10.0
- Rent growth +2.5/5.0
- Condition / age +2.5/5.0
- Livability +2.2/5.0
$169,000
🖨 Deal sheet 📄 Offer letter ✓ Due diligence
Listing remarks MLS
PRIVATE FINANCING AVAILABLE! Incredible pricing on this renovated home on a fantastic pine studded acre. Split floorplan with master bedroom suite with large garden tub, walk-in closet and separate stall shower. Vaulted ceilings and fireplace in living room. Detached two-car garage with insulated attic. Tons of room for RV parking, 2nd garage or shop building.
Key facts
- Renovated home
- Walk-in closet
- Split-floorplan
Tags
Property features AI
Exterior
- Parking: 2-car garage; Oversized parking and RV access/parking
- Utilities: Well water; Septic tank sewer; 220-volt electric; Other utilities
- Home design: Manufactured residential home; One level
- Construction: Composition roof; Concrete perimeter foundation; Built as a manufactured home
- Exterior features: Waterfront pond; Property has a view; Lot is level with rolling slope; Asphalt road access
Interior
- Kitchen: Dishwasher
- Flooring: Vinyl flooring; Carpet
- Bathrooms: 2 full bathrooms
- Heating & cooling: No central cooling
- Interior features: Dishwasher; Fireplace in living room (propane)
Neighborhood map
What this means for you Summary
Snapshot
- This is a 3-bed/2.0-bath manufactured listed at $169k.
Deal economics
- At list price, monthly cash flow is $444 ($5k/yr) — positive.
- The deal already cash-flows at list — no discount required.
- Meets the 1% rule at list price ($2k rent vs $169k).
- Recommended offer: $166k (1.5% below list) — sets the bar for market timing.
Location & tenants
- Location reads 45/100 on livability (#1,311 in CA) — a working-class tenant base; expect higher turnover. Strengths: cost of living A; Watch: schools F, crime F, amenities F.
- Shasta Union High (urban): math 41% / reading 67% proficiency, ranked #122 of 517 in CA (top 24%) — acceptable for families but not a draw, mixed tenant base, ~2y average lease; only 16% free/reduced lunch — higher-income household profile.
- Market conditions: 24 active listings in the ZIP; 246 units permitted in Shasta County in 2024 (0 in 5+ unit buildings).
Forward outlook
- In year one you build about $1k of equity ($1k loan paydown + $22 appreciation (0.0% local appreciation)).
- Shasta County population projected to shrink 9% by 2050 — rents likely to lag national; underwrite the cash flow, not the appreciation.
- At projected returns (0.0% appreciation + 3.0% rent growth), your $47k cash investment doubles in ~6 years — after that, you're playing with house money.
Negotiation context
- It's been on market 30 days — a 2% lower offer ($166k) is reasonable based on typical stale-listing flexibility.
- 2 sale attempts since 13y ago; this cycle's ask has dropped $10k (6%) from the opening price — seller is motivated, your offer sets the floor, not the list.
- Current owner paid $102k; list at $169k implies a 65% gain — meaningful room to come down on a strong offer.
Risks & watch-outs
- Climate carrying-cost: severe wildfire risk; extreme-heat days projected 5→11/yr by 2055 (HVAC capex compounding) — expect insurance premiums to compound above CPI over the hold.
Questions for the listing agent
- Is there a deadline driving the sale (1031 exchange, divorce, estate, relocation)? That informs how much negotiation room exists.
- Schools are F-rated, which usually means shorter tenancies and higher turnover. Who's the typical renter profile here, and what's been the actual vacancy rate?
- Crime grade is F in this area — have there been break-ins, vandalism, or insurance claims at this property in the last 3 years? What carrier currently insures it and at what premium?
- What's the average days-on-market for RENTAL listings here right now (not sales)? A rising rental-DOM trend means longer vacancies and softer asking-rent achievability than the comps imply.
- What's the recent tenant-quality profile in this submarket — average credit score on applications, eviction rate, late-payment / NSF rate, and stable-employment percentage? A property-management company in the area should have these aggregated.
- How much new for-sale + rental construction is in the pipeline within 1–3 miles? Heavy new supply typically softens prices + rents 12–24 months out; constrained supply supports both.
Investment metrics
- 1% rule
- 1.13% ✓
- Cap rate
- 9.45%
- Cash-on-cash
- 11.26%
- DSCR
- 1.50
- GRM
- 7.4
CMA / ARV
No comps found within radius.
Projected returns pro-forma
0.01% appreciation · 3.0% rent growth · sell at horizon
- IRR
- 10.3%
- Equity multiple
- 1.49×
- Total profit
- $23,397
- Equity at exit
- $49,183
- IRR
- 15.2%
- Equity multiple
- 2.67×
- Total profit
- $78,916
- Equity at exit
- $59,209
Cash invested: $47,320 (down + closing). Projections, not guarantees.
Landlord ↔ Tenant lean methodology
- Overall (STATE)
- 18 Strongly Tenant-Friendly
- State California
- 18 Strongly Tenant-Friendly · D+13
- County
- — inherits STATE
- City
- — inherits STATE
ZIP-level market 96069
- Home prices YoY
- 0.0%
- Active inventory
- 24
- Price-to-rent
- 7.4×
Monthly cashflow live
- Estimated rent
- $1,902 medium interval (Pro) →
- Mortgage (P&I)
- −$886
- Tax from tax record
- −$102 /mo · $1,225/yr
- Insurance
- −$70
- HOA
- −$0
- Vacancy / Maint / Mgmt
- −$399
- Net cashflow
- $444
Break-even live
UW: 25.0% down · 7.5% · 30yr · 1.5% tax · 5.0% vac · 8.0% maint · 8.0% mgmt
Financing live
Cash to close
- Down payment
- $42,250
- Closing costs
- $5,070
- Reserves months
- —
- Total cash needed
- —
Loan-product check · same deal, 3 products live
Conventional
25% down · 7.5% · 30yr
- Down + closing
- —
- Monthly P&I
- —
- Monthly cashflow
- —
- DSCR
- —
- Eligible?
- —
Personal DTI + credit; lowest rate.
DSCR
20% down · 8.5% · 30yr
- Down + closing
- —
- Monthly P&I
- —
- Monthly cashflow
- —
- DSCR
- —
- Eligible?
- —
No personal income docs; deal must DSCR.
Hard money
10% down · 12.0% · 12mo
- Down + closing
- —
- Monthly P&I
- —
- Monthly cashflow
- —
- DSCR
- —
- Eligible?
- —
Short-term bridge; refi at stabilization.
Listing history 22 events
-
2026-06-19days on market $169,000 Active 30 DOM
-
2026-06-18days on market $169,000 Active 29 DOM
-
2026-06-17days on market $169,000 Active 28 DOM
-
2026-06-16days on market $169,000 Active 27 DOM
-
2026-06-15days on market $169,000 Active 26 DOM
-
2026-06-14days on market $169,000 Active 24 DOM
-
2026-06-12days on market $169,000 Active 23 DOM
-
2026-06-10days on market $169,000 Active 21 DOM
-
2026-06-09price $169,000 Active 20 DOM
-
2026-06-09days on market $179,000 Active 20 DOM
-
2026-06-08days on market $179,000 Active 19 DOM
-
2026-06-07days on market $179,000 Active 18 DOM
-
2026-06-05days on market $179,000 Active 16 DOM
-
2026-06-03days on market $179,000 Active 14 DOM
-
2026-06-02days on market $179,000 Active 13 DOM
-
2026-06-01days on market $179,000 Active 12 DOM
-
2026-05-31days on market $179,000 Active 11 DOM
-
2026-05-30days on market $179,000 Active 10 DOM
-
2026-05-20$179,000 Active
-
2015-02-13soldstatus $102,500 363-char remark
Show marketing remark (363 chars)
PRIVATE FINANCING AVAILABLE! Incredible pricing on this renovated home on a fantastic pine studded acre. Split floorplan with master bedroom suite with large garden tub, walk-in closet and separate stall shower. Vaulted ceilings and fireplace in living room. Detached two-car garage with insulated attic. Tons of room for RV parking, 2nd garage or shop building.
-
2013-10-09$102,500 363-char remark
Show marketing remark (363 chars)
PRIVATE FINANCING AVAILABLE! Incredible pricing on this renovated home on a fantastic pine studded acre. Split floorplan with master bedroom suite with large garden tub, walk-in closet and separate stall shower. Vaulted ceilings and fireplace in living room. Detached two-car garage with insulated attic. Tons of room for RV parking, 2nd garage or shop building.
-
2005-05-27soldstatus $20,000
ⓘ Source: listings_history table (triggers on properties + properties_extension) + one-shot
backfill from property_details.listing_events for pre-trigger history.
Tax reassessment forecast CA · Resets to sale price
- Current annual tax
- $1,225 · $102/mo
- Projected year-2 tax
- $1,284 · $107/mo
- Expected delta
- +$60/yr (+$5/mo · 4.9%)
ⓘ Screening estimate from a state-policy table — verify with the county assessor before closing.
Climate risk First Street
- Flood 1/10 Low FEMA zone X (unshaded) · 0% chance over 30 yrs
- Wildfire 8/10 Severe
- Heat 5/10 Major 5 d/yr ≥94°F today · 11 d/yr by 30 yrs out
- Wind 1/10 Low
- Air quality 10/10 Extreme 25 unhealthy d/yr today · 29 by 30 yrs out
Nearby sold comps map
Loading sold comps map…
Walkable amenities ~0.75 mi
Loading nearby amenities…
Taxation est. · year 1
- Rental income
- $22,825
- − Mortgage interest
- −$9,467
- − Property taxes
- −$1,225
- − Insurance
- −$845
- − Repairs & maintenance
- −$1,826
- − Management
- −$1,826
- − Depreciation
- −$4,916
- Taxable income
- $2,721
- Est. tax owed @ 24.0%
- −$653
- After-tax cash flow
- $4,674/yr
For passive investors: Depreciation is non-cash, so a rental often shows a tax loss while cash-flowing — sheltering income. Rental losses are passive: they offset passive income freely, and up to $25,000/yr can offset ordinary (W-2) income if you actively participate and your MAGI is under $100k (phasing out to $0 by $150k); unused losses carry forward. On sale, claimed depreciation is recaptured at up to 25%, and gains may owe capital-gains tax (a 1031 exchange can defer both). Figures are a year-1 estimate at your 24.0% rate — not tax advice; consult a CPA.
Schools (NCES district)
- District
- Shasta Union High
- NCES district ID
- 0636600
- Math proficiency
- 41% ▲ 3.00%
- Reading proficiency
- 67% ▲ 9.00%
- Median HH income
- $50,080
- Composite
- 46.01/100
- National rank
- #2532
- State rank
- #122 of 517 in CA
Livability — Round Mountain
- Score
- 45/100
- State rank
- #1311
- US rank
- #26653
Category grades
Schools grade is shown separately in the Schools card above.
Census & demographics
- Population (ZIP)
- 1,371
Population outlook (Shasta County) Hauer SSP2
- Today (2025)
- 179,231 people
- By 2030
- 176,953 · -1.3%
- By 2040
- 169,982 · -5.2%
- By 2050
- 162,547 · -9.3%
- By 2075
- 145,649 · -18.7%
- By 2100
- 123,025 · -31.4%
Race, ethnicity, and origin ACS 2023
- Neighborhood character
- Predominantly White (71%)
- Race & ethnicity
- White 71% Two or more races 26% Hispanic / Latino 21%
- Hispanic origin (detail)
- Mexican 20%
- Common ancestry
- Romanian 5% Serbian 4% Scottish 4%
- Foreign-born
- 11% · Canada
- Languages at home
- 78% English-only · Spanish 21% Other Indo-European 1%
Political lean MEDSL · Shasta
- 2024 margin
- Solid R (+36.5) · D 30.5% · R 67.0% · Other 2.5%
- 2008→2024 swing
- -10.7pp toward R · 2008: -25.8pp · 2024: -36.5pp
- All cycles
- 2024: R+36.5 2020: R+33.1 2016: R+37.4 2012: R+30.3 2008: R+25.8
Not yet ingested
- Civics
- —
Market trends
- HPI YoY
- ▬ 0.01%
- Current HPI
- 107.5676
- Rent YoY
- —
- Metro
- —
- State GDP YoY
- ▲ 3.21%
- F500 in state
- 116
Industry mix (Fortune 500 HQ in CA)
| Industry | F500 HQs | Revenue |
|---|---|---|
| Technology | 27 | $1,492B |
|
||
| Financial Services | 3 | $174B |
|
||
| Retail | 3 | $44B |
|
||
| Insurance | 3 | $26B |
|
||
| Media / Entertainment | 2 | $115B |
|
||
| Pharmaceuticals / Biotech | 2 | $62B |
|
||
Price history
+795.0% since first listed4 events — show timeline
- 2026-05-20 Listed $179,000 SAOR
- 2015-02-13 Sold (MLS) $102,500 SAOR
- 2013-10-09 Listed $102,500 SAOR
- 2005-05-27 Sold (Public Records) $20,000 Public Records
Property tax history
+6.2%/yrLatest (2025): $1,225 · +1.5% YoY. Source: county tax records.
Cash-flow waterfall
monthlySold comps — $/sqft
last 12 mo · ≤1 miLoading sold comps…