 🏷️ Likely Rental
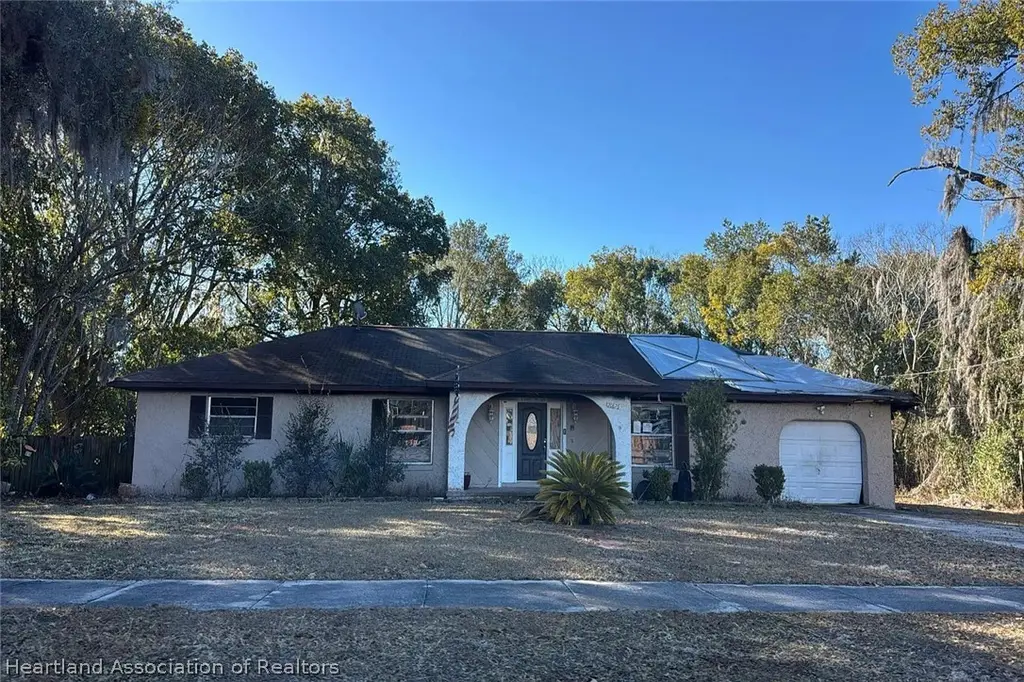
20876 Chestnut St · Dunnellon, FL
Flood risk 1/10 · Minimal
- FEMA flood zone
- X (unshaded)
- Chance of flooding over 30 yrs
- 0.0%
- Est. flood insurance / yr
- $507 – $1,088
Fire risk 5/10 · Moderate
- Est. fire insurance / yr
- $947 – $1,759
Heat risk 9/10 · Severe
- Hot days now (above 106°F)
- 7 days/yr
- Hot days in 30 yrs
- 24 days/yr
Wind risk 9/10 · Severe
- Chance of severe wind over 30 yrs
- 99.0%
Air-quality risk 2/10 · Minimal
- Unhealthy air days now
- 0 days/yr
- Unhealthy air days in 30 yrs
- 1 days/yr
Risk factors via First Street. Map © Google.
Why this score? — see what drove the D grade
The composite is a weighted blend of 9 inputs, each scored 0–100. Each bar is that input's sub-score; the figure is the points it added to the 100-point composite (weight × sub-score).
- Cash flow +15.0/30.0
- ARV discount +7.5/15.0
- 1% rule +5.0/10.0
- DSCR +5.0/10.0
- Schools +3.6/10.0
- Livability +3.5/5.0
- Rent growth +2.5/5.0
- Condition / age +2.5/5.0
- Appreciation +0.0/10.0
$5,000
🖨 Deal sheet 📄 Offer letter ✓ Due diligence
Listing remarks MLS
A diamond in the rough with good bones and great potential. Located across from Dunnellon Middle School, close to shopping, the Rainbow River and restaurants. Ripe for renovations this home ticks all the boxes for a handyman or investor. Even though some TLC is required, this property offers unlimited potential with an half acre of land, open floor plan, and two a/c units for dual zone operation. Exceptional value for the money in the Dunnellon Historic District. Additional photos will be updated by Oct. 25th. .
Key facts
- 0.42 acre lot
- Garage
- Built 1977
Property features AI
Finance
- Other: Zoning: R-3
Exterior
- Parking: 1-car garage
- Utilities: Other water source; Other sewer
- Home design: Single family residence; One level; Residential property
- Construction: Construction: See remarks
- Exterior features: Front porch; Other roof
Interior
- Bedrooms: 1 total room
- Flooring: Other flooring
- Bathrooms: 3 full bathrooms
- Heating & cooling: No heating; No cooling
- Interior features: Other flooring
Neighborhood map
What this means for you Summary
Snapshot
- This is a 4-bed/3.0-bath single-family listed at $5k.
Deal economics
- At list price, monthly cash flow is $2k ($19k/yr) — positive.
- The deal already cash-flows at list — no discount required.
- Meets the 1% rule at list price ($2k rent vs $5k).
Location & tenants
- Location reads 70/100 on livability (#443 in FL) — a middle-class / working-renter tenant base. Strengths: crime A+, cost of living A+, health & safety A+; Watch: schools D+, amenities F, commute F.
- Marion (rural): math 42% / reading 43% proficiency, ranked #61 of 73 in FL (top 84%) — families likely to look elsewhere, expect single-tenant / working-renter base with shorter leases; 61% free/reduced lunch — lower-income household profile, screen leases tightly.
- Market conditions: 553 active listings in the ZIP; 2 comparable units currently listed for rent nearby; 7,071 units permitted in Marion County in 2024 (534 in 5+ unit buildings).
- This rent runs 44% of the median local income ($57k/yr) — at the standard rent-burdened threshold; future hikes will face affordability resistance.
Forward outlook
- Local home prices are declining (-3.0%/yr); year-one equity from $35 of loan paydown is wiped out by about $150 of value loss. Plan a longer hold.
- Marion County population projected at +13% by 2050 — modest demand growth; plan on rents tracking national, not racing it.
- At projected returns (-3.0% appreciation + 3.0% rent growth), your $1k cash investment doubles in ~1 year — after that, you're playing with house money.
Negotiation context
- Only 7 days on market — expect competitive offers; lowballing is unlikely to land.
- 10 sale attempts since 11y ago with the ask held roughly flat each time — persistent listings suggest the price (not the market) is what's stuck; bring a comps-based counter.
Risks & watch-outs
- Climate carrying-cost: severe wind risk, 99% chance of damaging wind over 30y; moderate wildfire risk; extreme-heat days projected 7→24/yr by 2055 (HVAC capex compounding) — expect insurance premiums to compound above CPI over the hold.
Questions for the listing agent
- Built in 1977 — when were the roof, HVAC, electrical panel, plumbing, and water heater last replaced?
- Is there a deadline driving the sale (1031 exchange, divorce, estate, relocation)? That informs how much negotiation room exists.
- Schools are D-rated, which usually means shorter tenancies and higher turnover. Who's the typical renter profile here, and what's been the actual vacancy rate?
- The area grade is low — what's the realistic commute time and amenity access for the typical tenant pool here? Any planned neighborhood developments (good or bad) we should know about?
- What's the average days-on-market for RENTAL listings here right now (not sales)? A rising rental-DOM trend means longer vacancies and softer asking-rent achievability than the comps imply.
- What's the recent tenant-quality profile in this submarket — average credit score on applications, eviction rate, late-payment / NSF rate, and stable-employment percentage? A property-management company in the area should have these aggregated.
- How much new for-sale + rental construction is in the pipeline within 1–3 miles? Heavy new supply typically softens prices + rents 12–24 months out; constrained supply supports both.
Investment metrics
- 1% rule
- 41.18% ✓
- Cap rate
- 388.41%
- Cash-on-cash
- 1364.70%
- DSCR
- 61.72
- GRM
- 0.2
CMA / ARV
- ARV (on-the-fly)
- $328,860
- Comps found
- 3
Show comp detail 3 sales within ~0.75 mi
| Address | Dist | Beds/Ba | Sqft | Sold | Price | $/sf | Match |
|---|---|---|---|---|---|---|---|
| 20668 Walnut St | 0.21mi | 3/2.0 (-1) | 1,688 (-3%) | 14mo | $95,000 | $56 | 65 |
| 11948 Hale St | 0.10mi | 3/2.0 (-1) | 1,502 (-14%) | 13mo | $283,143 | $189 | 53 |
| 11680 Cherokee Cir | 0.39mi | 3/2.0 (-1) | 1,842 (+6%) | 18mo | $435,000 | $236 | 48 |
Match score weights: distance 35% · size 25% · config 20% · recency 20%. Top-matched comps best support the ARV.
Projected returns pro-forma
-3.0% appreciation · 3.0% rent growth · sell at horizon
- IRR
- —
- Equity multiple
- 72.88×
- Total profit
- $100,626
- Equity at exit
- $746
- IRR
- —
- Equity multiple
- 156.95×
- Total profit
- $218,324
- Equity at exit
- $432
Cash invested: $1,400 (down + closing). Projections, not guarantees.
Landlord ↔ Tenant lean methodology
- Overall (STATE)
- 87 Strongly Landlord-Friendly
- State Florida
- 87 Strongly Landlord-Friendly · R+3
- County
- — inherits STATE
- City
- — inherits STATE
ZIP-level market 34431
- Home prices YoY
- -3.2%
- Active inventory
- 553
- Price-to-rent
- 0.2×
Monthly cashflow live
- Estimated rent
- $2,059 medium interval (Pro) →
- Mortgage (P&I)
- −$26
- Tax est. 1.5%
- −$6 /mo · $75/yr
- Insurance
- −$2
- HOA
- −$0
- Vacancy / Maint / Mgmt
- −$432
- Net cashflow
- $1,592
Break-even live
UW: 25.0% down · 7.5% · 30yr · 1.5% tax · 5.0% vac · 8.0% maint · 8.0% mgmt
Financing live
Cash to close
- Down payment
- $1,250
- Closing costs
- $150
- Reserves months
- —
- Total cash needed
- —
Loan-product check · same deal, 3 products live
Conventional
25% down · 7.5% · 30yr
- Down + closing
- —
- Monthly P&I
- —
- Monthly cashflow
- —
- DSCR
- —
- Eligible?
- —
Personal DTI + credit; lowest rate.
DSCR
20% down · 8.5% · 30yr
- Down + closing
- —
- Monthly P&I
- —
- Monthly cashflow
- —
- DSCR
- —
- Eligible?
- —
No personal income docs; deal must DSCR.
Hard money
10% down · 12.0% · 12mo
- Down + closing
- —
- Monthly P&I
- —
- Monthly cashflow
- —
- DSCR
- —
- Eligible?
- —
Short-term bridge; refi at stabilization.
Rent comps 2 comps
| Address | Beds | Baths | Sqft | Rent | $/sqft | DOM | Units | Dist |
|---|---|---|---|---|---|---|---|---|
| 11745 W Shenandoah Way Citrus Springs, FL | 4.0 | 3.0 | 1836 | $1,745 | $0.95 | 21d | 1 | 1.36mi |
| 2186 W G Martinelli Blvd Citrus Springs, FL | 3.0 | 2.0 | 1448 | $1,950 | $1.35 | 21d | 1 | 1.43mi |
Listing history 23 events
-
2026-05-19$5,000 Active
-
2026-02-13$5,000 Active
-
2019-11-27soldstatus $140,800 518-char remark
Show marketing remark (518 chars)
A diamond in the rough with good bones and great potential. Located across from Dunnellon Middle School, close to shopping, the Rainbow River and restaurants. Ripe for renovations this home ticks all the boxes for a handyman or investor. Even though some TLC is required, this property offers unlimited potential with an half acre of land, open floor plan, and two a/c units for dual zone operation. Exceptional value for the money in the Dunnellon Historic District. Additional photos will be updated by Oct. 25th. .
-
2019-11-27soldstatus $140,800
Show marketing remark (518 chars)
A diamond in the rough with good bones and great potential. Located across from Dunnellon Middle School, close to shopping, the Rainbow River and restaurants. Ripe for renovations this home ticks all the boxes for a handyman or investor. Even though some TLC is required, this property offers unlimited potential with an half acre of land, open floor plan, and two a/c units for dual zone operation. Exceptional value for the money in the Dunnellon Historic District. Additional photos will be updated by Oct. 25th. .
-
2019-10-14$139,900 518-char remark
Show marketing remark (518 chars)
A diamond in the rough with good bones and great potential. Located across from Dunnellon Middle School, close to shopping, the Rainbow River and restaurants. Ripe for renovations this home ticks all the boxes for a handyman or investor. Even though some TLC is required, this property offers unlimited potential with an half acre of land, open floor plan, and two a/c units for dual zone operation. Exceptional value for the money in the Dunnellon Historic District. Additional photos will be updated by Oct. 25th. .
-
2017-02-17historical
-
2016-09-01historical
-
2016-08-17$139,900
-
2016-08-17historical
-
2016-08-17historical
-
2016-08-17$139,900
-
2016-07-20$139,900
-
2016-03-02$139,900
-
2016-02-29historical
-
2015-10-08$139,900
-
2015-09-21soldstatus $87,000
-
2015-08-24soldstatus $71,500
-
2015-08-24soldstatus $71,500
-
2015-06-09$88,000
-
2015-02-27$88,000
-
2005-01-03soldstatus $124,000
-
1985-12-01soldstatus $50,000
-
1984-06-01soldstatus $50,000
ⓘ Source: listings_history table (triggers on properties + properties_extension) + one-shot
backfill from property_details.listing_events for pre-trigger history.
Climate risk First Street
- Flood 1/10 Low FEMA zone X (unshaded) · 0% chance over 30 yrs
- Wildfire 5/10 Major
- Heat 9/10 Extreme 7 d/yr ≥106°F today · 24 d/yr by 30 yrs out
- Wind 9/10 Extreme 99% chance of damaging wind over 30 yrs
- Air quality 2/10 Low 0 unhealthy d/yr today · 1 by 30 yrs out
Nearby sold comps map
Loading sold comps map…
Walkable amenities ~0.75 mi
Loading nearby amenities…
Taxation est. · year 1
- Rental income
- $24,709
- − Mortgage interest
- −$280
- − Property taxes
- −$75
- − Insurance
- −$25
- − Repairs & maintenance
- −$1,977
- − Management
- −$1,977
- − Depreciation
- −$145
- Taxable income
- $20,230
- Est. tax owed @ 24.0%
- −$4,855
- After-tax cash flow
- $14,251/yr
For passive investors: Depreciation is non-cash, so a rental often shows a tax loss while cash-flowing — sheltering income. Rental losses are passive: they offset passive income freely, and up to $25,000/yr can offset ordinary (W-2) income if you actively participate and your MAGI is under $100k (phasing out to $0 by $150k); unused losses carry forward. On sale, claimed depreciation is recaptured at up to 25%, and gains may owe capital-gains tax (a 1031 exchange can defer both). Figures are a year-1 estimate at your 24.0% rate — not tax advice; consult a CPA.
Schools (NCES district)
- District
- Marion
- NCES district ID
- 1201260
- Math proficiency
- 42% ▼ -7.00%
- Reading proficiency
- 43% ▼ -4.00%
- Median HH income
- $40,015
- Composite
- 35.61/100
- National rank
- #4890
- State rank
- #61 of 73 in FL
Livability — Dunnellon
- Score
- 70/100
- State rank
- #443
- US rank
- #7922
Category grades
Schools grade is shown separately in the Schools card above.
Census & demographics
- Census place
- Dunnellon, FL
- County
- Marion County · 315,796 people
- City population
- 20,859
- Metro
- Ocala, FL
- Population (ZIP)
- 9,785
- Household income
- $56,534
- Rent vs Own
- Severe rent burden
- 72.0
Population outlook (Marion County) Hauer SSP2
- Today (2025)
- 365,905 people
- By 2030
- 376,768 · +3.0%
- By 2040
- 396,555 · +8.4%
- By 2050
- 412,723 · +12.8%
- By 2075
- 446,090 · +21.9%
- By 2100
- 436,193 · +19.2%
Race, ethnicity, and origin ACS 2023
- Neighborhood character
- Predominantly White (87%)
- Race & ethnicity
- White 87% Hispanic / Latino 7% Two or more races 5% Black 3% Asian 1%
- Hispanic origin (detail)
- Mexican 2% Puerto Rican 4% Cuban 1%
- Common ancestry
- Lithuanian 4% Slovak 3% Portuguese 2%
- Foreign-born
- 4% · Canada, Vietnam
- Languages at home
- 96% English-only · Spanish 2% German/W. Germanic 1% Vietnamese 1%
Political lean MEDSL · Marion
- 2024 margin
- Solid R (+31.6) · D 33.8% · R 65.5%
- 2008→2024 swing
- -20.0pp toward R · 2008: -11.6pp · 2024: -31.6pp
- All cycles
- 2024: R+31.6 2020: R+25.9 2016: R+26.2 2012: R+16.2 2008: R+11.6
Not yet ingested
- Civics
- —
Market trends
- HPI YoY
- ▼ -11.42%
- Current HPI
- 343.1464
- Rent YoY
- —
- Metro
- Ocala, FL
- State GDP YoY
- ▲ 3.28%
- F500 in state
- 36
Industry mix (Fortune 500 HQ in FL)
| Industry | F500 HQs | Revenue |
|---|---|---|
| Industrial Technology | 2 | $29B |
|
||
| Insurance | 2 | $17B |
|
||
| Retail | 1 | $60B |
|
||
| Technology Distribution | 1 | $58B |
|
||
| Homebuilding | 1 | $35B |
|
||
| Technology Manufacturing | 1 | $35B |
|
||
Price history
-90.0% since first listed23 events — show timeline
- 2026-05-19 Listed $5,000 HAOR as distributed by MLS GRID
- 2026-02-13 Listed $5,000 NFMLS
- 2019-11-27 Sold (Public Records) $140,800 Public Records
- 2019-11-27 Sold (MLS) $140,800 Stellar MLS as Distributed by MLS Grid
- 2019-10-14 Listed $139,900 Stellar MLS as Distributed by MLS Grid
- 2017-02-17 Listing Removed — Stellar MLS as Distributed by MLS Grid
- 2016-09-01 Listing Removed — Stellar MLS as Distributed by MLS Grid
- 2016-08-17 Listed $139,900 Stellar MLS as Distributed by MLS Grid
- 2016-08-17 Listing Removed — Stellar MLS as Distributed by MLS Grid
- 2016-08-17 Listing Removed — Stellar MLS as Distributed by MLS Grid
- 2016-08-17 Listed $139,900 Stellar MLS as Distributed by MLS Grid
- 2016-07-20 Listed $139,900 Stellar MLS as Distributed by MLS Grid
- 2016-03-02 Listed $139,900 Stellar MLS as Distributed by MLS Grid
- 2016-02-29 Listing Removed — Stellar MLS as Distributed by MLS Grid
- 2015-10-08 Listed $139,900 Stellar MLS as Distributed by MLS Grid
- 2015-09-21 Sold (Public Records) $87,000 Public Records
- 2015-08-24 Sold (MLS) $71,500 RACC
- 2015-08-24 Sold (MLS) $71,500 Stellar MLS as Distributed by MLS Grid
- 2015-06-09 Listed $88,000 RACC
- 2015-02-27 Listed $88,000 Stellar MLS as Distributed by MLS Grid
- 2005-01-03 Sold (Public Records) $124,000 Public Records
- 1985-12-01 Sold (Public Records) $50,000 Public Records
- 1984-06-01 Sold (Public Records) $50,000 Public Records
Property tax history
-7.1%/yrLatest (2025): $773 · +286.5% YoY. Source: county tax records.
Cash-flow waterfall
monthlySold comps — $/sqft
last 12 mo · ≤1 miLoading sold comps…