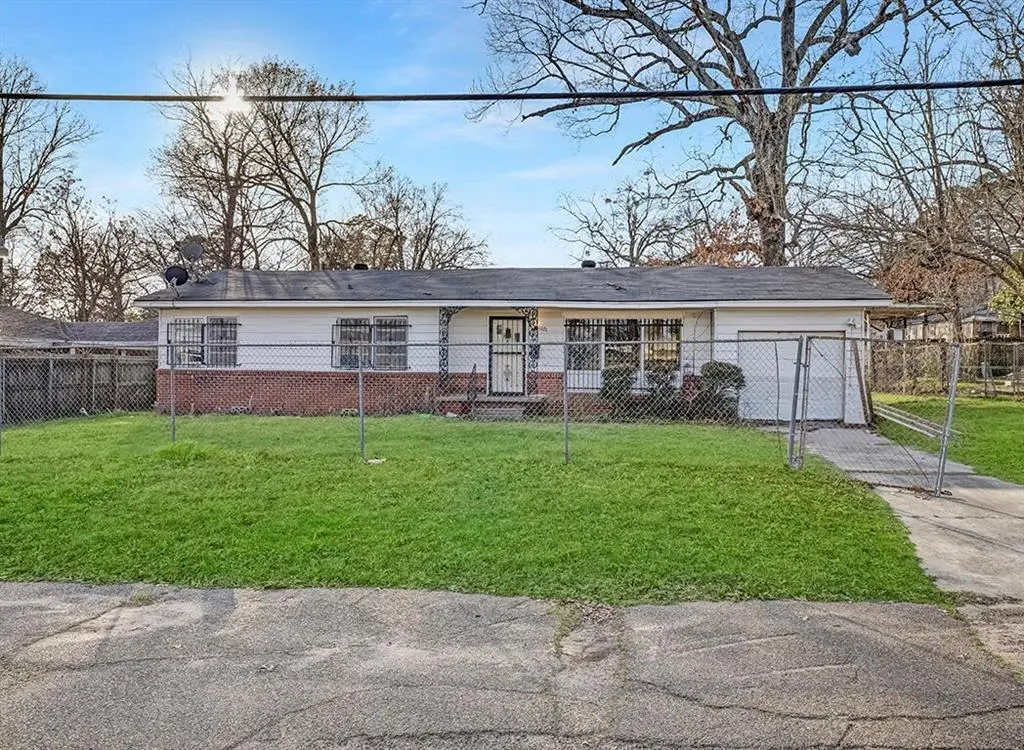
1121 Wheeler St · Texarkana, TX
Flood risk 1/10 · Minimal
- FEMA flood zone
- X (unshaded)
- Chance of flooding over 30 yrs
- 0.0%
- Est. flood insurance / yr
- $507 – $1,088
Fire risk 1/10 · Minimal
- Est. fire insurance / yr
- $1,222 – $2,270
Heat risk 7/10 · Major
- Hot days now (above 111°F)
- 7 days/yr
- Hot days in 30 yrs
- 22 days/yr
Wind risk 4/10 · Minor
- Chance of severe wind over 30 yrs
- 22.0%
Air-quality risk 2/10 · Minimal
- Unhealthy air days now
- 0 days/yr
- Unhealthy air days in 30 yrs
- 1 days/yr
Risk factors via First Street. Map © Google.
Why this score? — see what drove the B+ grade
The composite is a weighted blend of 9 inputs, each scored 0–100. Each bar is that input's sub-score; the figure is the points it added to the 100-point composite (weight × sub-score).
- Cash flow +30.0/30.0
- ARV discount +14.4/15.0
- DSCR +10.0/10.0
- 1% rule +9.1/10.0
- Livability +3.9/5.0
- Schools +3.2/10.0
- Rent growth +2.5/5.0
- Condition / age +2.5/5.0
- Appreciation +0.0/10.0
$97,000
🖨 Deal sheet (PDF) 📄 Offer letter ✓ Due diligence
Listing remarks MLS
This charming 3-bed, 1.5-bath brick home in Texarkana's Beverly Heights neighborhood sits on a spacious lot with a large front and back yard, timeless curb appeal, and the kind of character that stands the test of time. Beautiful wood-style flooring, fresh neutral tones, bright and welcoming living area with large windows, ceiling fans throughout, kitchen with ample cabinetry and natural light, three flexible bedrooms including one with warm wood-paneled walls, convenient half bath for guests, generous backyard great for relaxing or entertaining, and off-street parking — clean, comfortable, and move-in ready. FOR HOMEOWNERS Classic brick charm, hardwood-style floors, and a spacious yard in an established Texarkana neighborhood. Beverly Heights puts you close to shopping, dining, schools, and everyday essentials, while the large lot gives you the outdoor space and privacy that's hard to find at this price point. A rare opportunity for buyers looking for value in an established area. FOR INVESTORS Vacant, move-in ready, and an accessible entry into the Texarkana market. Brick construction, a spacious lot, and an established neighborhood make this a strong, low-maintenance addition to any portfolio. A solid first acquisition or an easy add-on for those looking to scale. Part of a 20-property portfolio across Texarkana and Nash. Properties range from $110K to $449K. Buy one or several.
Key facts
- 0.25 acre lot
- Built 1971
- Listed 81 days
Tags
Neighborhood map
What this means for you Summary
Snapshot
- This is a 3-bed/1.5-bath single-family listed at $97k.
Deal economics
- At list price, monthly cash flow is $416 ($5k/yr) — positive.
- The deal already cash-flows at list — no discount required.
- Meets the 1% rule at list price ($1k rent vs $97k).
- Recommended offer: $91k (6.0% below list) — sets the bar for market timing.
- Cap rate 11.4% vs local median 4.3% in Texarkana — top-decile yield for the area; either an underpriced asset or a hidden risk that comps aren't pricing in. Stress-test before assuming the spread holds.
Location & tenants
- Location reads 77/100 on livability (#93 in TX, #3,241 nationally) — a middle-class / working-renter tenant base. Strengths: cost of living A+, housing A+, health & safety A+; Watch: amenities D+, crime D, employment D.
- Texarkana ISD (urban): math 36% / reading 41% proficiency, ranked #472 of 826 in TX (top 57%) — families likely to look elsewhere, expect single-tenant / working-renter base with shorter leases; 64% free/reduced lunch — lower-income household profile, screen leases tightly.
- Zoned schools: Theron Jones Early Literacy Center (386 students, 98% FRL); Texas Middle (math 35% / reading 41%, grade F, #717 of 1,662 statewide, top 44%, 1,413 students, 75% FRL); Texas H S (math 39% / reading 52%, grade D-, #634 of 1,632 statewide, top 39%, 1,719 students, 62% FRL).
- Market conditions: 301 active listings in the ZIP; 8 comparable units currently listed for rent nearby; rentals lingering (median 46d on market — plan ~5-8 weeks vacancy on turnover, expect pricing pressure); 100% of comp listings sitting > 30 days — soft ceiling on asking rent; 137 units permitted in Bowie County in 2024 (5 in 5+ unit buildings).
Forward outlook
- Local home prices are declining (-3.0%/yr); year-one equity from $671 of loan paydown is wiped out by about $3k of value loss. Plan a longer hold.
- At projected returns (-3.0% appreciation + 3.0% rent growth), your $27k cash investment doubles in ~7 years — after that, you're playing with house money.
Negotiation context
- It's been on market 81 days — a 6% lower offer ($91k) is reasonable based on typical stale-listing flexibility.
- 3 sale attempts; this cycle's ask is 11312% above the opening price — seller raised mid-cycle; expect resistance to lowballs.
Risks & watch-outs
- Climate carrying-cost: extreme-heat days projected 7→22/yr by 2055 (HVAC capex compounding) — expect insurance premiums to compound above CPI over the hold.
Questions for the listing agent
- It's been on market 81 days. Have you received any prior offers? Is the seller open to a 6% concession, seller financing, or rate buy-down credit?
- Built in 1971 — when were the roof, HVAC, electrical panel, plumbing, and water heater last replaced?
- Why hasn't it sold? Are there any deal-killer items the seller is aware of (foundation, flood, title, zoning, code violations)?
- Is there a deadline driving the sale (1031 exchange, divorce, estate, relocation)? That informs how much negotiation room exists.
- Schools are D-rated, which usually means shorter tenancies and higher turnover. Who's the typical renter profile here, and what's been the actual vacancy rate?
- Crime grade is D in this area — have there been break-ins, vandalism, or insurance claims at this property in the last 3 years? What carrier currently insures it and at what premium?
- What's the average days-on-market for RENTAL listings here right now (not sales)? A rising rental-DOM trend means longer vacancies and softer asking-rent achievability than the comps imply.
- What's the recent tenant-quality profile in this submarket — average credit score on applications, eviction rate, late-payment / NSF rate, and stable-employment percentage? A property-management company in the area should have these aggregated.
- How much new for-sale + rental construction is in the pipeline within 1–3 miles? Heavy new supply typically softens prices + rents 12–24 months out; constrained supply supports both.
Investment metrics
- 1% rule
- 1.41% ✓
- Cap rate
- 11.44%
- Cash-on-cash
- 18.39%
- DSCR
- 1.82
- GRM
- 5.9
CMA / ARV
- ARV (median comp)
- $114,688
- List price
- $97,000
- Delta
- -15.42%
- Verdict
- UNDERPRICED
- Comps
- 8 within 1.0 mi
Show comp detail 2 sales within ~0.75 mi
| Address | Dist | Beds/Ba | Sqft | Sold | Price | $/sf | Match |
|---|---|---|---|---|---|---|---|
| 2708 Weaver Pl | 0.65mi | 3/1.5 | 1,331 (+11%) | 9mo | $165,000 | $124 | 43 |
| 3506 Robinhood Ln | 0.74mi | 3/2.0 | 1,323 (+10%) | 19mo | $187,900 | $142 | 30 |
Match score weights: distance 35% · size 25% · config 20% · recency 20%. Top-matched comps best support the ARV.
Projected returns pro-forma
-3.0% appreciation · 3.0% rent growth · sell at horizon
- IRR
- 10.1%
- Equity multiple
- 1.40×
- Total profit
- $10,805
- Equity at exit
- $14,463
- IRR
- 19.2%
- Equity multiple
- 2.61×
- Total profit
- $43,612
- Equity at exit
- $8,387
Cash invested: $27,160 (down + closing). Projections, not guarantees.
Landlord ↔ Tenant lean methodology
- Overall (STATE)
- 87 Strongly Landlord-Friendly
- State Texas
- 87 Strongly Landlord-Friendly · R+5
- County
- — inherits STATE
- City
- — inherits STATE
ZIP-level market 75503
- Home prices YoY
- -21.0%
- Active inventory
- 301
- Price-to-rent
- 5.9×
Monthly cashflow live
- Estimated rent
- $1,370 high interval (Pro) →
- Mortgage (P&I)
- −$509
- Tax from tax record
- −$117 /mo · $1,404/yr
- Insurance
- −$40
- HOA
- −$0
- Vacancy / Maint / Mgmt
- −$288
- Net cashflow
- $416
Break-even live
Sensitivity live
| Price | -10% $471 | -5% $444 | +0% $416 | +5% $389 | +10% $361 |
|---|---|---|---|---|---|
| Rent | -10% $308 | -5% $362 | +0% $416 | +5% $470 | +10% $524 |
| Rate | -1.0pp $465 | -0.5pp $441 | base $416 | +0.5pp $391 | +1.0pp $365 |
UW: 25.0% down · 7.5% · 30yr · 1.5% tax · 5.0% vac · 8.0% maint · 8.0% mgmt
Financing live
Cash to close
- Down payment
- $24,250
- Closing costs
- $2,910
- Reserves months
- —
- Total cash needed
- —
Loan-product check · same deal, 3 products live
Conventional
25% down · 7.5% · 30yr
- Down + closing
- —
- Monthly P&I
- —
- Monthly cashflow
- —
- DSCR
- —
- Eligible?
- —
Personal DTI + credit; lowest rate.
DSCR
20% down · 8.5% · 30yr
- Down + closing
- —
- Monthly P&I
- —
- Monthly cashflow
- —
- DSCR
- —
- Eligible?
- —
No personal income docs; deal must DSCR.
Hard money
10% down · 12.0% · 12mo
- Down + closing
- —
- Monthly P&I
- —
- Monthly cashflow
- —
- DSCR
- —
- Eligible?
- —
Short-term bridge; refi at stabilization.
Rent comps 8 comps
| Address | Beds | Baths | Sqft | Rent | $/sqft | DOM | Units | Dist |
|---|---|---|---|---|---|---|---|---|
| 1504 Colorado St Texarkana, TX | 3.0 | 2.0 | 1298 | $1,595 | $1.23 | 45d | 1 | 0.63mi |
| 722 W 34th St Texarkana, TX | 2.0 | 1.0 | 1298 | $1,300 | $1.00 | 45d | 1 | 0.92mi |
| 315 Brookwood Dr Texarkana, TX | 2.0 | 1.5 | 1173 | $1,095 | $0.93 | 45d | 1 | 1.14mi |
| 313-315 Brookwood Dr Unit 315 Texarkana, TX | 2.0 | 1.5 | 1173 | $1,095 | $0.93 | 45d | 1 | 1.14mi |
| 4101 Olive St Texarkana, TX | 2.0 | 1.0 | 1400 | $1,300 | $0.93 | 45d | 1 | 1.27mi |
| 501 Westlawn Dr Texarkana, TX | 2.0 | 1.0 | 775 | $800 | $1.03 | 45d | 1 | 1.30mi |
| 3801 Magnolia St Unit MG01 Texarkana, TX | 3.0 | 1.5 | 1200 | $1,000 | $0.83 | 45d | 1 | 1.41mi |
| 4841 N Park Rd Texarkana, TX | 2.0 | 1.5 | 1260 | $1,100 | $0.87 | 45d | 1 | 1.44mi |
Listing history 24 events
-
2026-06-21days on market $97,000 Active 81 DOM
-
2026-06-19days on market $97,000 Active 79 DOM
-
2026-06-18days on market $97,000 Active 78 DOM
-
2026-06-17days on market $97,000 Active 77 DOM
-
2026-06-17price $97,000 Active 76 DOM
-
2026-06-16days on market $99,000 Active 76 DOM
-
2026-06-15days on market $99,000 Active 75 DOM
-
2026-06-14days on market $99,000 Active 73 DOM
-
2026-06-13days on market $99,000 Active 72 DOM
-
2026-06-10days on market $99,000 Active 70 DOM
-
2026-06-09days on market $99,000 Active 69 DOM
-
2026-06-08days on market $99,000 Active 68 DOM
-
2026-06-07days on market $99,000 Active 67 DOM
-
2026-06-05days on market $99,000 Active 64 DOM
-
2026-06-02days on market $99,000 Active 62 DOM
-
2026-06-01days on market $99,000 Active 61 DOM
-
2026-05-31days on market $99,000 Active 60 DOM
-
2026-05-30days on market $99,000 Active 59 DOM
-
2026-04-25$850
-
2026-04-06historical $850
-
2026-04-01$110,000 Active 1422-char remark
Show marketing remark (1422 chars)
This charming 3-bed, 1.5-bath brick home in Texarkana's Beverly Heights neighborhood sits on a spacious lot with a large front and back yard, timeless curb appeal, and the kind of character that stands the test of time. Beautiful wood-style flooring, fresh neutral tones, bright and welcoming living area with large windows, ceiling fans throughout, kitchen with ample cabinetry and natural light, three flexible bedrooms including one with warm wood-paneled walls, convenient half bath for guests, generous backyard great for relaxing or entertaining, and off-street parking — clean, comfortable, and move-in ready. FOR HOMEOWNERS Classic brick charm, hardwood-style floors, and a spacious yard in an established Texarkana neighborhood. Beverly Heights puts you close to shopping, dining, schools, and everyday essentials, while the large lot gives you the outdoor space and privacy that's hard to find at this price point. A rare opportunity for buyers looking for value in an established area. FOR INVESTORS Vacant, move-in ready, and an accessible entry into the Texarkana market. Brick construction, a spacious lot, and an established neighborhood make this a strong, low-maintenance addition to any portfolio. A solid first acquisition or an easy add-on for those looking to scale. Part of a 20-property portfolio across Texarkana and Nash. Properties range from $110K to $449K. Buy one or several.
-
2026-02-20$850
-
2025-07-18soldstatus
-
2000-08-25soldstatus
ⓘ Source: listings_history table (triggers on properties + properties_extension) + one-shot
backfill from property_details.listing_events for pre-trigger history.
Tax reassessment forecast TX · Resets to sale price
- Current annual tax
- $1,404 · $117/mo
- Projected year-2 tax
- $1,775 · $148/mo
- Expected delta
- +$371/yr (+$31/mo · 26.4%)
ⓘ Screening estimate from a state-policy table — verify with the county assessor before closing.
Climate risk First Street
- Flood 1/10 Low FEMA zone X (unshaded) · 0% chance over 30 yrs
- Wildfire 1/10 Low
- Heat 7/10 Severe 7 d/yr ≥111°F today · 22 d/yr by 30 yrs out
- Wind 4/10 Moderate 22% chance of damaging wind over 30 yrs
- Air quality 2/10 Low 0 unhealthy d/yr today · 1 by 30 yrs out
Nearby sold comps map
Loading sold comps map…
Walkable amenities ~0.75 mi
Loading nearby amenities…
Taxation est. · year 1
- Rental income
- $16,439
- − Mortgage interest
- −$5,434
- − Property taxes
- −$1,404
- − Insurance
- −$485
- − Repairs & maintenance
- −$1,315
- − Management
- −$1,315
- − Depreciation
- −$2,822
- Taxable income
- $3,665
- Est. tax owed @ 24.0%
- −$880
- After-tax cash flow
- $4,114/yr
For passive investors: Depreciation is non-cash, so a rental often shows a tax loss while cash-flowing — sheltering income. Rental losses are passive: they offset passive income freely, and up to $25,000/yr can offset ordinary (W-2) income if you actively participate and your MAGI is under $100k (phasing out to $0 by $150k); unused losses carry forward. On sale, claimed depreciation is recaptured at up to 25%, and gains may owe capital-gains tax (a 1031 exchange can defer both). Figures are a year-1 estimate at your 24.0% rate — not tax advice; consult a CPA.
Schools (NCES district)
- District
- Texarkana ISD
- NCES district ID
- 4842480
- Math proficiency
- 36% ▼ -7.00%
- Reading proficiency
- 41% ▼ -1.00%
- Median HH income
- $35,692
- Composite
- 31.87/100
- National rank
- #5867
- State rank
- #472 of 826 in TX
Livability — Texarkana
- Score
- 77/100
- State rank
- #93
- US rank
- #3241
Category grades
Schools grade is shown separately in the Schools card above.
Census & demographics
- Census place
- Texarkana, TX
- County
- Bowie County · 61,238 people
- City population
- 61,238
- Metro
- Texarkana, TX-AR
- Population (ZIP)
- 26,372
- Household income
- $72,159
- Rent vs Own
- Severe rent burden
- 773.0
Population outlook (Bowie County) Hauer SSP2
- Today (2025)
- 94,699 people
- By 2030
- 94,824 · +0.1%
- By 2040
- 94,870 · +0.2%
- By 2050
- 93,686 · -1.1%
- By 2075
- 90,082 · -4.9%
- By 2100
- 76,579 · -19.1%
Race, ethnicity, and origin ACS 2023
- Neighborhood character
- Majority White (63%)
- Race & ethnicity
- White 63% Black 23% Hispanic / Latino 7% Two or more races 5% Asian 3%
- Hispanic origin (detail)
- Mexican 6%
- Common ancestry
- Slovak 2% Serbian 1% Lithuanian 1%
- Foreign-born
- 5% · Canada, Vietnam, South Korea
- Languages at home
- 92% English-only · Spanish 6% Other Indo-European 1%
Political lean MEDSL · Bowie
- 2024 margin
- Solid R (+48.7) · D 25.3% · R 74.0%
- 2008→2024 swing
- -10.8pp toward R · 2008: -37.9pp · 2024: -48.7pp
- All cycles
- 2024: R+48.7 2020: R+42.8 2016: R+46.6 2012: R+41.5 2008: R+37.9
Not yet ingested
- Civics
- —
Market trends
- HPI YoY
- ▼ -48.09%
- Current HPI
- 181.3052
- Rent YoY
- —
- Metro
- Texarkana, TX-AR
- State GDP YoY
- ▲ 3.95%
- F500 in state
- 110
Industry mix (Fortune 500 HQ in TX)
| Industry | F500 HQs | Revenue |
|---|---|---|
| Energy | 16 | $1,198B |
|
||
| Technology | 5 | $198B |
|
||
| Engineering / Construction | 4 | $72B |
|
||
| Energy Services | 3 | $60B |
|
||
| Utilities | 3 | $41B |
|
||
| Healthcare | 2 | $330B |
|
||
Price history
6 events — show timeline
- 2026-04-25 Listed for Rent $850 Avail
- 2026-04-06 Rental Removed $850 Avail
- 2026-04-01 Listed $110,000 NTREIS
- 2026-02-20 Listed for Rent $850 Avail
- 2025-07-18 Sold (Public Records) — Public Records
- 2000-08-25 Sold (Public Records) — Public Records
Property tax history
+7.4%/yrLatest (2025): $1,404 · +4.6% YoY. Source: county tax records.
Cash-flow waterfall
monthlySold comps — $/sqft
last 12 mo · ≤1 miLoading sold comps…