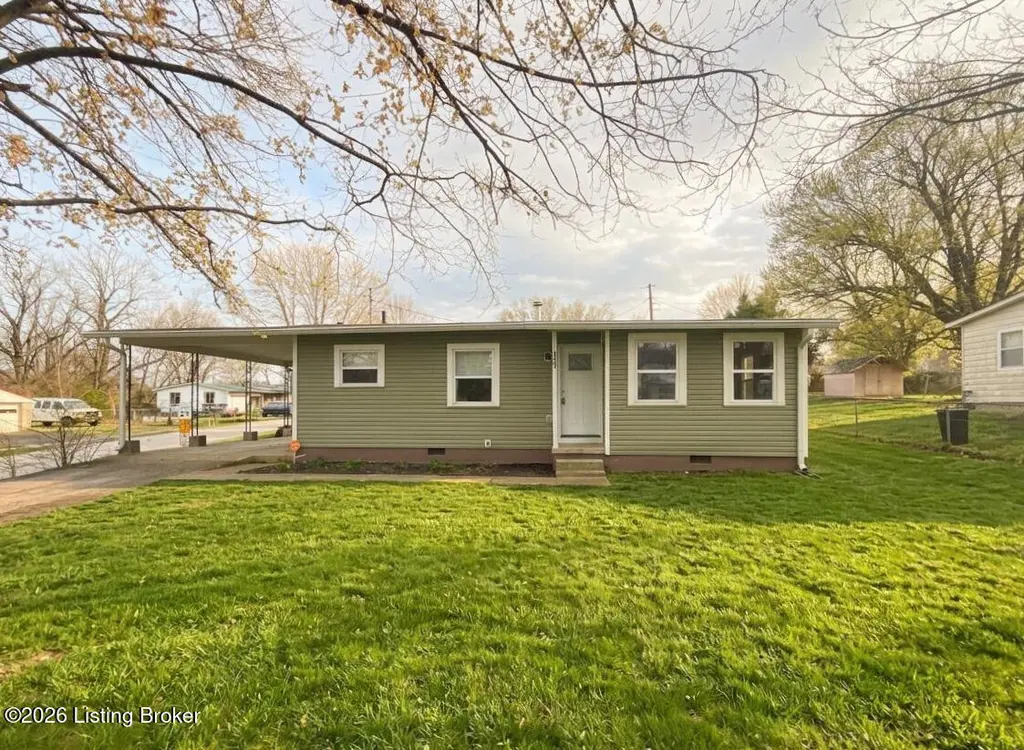
401 Knox Ave · Vine Grove, KY
Flood risk 1/10 · Minimal
- FEMA flood zone
- X (unshaded)
- Chance of flooding over 30 yrs
- 0.0%
- Est. flood insurance / yr
- $507 – $1,088
Fire risk 3/10 · Minor
- Est. fire insurance / yr
- $839 – $1,559
Heat risk 5/10 · Moderate
- Hot days now (above 105°F)
- 7 days/yr
- Hot days in 30 yrs
- 19 days/yr
Wind risk 2/10 · Minimal
- Chance of severe wind over 30 yrs
- 4.0%
Air-quality risk 2/10 · Minimal
- Unhealthy air days now
- 0 days/yr
- Unhealthy air days in 30 yrs
- 1 days/yr
Risk factors via First Street. Map © Google.
Why this score? — see what drove the B+ grade
The composite is a weighted blend of 9 inputs, each scored 0–100. Each bar is that input's sub-score; the figure is the points it added to the 100-point composite (weight × sub-score).
- Cash flow +30.0/30.0
- ARV discount +15.0/15.0
- DSCR +10.0/10.0
- 1% rule +8.7/10.0
- Livability +3.6/5.0
- Schools +3.2/10.0
- Rent growth +2.5/5.0
- Condition / age +2.5/5.0
- Appreciation +0.0/10.0
$124,000
🖨 Deal sheet 📄 Offer letter ✓ Due diligence
Listing remarks MLS
Move-in ready and full of potential, 401 Knox Ave in Vine Grove features neutral paint and flooring throughout, creating a bright, clean canvas for your personal style. This home offers a functional layout with inviting living spaces and plenty of natural light. Tucked into a quiet, established neighborhood yet close to local amenities, it's perfect for first-time buyers, downsizers, or investors looking for a turn-key opportunity.
Key facts
- Natural light
- Functional layout
- Move in ready
Tags
Property features AI
Finance
- HOA & community: No association fee
Exterior
- Parking: Driveway
- Utilities: Electricity connected
- Home design: Single-family ranch residence; One story; Built in 1955
- Construction: Vinyl siding; Shingle roof; Crawl space foundation
- Exterior features: Corner lot; No fencing indicated
Interior
- Kitchen: Kitchen on the first floor
- Bedrooms: Three bedrooms (all on the first floor); Primary bedroom on the first floor
- Bathrooms: One full bathroom
- Heating & cooling: Forced air heating (natural gas); Central air conditioning
- Interior features: Five total rooms; Five closets; Basement: None; First-floor laundry
- Laundry & utility: Laundry room on the first floor
Neighborhood map
What this means for you Summary
Snapshot
- This is a 3-bed/1.0-bath single-family listed at $124k.
Deal economics
- At list price, monthly cash flow is $506 ($6k/yr) — positive.
- The deal already cash-flows at list — no discount required.
- Meets the 1% rule at list price ($2k rent vs $124k).
- Recommended offer: $117k (6.0% below list) — sets the bar for market timing.
- Cap rate 11.2% vs local median 4.0% in Vine Grove — top-decile yield for the area; either an underpriced asset or a hidden risk that comps aren't pricing in. Stress-test before assuming the spread holds.
Location & tenants
- Location reads 72/100 on livability (#124 in KY) — a middle-class / working-renter tenant base. Strengths: crime A+, cost of living A+, housing A+; Watch: amenities F, commute F, health & safety F.
- Hardin County (suburban): math 30% / reading 43% proficiency, ranked #47 of 165 in KY (top 28%) — families likely to look elsewhere, expect single-tenant / working-renter base with shorter leases.
- Market conditions: 155 active listings in the ZIP; 946 units permitted in Hardin County in 2024 (464 in 5+ unit buildings).
Forward outlook
- Local home prices are declining (-3.0%/yr); year-one equity from $857 of loan paydown is wiped out by about $4k of value loss. Plan a longer hold.
- Hardin County population projected at -16% by 2050 — secular population decline; favor cash flow + early exit over multi-decade hold.
- At projected returns (-3.0% appreciation + 3.0% rent growth), your $35k cash investment doubles in ~7 years — after that, you're playing with house money.
Negotiation context
- It's been on market 69 days — a 6% lower offer ($117k) is reasonable based on typical stale-listing flexibility.
- 10 sale attempts since 7y ago; this cycle's ask has dropped $31k (20%) from the opening price — seller is motivated, your offer sets the floor, not the list.
Risks & watch-outs
- Watch-outs: built in 1955 — expect roof / HVAC / electrical / plumbing capex.
- Climate carrying-cost: extreme-heat days projected 7→19/yr by 2055 (HVAC capex compounding) — expect insurance premiums to compound above CPI over the hold.
Questions for the listing agent
- It's been on market 69 days. Have you received any prior offers? Is the seller open to a 6% concession, seller financing, or rate buy-down credit?
- Built in 1955 — when were the roof, HVAC, electrical panel, plumbing, and water heater last replaced?
- Why hasn't it sold? Are there any deal-killer items the seller is aware of (foundation, flood, title, zoning, code violations)?
- Is there a deadline driving the sale (1031 exchange, divorce, estate, relocation)? That informs how much negotiation room exists.
- What's the average days-on-market for RENTAL listings here right now (not sales)? A rising rental-DOM trend means longer vacancies and softer asking-rent achievability than the comps imply.
- What's the recent tenant-quality profile in this submarket — average credit score on applications, eviction rate, late-payment / NSF rate, and stable-employment percentage? A property-management company in the area should have these aggregated.
- How much new for-sale + rental construction is in the pipeline within 1–3 miles? Heavy new supply typically softens prices + rents 12–24 months out; constrained supply supports both.
Investment metrics
- 1% rule
- 1.37% ✓
- Cap rate
- 11.19%
- Cash-on-cash
- 17.48%
- DSCR
- 1.78
- GRM
- 6.1
CMA / ARV
- ARV (on-the-fly)
- $158,688
- Comps found
- 9
Show comp detail 9 sales within ~0.75 mi
| Address | Dist | Beds/Ba | Sqft | Sold | Price | $/sf | Match |
|---|---|---|---|---|---|---|---|
| 302 Glenwood Dr | 0.12mi | 3/2.0 | 944 (+4%) | 1mo | $180,000 | $191 | 83 |
| 508 Edgebrook Dr | 0.15mi | 3/1.0 | 1,024 (+12%) | 5mo | $150,000 | $146 | 68 |
| 409 Locust St | 0.54mi | 3/1.0 | 900 (-1%) | 12mo | $180,000 | $200 | 63 |
| 810 Charlene Dr | 0.34mi | 3/1.0 | 1,000 (+10%) | 8mo | $174,000 | $174 | 62 |
| 207 Otter Creek Rd | 0.45mi | 2/1.0 (-1) | 932 (+2%) | 13mo | $85,000 | $91 | 60 |
| 304 Brown St | 0.51mi | 2/1.0 (-1) | 822 (-10%) | 3mo | $149,999 | $182 | 52 |
| 106 Debbie Dr | 0.38mi | 3/1.0 | 1,029 (+13%) | 13mo | $172,750 | $168 | 50 |
| 401 Highland Ave | 0.71mi | 2/1.0 (-1) | 962 (+6%) | 9mo | $175,000 | $182 | 45 |
| 324 High St | 0.71mi | 2/1.0 (-1) | 960 (+5%) | 16mo | $50,000 | $52 | 40 |
Match score weights: distance 35% · size 25% · config 20% · recency 20%. Top-matched comps best support the ARV.
Projected returns pro-forma
-3.0% appreciation · 3.0% rent growth · sell at horizon
- IRR
- 8.9%
- Equity multiple
- 1.35×
- Total profit
- $12,132
- Equity at exit
- $18,489
- IRR
- 18.1%
- Equity multiple
- 2.50×
- Total profit
- $52,088
- Equity at exit
- $10,721
Cash invested: $34,720 (down + closing). Projections, not guarantees.
Landlord ↔ Tenant lean methodology
- Overall (STATE)
- 83 Strongly Landlord-Friendly
- State Kentucky
- 83 Strongly Landlord-Friendly · R+16
- County
- — inherits STATE
- City
- — inherits STATE
ZIP-level market 40175
- Home prices YoY
- -6.3%
- Active inventory
- 155
- Price-to-rent
- 6.1×
Monthly cashflow live
- Estimated rent
- $1,694 medium interval (Pro) →
- Mortgage (P&I)
- −$650
- Tax from tax record
- −$130 /mo · $1,564/yr
- Insurance
- −$52
- HOA
- −$0
- Vacancy / Maint / Mgmt
- −$356
- Net cashflow
- $506
Break-even live
UW: 25.0% down · 7.5% · 30yr · 1.5% tax · 5.0% vac · 8.0% maint · 8.0% mgmt
Financing live
Cash to close
- Down payment
- $31,000
- Closing costs
- $3,720
- Reserves months
- —
- Total cash needed
- —
Loan-product check · same deal, 3 products live
Conventional
25% down · 7.5% · 30yr
- Down + closing
- —
- Monthly P&I
- —
- Monthly cashflow
- —
- DSCR
- —
- Eligible?
- —
Personal DTI + credit; lowest rate.
DSCR
20% down · 8.5% · 30yr
- Down + closing
- —
- Monthly P&I
- —
- Monthly cashflow
- —
- DSCR
- —
- Eligible?
- —
No personal income docs; deal must DSCR.
Hard money
10% down · 12.0% · 12mo
- Down + closing
- —
- Monthly P&I
- —
- Monthly cashflow
- —
- DSCR
- —
- Eligible?
- —
Short-term bridge; refi at stabilization.
Listing history 28 events
-
2026-05-05price $124,000
-
2026-04-27price $124,000 435-char remark
Show marketing remark (435 chars)
Move-in ready and full of potential, 401 Knox Ave in Vine Grove features neutral paint and flooring throughout, creating a bright, clean canvas for your personal style. This home offers a functional layout with inviting living spaces and plenty of natural light. Tucked into a quiet, established neighborhood yet close to local amenities, it's perfect for first-time buyers, downsizers, or investors looking for a turn-key opportunity.
-
2026-03-18$155,000 Active
Show marketing remark (435 chars)
Move-in ready and full of potential, 401 Knox Ave in Vine Grove features neutral paint and flooring throughout, creating a bright, clean canvas for your personal style. This home offers a functional layout with inviting living spaces and plenty of natural light. Tucked into a quiet, established neighborhood yet close to local amenities, it's perfect for first-time buyers, downsizers, or investors looking for a turn-key opportunity.
-
2026-03-18$155,000 Active 435-char remark
Show marketing remark (435 chars)
Move-in ready and full of potential, 401 Knox Ave in Vine Grove features neutral paint and flooring throughout, creating a bright, clean canvas for your personal style. This home offers a functional layout with inviting living spaces and plenty of natural light. Tucked into a quiet, established neighborhood yet close to local amenities, it's perfect for first-time buyers, downsizers, or investors looking for a turn-key opportunity.
-
2024-02-21status Active
-
2024-02-06status Pending
-
2024-02-06historical
-
2024-02-02price $179,900
-
2024-01-26$184,900 Active
-
2023-07-07soldstatus $165,000 Closed
-
2023-07-06soldstatus $165,000
-
2023-06-30soldstatus $165,000 Closed
-
2023-05-12status Pending
-
2023-05-12status Pending
-
2023-05-11status Active
-
2023-05-11price $154,999
-
2023-05-10price $154,998
-
2023-05-03price $169,998
-
2023-05-03historical
-
2023-05-03$169,999 Active
-
2023-04-17$169,999 Active
-
2021-06-15soldstatus $135,000
-
2021-05-21soldstatus $135,000
-
2021-04-14$135,000
-
2019-01-24soldstatus $20,000
-
2019-01-24soldstatus $20,000
-
2019-01-04$56,000
-
2019-01-04$56,000
ⓘ Source: listings_history table (triggers on properties + properties_extension) + one-shot
backfill from property_details.listing_events for pre-trigger history.
Tax reassessment forecast KY · Resets to sale price
- Current annual tax
- $1,564 · $130/mo
- Projected year-2 tax
- $1,564 · $130/mo
- Expected delta
- $0/yr ($0/mo · 0.0%)
ⓘ Screening estimate from a state-policy table — verify with the county assessor before closing.
Climate risk First Street
- Flood 1/10 Low FEMA zone X (unshaded) · 0% chance over 30 yrs
- Wildfire 3/10 Moderate
- Heat 5/10 Major 7 d/yr ≥105°F today · 19 d/yr by 30 yrs out
- Wind 2/10 Low 4% chance of damaging wind over 30 yrs
- Air quality 2/10 Low 0 unhealthy d/yr today · 1 by 30 yrs out
Nearby sold comps map
Loading sold comps map…
Walkable amenities ~0.75 mi
Loading nearby amenities…
Taxation est. · year 1
- Rental income
- $20,325
- − Mortgage interest
- −$6,946
- − Property taxes
- −$1,564
- − Insurance
- −$620
- − Repairs & maintenance
- −$1,626
- − Management
- −$1,626
- − Depreciation
- −$3,607
- Taxable income
- $4,336
- Est. tax owed @ 24.0%
- −$1,041
- After-tax cash flow
- $5,029/yr
For passive investors: Depreciation is non-cash, so a rental often shows a tax loss while cash-flowing — sheltering income. Rental losses are passive: they offset passive income freely, and up to $25,000/yr can offset ordinary (W-2) income if you actively participate and your MAGI is under $100k (phasing out to $0 by $150k); unused losses carry forward. On sale, claimed depreciation is recaptured at up to 25%, and gains may owe capital-gains tax (a 1031 exchange can defer both). Figures are a year-1 estimate at your 24.0% rate — not tax advice; consult a CPA.
Schools (NCES district)
- District
- Hardin County
- NCES district ID
- 2102490
- Math proficiency
- 30% ▼ -13.00%
- Reading proficiency
- 43% ▼ -10.00%
- Median HH income
- $50,728
- Composite
- 31.61/100
- National rank
- #5945
- State rank
- #47 of 165 in KY
Livability — Vine Grove
- Score
- 72/100
- State rank
- #124
- US rank
- #5837
Category grades
Schools grade is shown separately in the Schools card above.
Census & demographics
- Census place
- Vine Grove, KY
- Population (ZIP)
- 16,283
Population outlook (Hardin County) Hauer SSP2
- Today (2025)
- 105,573 people
- By 2030
- 103,563 · -1.9%
- By 2040
- 97,077 · -8.0%
- By 2050
- 88,367 · -16.3%
- By 2075
- 65,405 · -38.0%
- By 2100
- 42,245 · -60.0%
Race, ethnicity, and origin ACS 2023
- Neighborhood character
- Predominantly White (81%)
- Race & ethnicity
- White 81% Black 9% Two or more races 7% Hispanic / Latino 2% Asian 2%
- Common ancestry
- Italian 2% Slovak 2% Serbian 1%
- Foreign-born
- 3% · South Korea, Canada
- Languages at home
- 95% English-only · Spanish 2% Tagalog/Filipino 1% German/W. Germanic 1%
Political lean MEDSL · Hardin
- 2024 margin
- Strong R (+29.3) · D 34.5% · R 63.8% · Other 1.7%
- 2008→2024 swing
- -8.7pp toward R · 2008: -20.6pp · 2024: -29.3pp
- All cycles
- 2024: R+29.3 2020: R+24.0 2016: R+30.2 2012: R+20.8 2008: R+20.6
Not yet ingested
- Civics
- —
Market trends
- HPI YoY
- ▼ -16.55%
- Current HPI
- 246.3715
- Rent YoY
- —
- Metro
- —
- State GDP YoY
- ▲ 1.81%
- F500 in state
- 4
Industry mix (Fortune 500 HQ in KY)
| Industry | F500 HQs | Revenue |
|---|---|---|
| Healthcare | 1 | $118B |
|
||
| Food / Beverage | 1 | $7B |
|
||
Price history
+121.4% since first listed28 events — show timeline
- 2026-05-05 Price Changed $124,000 Metro Search MLS
- 2026-04-27 Price Changed $124,000 HKARMLS
- 2026-03-18 Listed $155,000 HKARMLS
- 2026-03-18 Listed $155,000 Metro Search MLS
- 2024-02-21 Relisted — Metro Search MLS
- 2024-02-06 Pending — Metro Search MLS
- 2024-02-06 Listing Removed — Metro Search MLS
- 2024-02-02 Price Changed $179,900 Metro Search MLS
- 2024-01-26 Listed $184,900 Metro Search MLS
- 2023-07-07 Sold (MLS) $165,000 Metro Search MLS
- 2023-07-06 Sold (Public Records) $165,000 Public Records
- 2023-06-30 Sold (MLS) $165,000 HKARMLS
- 2023-05-12 Pending — HKARMLS
- 2023-05-12 Pending — Metro Search MLS
- 2023-05-11 Relisted — Metro Search MLS
- 2023-05-11 Price Changed $154,999 Metro Search MLS
- 2023-05-10 Price Changed $154,998 HKARMLS
- 2023-05-03 Price Changed $169,998 HKARMLS
- 2023-05-03 Listed $169,999 HKARMLS
- 2023-05-03 Listing Removed — Metro Search MLS
- 2023-04-17 Listed $169,999 Metro Search MLS
- 2021-06-15 Sold (Public Records) $135,000 Public Records
- 2021-05-21 Sold (MLS) $135,000 HKARMLS
- 2021-04-14 Listed $135,000 HKARMLS
- 2019-01-24 Sold (MLS) $20,000 HKARMLS
- 2019-01-24 Sold (MLS) $20,000 Metro Search MLS
- 2019-01-04 Listed $56,000 HKARMLS
- 2019-01-04 Listed $56,000 Metro Search MLS
Property tax history
+28.6%/yrLatest (2025): $1,564 · +0.4% YoY. Source: county tax records.
Cash-flow waterfall
monthlySold comps — $/sqft
last 12 mo · ≤1 miLoading sold comps…