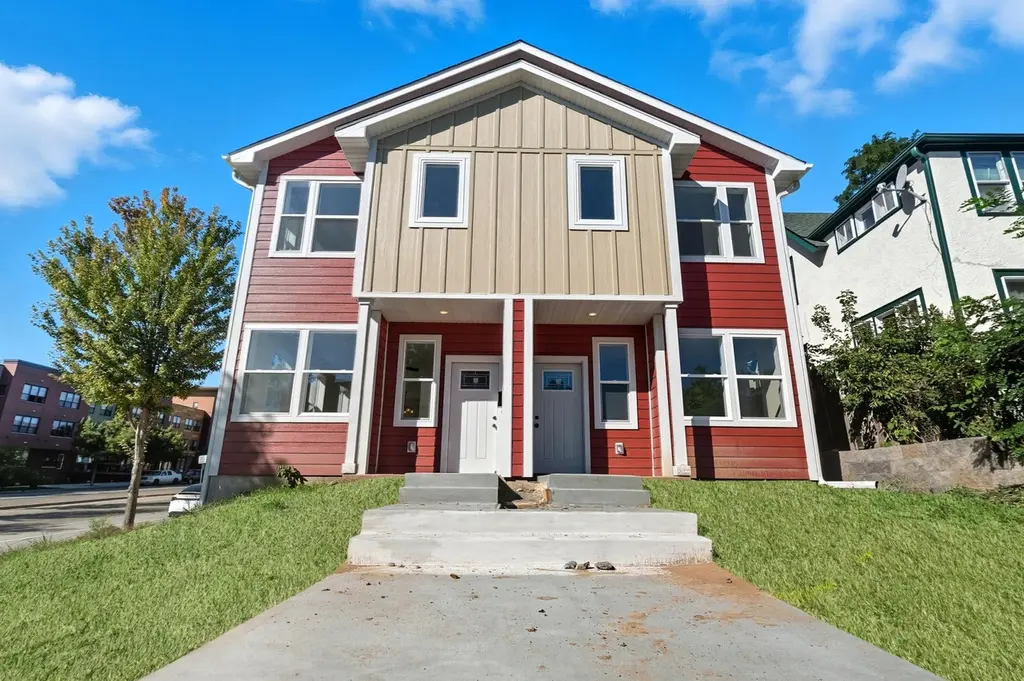
2127 James Ave N · Minneapolis, MN
Flood risk 1/10 · Minimal
- FEMA flood zone
- X (unshaded)
- Chance of flooding over 30 yrs
- 0.0%
- Est. flood insurance / yr
- $507 – $1,088
Fire risk 1/10 · Minimal
- Est. fire insurance / yr
- $888 – $1,650
Heat risk 2/10 · Minimal
- Hot days now (above 99°F)
- 7 days/yr
- Hot days in 30 yrs
- 14 days/yr
Wind risk 2/10 · Minimal
- Chance of severe wind over 30 yrs
- —
Air-quality risk 2/10 · Minimal
- Unhealthy air days now
- 1 days/yr
- Unhealthy air days in 30 yrs
- 1 days/yr
Risk factors via First Street. Map © Google.
Why this score? — see what drove the C+ grade
The composite is a weighted blend of 9 inputs, each scored 0–100. Each bar is that input's sub-score; the figure is the points it added to the 100-point composite (weight × sub-score).
- Cash flow +19.6/30.0
- ARV discount +15.0/15.0
- DSCR +6.2/10.0
- 1% rule +5.2/10.0
- Condition / age +5.0/5.0
- Rent growth +4.3/5.0
- Livability +3.9/5.0
- Schools +3.5/10.0
- Appreciation +0.0/10.0
$170,000
🖨 Deal sheet 📄 Offer letter ✓ Due diligence
Listing remarks
Brand new construction opportunity! If you qualify, this is an opportunity you don’t want to miss!Welcome to 2125 James Avenue North, Minneapolis. This thoughtfully designed new construction home features 2 bedrooms and 2.5 bathrooms with a functional, modern layout and quality finishes throughout. The property includes a detached garage, providing convenient off-street parking and additional storage. Built to meet City of Minneapolis energy-efficiency requirements, this home is ENERGY STAR-rated, offering high-efficiency systems, modern features, and lower utility costs. Enjoy the benefits of new construction, including low-maintenance living and contemporary design. This home is con
Key facts
- 6,098 sq ft lot
- Garage
- Built 2026
Property features AI
Exterior
- Parking: Detached or attached 1-car garage (312 sq ft garage area)
- Utilities: City water (connected); City sewer (connected); Electric fuel
- Home design: Attached residential property; Two levels; New construction; Main entry on the main level
- Construction: Built by JOHN AISH INC; Slab foundation
- Exterior features: Vinyl exterior; Lot dimensions approximately 42 x 115 x 62 x 115; Lot size about 0.14 acres
Interior
- Kitchen: Main-level kitchen
- Bedrooms: Two bedrooms (both on the upper level)
- Bathrooms: Two full bathrooms and one half bathroom
- Heating & cooling: Forced air heating; Central air conditioning
- Interior features: Open living area with main-level living room; Dining room on the main level; No basement
Neighborhood map
What this means for you Summary
Snapshot
- This is a 2-bed/3.0-bath single-family listed at $170k. Condition is rated excellent.
Deal economics
- At list price, monthly cash flow is $196 ($2k/yr) — positive.
- The deal already cash-flows at list — no discount required.
- Meets the 1% rule at list price ($2k rent vs $170k).
- Recommended offer: $165k (3.0% below list) — sets the bar for market timing.
- Cap rate 7.7% vs local median 3.1% in Minneapolis — top-decile yield for the area; either an underpriced asset or a hidden risk that comps aren't pricing in. Stress-test before assuming the spread holds.
Location & tenants
- Location reads 78/100 on livability (#110 in MN, #2,525 nationally) — a middle-class / working-renter tenant base. Strengths: amenities A+, commute A+, housing A+; Watch: cost of living C-, crime F.
- Minneapolis Public School District (urban): math 35% / reading 46% proficiency, ranked #217 of 301 in MN (top 72%) — families likely to look elsewhere, expect single-tenant / working-renter base with shorter leases.
- Market conditions: Rents rising fast (+7.3%/yr); 132 active listings in the ZIP; 38 comparable units currently listed for rent nearby; rentals at typical pace (median 18d on market — plan ~3-4 weeks tenant-placement turnaround); 4,651 units permitted in Hennepin County in 2024 (2,443 in 5+ unit buildings).
- This rent runs 35% of the median local income ($60k/yr) — at the standard rent-burdened threshold; future hikes will face affordability resistance.
Forward outlook
- Local home prices are declining (-3.0%/yr); year-one equity from $1k of loan paydown is wiped out by about $5k of value loss. Plan a longer hold.
- Hennepin County population projected at +30% by 2050 — long-run rental-demand tailwind backs the buy-and-hold thesis.
- At projected returns (-3.0% appreciation + 7.3% rent growth), your $48k cash investment doubles in ~10 years — after that, you're playing with house money.
Negotiation context
- It's been on market 46 days — a 3% lower offer ($165k) is reasonable based on typical stale-listing flexibility.
Questions for the listing agent
- It's been on market 46 days. Have you received any prior offers? Is the seller open to a 3% concession, seller financing, or rate buy-down credit?
- Is there a deadline driving the sale (1031 exchange, divorce, estate, relocation)? That informs how much negotiation room exists.
- Crime grade is F in this area — have there been break-ins, vandalism, or insurance claims at this property in the last 3 years? What carrier currently insures it and at what premium?
- What's the average days-on-market for RENTAL listings here right now (not sales)? A rising rental-DOM trend means longer vacancies and softer asking-rent achievability than the comps imply.
- What's the recent tenant-quality profile in this submarket — average credit score on applications, eviction rate, late-payment / NSF rate, and stable-employment percentage? A property-management company in the area should have these aggregated.
- How much new for-sale + rental construction is in the pipeline within 1–3 miles? Heavy new supply typically softens prices + rents 12–24 months out; constrained supply supports both.
Investment metrics
- 1% rule
- 1.02% ✓
- Cap rate
- 7.68%
- Cash-on-cash
- 4.94%
- DSCR
- 1.22
- GRM
- 8.2
CMA / ARV
- ARV (median comp)
- $253,218
- List price
- $170,000
- Delta
- -32.86%
- Verdict
- UNDERPRICED
- Comps
- 9 within 1.0 mi
Show comp detail 1 sale within ~0.75 mi
| Address | Dist | Beds/Ba | Sqft | Sold | Price | $/sf | Match |
|---|---|---|---|---|---|---|---|
| 2123 Queen Ave N | 0.28mi | 2/1.0 | 1,486 (+8%) | 10mo | $230,000 | $155 | 58 |
Match score weights: distance 35% · size 25% · config 20% · recency 20%. Top-matched comps best support the ARV.
Projected returns pro-forma
-3.0% appreciation · 7.35% rent growth · sell at horizon
- IRR
- -3.8%
- Equity multiple
- 0.85×
- Total profit
- $-7,125
- Equity at exit
- $25,348
- IRR
- 10.3%
- Equity multiple
- 1.96×
- Total profit
- $45,543
- Equity at exit
- $14,698
Cash invested: $47,600 (down + closing). Projections, not guarantees.
Landlord ↔ Tenant lean methodology
- Overall (CITY)
- 34 Tenant-Leaning
- State Minnesota
- 46 Balanced · D+2
- County
- — inherits STATE
- City Minneapolis
- 34 Tenant-Leaning · D+50
ZIP-level market 55411
- Home prices YoY
- -8.7%
- Rents YoY
- 7.3%
- Active inventory
- 132
- Price-to-rent
- 8.2×
Monthly cashflow live
- Estimated rent
- $1,735 high interval (Pro) →
- Mortgage (P&I)
- −$891
- Tax est. 1.5%
- −$212 /mo · $2,550/yr
- Insurance
- −$71
- HOA
- −$0
- Vacancy / Maint / Mgmt
- −$364
- Net cashflow
- $196
Break-even live
UW: 25.0% down · 7.5% · 30yr · 1.5% tax · 5.0% vac · 8.0% maint · 8.0% mgmt
Financing live
Cash to close
- Down payment
- $42,500
- Closing costs
- $5,100
- Reserves months
- —
- Total cash needed
- —
Loan-product check · same deal, 3 products live
Conventional
25% down · 7.5% · 30yr
- Down + closing
- —
- Monthly P&I
- —
- Monthly cashflow
- —
- DSCR
- —
- Eligible?
- —
Personal DTI + credit; lowest rate.
DSCR
20% down · 8.5% · 30yr
- Down + closing
- —
- Monthly P&I
- —
- Monthly cashflow
- —
- DSCR
- —
- Eligible?
- —
No personal income docs; deal must DSCR.
Hard money
10% down · 12.0% · 12mo
- Down + closing
- —
- Monthly P&I
- —
- Monthly cashflow
- —
- DSCR
- —
- Eligible?
- —
Short-term bridge; refi at stabilization.
Rent comps 38 comps
| Address | Beds | Baths | Sqft | Rent | $/sqft | DOM | Units | Dist |
|---|---|---|---|---|---|---|---|---|
| 2000 W Broadway Ave Minneapolis, MN | 2.0 | 1.0 | 952 | $1,350 | $1.42 | 7d | 4 | 0.08mi |
| 1523 22nd Ave N Minneapolis, MN | 3.0 | 1.0 | 943 | $1,695 | $1.80 | 14d | 1 | 0.20mi |
| 1510 N 22nd Ave #1 Minneapolis, MN | 3.0 | 1.0 | 1500 | $1,875 | $1.25 | 4d | 1 | 0.22mi |
| 1510 N 22nd Ave #1 Minneapolis, MN | 3.0 | 1.0 | 1500 | $1,875 | $1.25 | 21d | 1 | 0.22mi |
| 2211 Queen Ave N Unit 1 Minneapolis, MN | 3.0 | 1.0 | 983 | $1,695 | $1.72 | 17d | 1 | 0.29mi |
| 2330 N Irving Ave Minneapolis, MN | 2.0 | 1.0 | 1600 | $1,375 | $0.86 | 7d | 1 | 0.30mi |
| 1709 N 26th Ave Unit 3 Minneapolis, MN | 1.0 | 1.0 | 920 | $1,250 | $1.36 | 43d | 1 | 0.34mi |
| 1312 18th Ave N Minneapolis, MN | 3.0 | 1.0 | 1520 | $1,899 | $1.25 | 7d | 1 | 0.38mi |
| 2124 Fremont Ave N Minneapolis, MN | 2.0 | 1.0 | 1050 | $1,580 | $1.50 | 2d | 1 | 0.42mi |
| 2323 26th Ave N Minneapolis, MN | 2.0 | 1.0 | 807 | $1,717 | $2.13 | 14d | 3 | 0.43mi |
| 1649 Russell Ave N Unit 2 Minneapolis, MN | 3.0 | 1.0 | 1011 | $1,700 | $1.68 | 20d | 1 | 0.46mi |
| 2356 N Thomas Ave Unit 2 Minneapolis, MN | 3.0 | 1.0 | 1000 | $1,800 | $1.80 | 43d | 1 | 0.49mi |
| 1504 Queen Ave N Minneapolis, MN | 3.0 | 1.5 | 1746 | $2,800 | $1.60 | 1d | 1 | 0.53mi |
| 2703 Humboldt Ave N Minneapolis, MN | 3.0 | 1.0 | 1218 | $1,450 | $1.19 | 21d | 1 | 0.55mi |
| 1407 N Girard Ave Unit 2 Minneapolis, MN | 2.0 | 1.0 | 1472 | $1,900 | $1.29 | 17d | 1 | 0.62mi |
| 835 W Broadway Ave Minneapolis, MN | 1.0–2.0 | 1.0–2.0 | 849 | $2,150 | $2.53 | 3d | 7 | 0.67mi |
| 2947 Morgan Ave N Minneapolis, MN | 2.0 | 1.0 | 1106 | $1,950 | $1.76 | 14d | 1 | 0.70mi |
| 1237 Knox Ave N Unit 1237 Minneapolis, MN | 3.0 | 1.0 | 1196 | $1,900 | $1.59 | 4d | 1 | 0.70mi |
| 2419 Plymouth Ave N Minneapolis, MN | 2.0–3.0 | 1.0 | 836 | $1,495 | $1.79 | 4d | 2 | 0.77mi |
| 1816 Zephyr Pl Minneapolis, MN | 3.0 | 1.0 | 1120 | $2,050 | $1.83 | 43d | 1 | 0.84mi |
| 2900 N Colfax Ave Unit 2 Minneapolis, MN | 2.0 | 1.0 | 1200 | $1,345 | $1.12 | 24d | 1 | 0.86mi |
| 1016 N Newton Ave Unit 4 Minneapolis, MN | 3.0 | 1.0 | 1009 | $1,895 | $1.88 | 43d | 1 | 0.86mi |
| 3255 N Logan Ave Unit 2 Minneapolis, MN | 2.0 | 1.0 | 900 | $995 | $1.11 | 17d | 1 | 0.96mi |
| 816 Queen Ave N Minneapolis, MN | 3.0 | 1.0 | 1200 | $1,895 | $1.58 | 43d | 1 | 1.02mi |
| 318 N 27th Ave #2 Minneapolis, MN | 3.0 | 1.0 | 1200 | $1,800 | $1.50 | 4d | 1 | 1.06mi |
| 318 N 27th Ave #2 Minneapolis, MN | 3.0 | 1.0 | 1200 | $1,800 | $1.50 | 43d | 1 | 1.06mi |
| 3342 N Humboldt Ave Unit 2 Minneapolis, MN | 1.0 | 1.0 | 900 | $1,395 | $1.55 | 17d | 1 | 1.10mi |
| 3001 N 3rd St Apt 1 Minneapolis, MN | 2.0 | 1.0 | 900 | $1,250 | $1.39 | 20d | 1 | 1.20mi |
| 2600 France Ave N Unit 2600 Minneapolis, MN | 2.0 | 1.5 | 1100 | $1,599 | $1.45 | 4d | 1 | 1.25mi |
| 2035 W River Rd Minneapolis, MN | 1.0–4.0 | 2.0 | 1034 | $1,730 | $1.67 | 4d | 10 | 1.28mi |
| 414 N 33rd Ave Unit 2 Minneapolis, MN | 2.0 | 1.0 | 1246 | $1,600 | $1.28 | 43d | 1 | 1.32mi |
| 1901 4th Ave N Minneapolis, MN | 3.0 | 2.0 | 1300 | $1,300 | $1.00 | 24d | 1 | 1.35mi |
| 915 Washington Ave N Minneapolis, MN | 2.0 | 2.0–2.5 | 1215 | $2,549 | $2.10 | 1d | 5 | 1.39mi |
| 254 9th Ave N Minneapolis, MN | 1.0 | 1.0 | 922 | $1,937 | $2.10 | 4d | 1 | 1.40mi |
| 2212 Glenwood Ave Unit 1 Minneapolis, MN | 2.0 | 1.0 | 950 | $1,299 | $1.37 | 43d | 1 | 1.41mi |
| 1611 Glenwood Ave #2 Minneapolis, MN | 3.0 | 2.0 | 1800 | $2,100 | $1.17 | 14d | 1 | 1.41mi |
| 1611 Glenwood Ave #1 Minneapolis, MN | 3.0 | 2.0 | 918 | $1,995 | $2.17 | 14d | 1 | 1.41mi |
| 3643 Penn Ave N Minneapolis, MN | 1.0 | 1.0 | 900 | $988 | $1.10 | 43d | 2 | 1.45mi |
Listing history 15 events
-
2026-06-18days on market $170,000 Active 46 DOM
-
2026-06-17days on market $170,000 Active 45 DOM
-
2026-06-16days on market $170,000 Active 44 DOM
-
2026-06-15days on market $170,000 Active 43 DOM
-
2026-06-13days on market $170,000 Active 41 DOM
-
2026-06-09days on market $170,000 Active 37 DOM
-
2026-06-08days on market $170,000 Active 36 DOM
-
2026-06-07days on market $170,000 Active 35 DOM
-
2026-06-04days on market $170,000 Active 32 DOM
-
2026-06-03days on market $170,000 Active 31 DOM
-
2026-06-02days on market $170,000 Active 30 DOM
-
2026-06-01days on market $170,000 Active 29 DOM
-
2026-05-31days on market $170,000 Active 28 DOM
-
2026-05-04$170,000 Active 937-char remark
-
2026-05-01historical $170,000 937-char remark
ⓘ Source: listings_history table (triggers on properties + properties_extension) + one-shot
backfill from property_details.listing_events for pre-trigger history.
Climate risk First Street
- Flood 1/10 Low FEMA zone X (unshaded) · 0% chance over 30 yrs
- Wildfire 1/10 Low
- Heat 2/10 Low 7 d/yr ≥99°F today · 14 d/yr by 30 yrs out
- Wind 2/10 Low
- Air quality 2/10 Low 1 unhealthy d/yr today · 1 by 30 yrs out
Nearby sold comps map
Loading sold comps map…
Walkable amenities ~0.75 mi
Loading nearby amenities…
Taxation est. · year 1
- Rental income
- $20,820
- − Mortgage interest
- −$9,523
- − Property taxes
- −$2,550
- − Insurance
- −$850
- − Repairs & maintenance
- −$1,666
- − Management
- −$1,666
- − Depreciation
- −$4,945
- Taxable loss
- −$380
- Est. tax savings @ 24.0%
- +$91
- After-tax cash flow
- $2,441/yr
For passive investors: Depreciation is non-cash, so a rental often shows a tax loss while cash-flowing — sheltering income. Rental losses are passive: they offset passive income freely, and up to $25,000/yr can offset ordinary (W-2) income if you actively participate and your MAGI is under $100k (phasing out to $0 by $150k); unused losses carry forward. On sale, claimed depreciation is recaptured at up to 25%, and gains may owe capital-gains tax (a 1031 exchange can defer both). Figures are a year-1 estimate at your 24.0% rate — not tax advice; consult a CPA.
Condition & rehab AI · 6 photos
This brand new construction home is in excellent condition with no visible repairs or maintenance needed. The high-quality finishes and modern design make it an attractive investment opportunity.
Value-add opportunities
- Both Paint exterior and interior — Enhances curb appeal and interior aesthetics
- Both Install new flooring in kitchen and bathrooms — Improves functionality and aesthetics
- Both Install new kitchen appliances — Enhances functionality and aesthetics
- Both Install new bathroom fixtures — Enhances functionality and aesthetics
Renovation cost estimate screening
Value-add ROI direction
- Both Paint exterior and interior — Enhances curb appeal and interior aesthetics ↑
- Both Install new flooring in kitchen and bathrooms — Improves functionality and aesthetics ↑
- Both Install new kitchen appliances — Enhances functionality and aesthetics ↑
- Both Install new bathroom fixtures — Enhances functionality and aesthetics ↑
ⓘ Cost ranges are severity-bucket heuristics (US national rule-of-thumb). Get contractor quotes + a written scope before underwriting a rehab budget.
Schools (NCES district)
- District
- Minneapolis Public School District
- NCES district ID
- 2721240
- Math proficiency
- 35% ▼ -7.00%
- Reading proficiency
- 46% ▼ -1.00%
- Median HH income
- $50,521
- Composite
- 34.92/100
- National rank
- #5067
- State rank
- #217 of 301 in MN
Livability — Minneapolis
- Score
- 78/100
- State rank
- #110
- US rank
- #2525
Category grades
Schools grade is shown separately in the Schools card above.
Census & demographics
- Census place
- Minneapolis, MN
- County
- Hennepin County · 1,150,272 people
- City population
- 417,555
- Metro
- Minneapolis-St. Paul-Bloomington, MN-WI
- Population (ZIP)
- 27,741
- Household income
- $60,225
- Rent vs Own
- Severe rent burden
- 1826.0
Population outlook (Hennepin County) Hauer SSP2
- Today (2025)
- 1,405,227 people
- By 2030
- 1,492,650 · +6.2%
- By 2040
- 1,660,157 · +18.1%
- By 2050
- 1,823,498 · +29.8%
- By 2075
- 2,221,283 · +58.1%
- By 2100
- 2,509,976 · +78.6%
Race, ethnicity, and origin ACS 2023
- Neighborhood character
- Diverse neighborhood (Simpson 0.68)
- Race & ethnicity
- Black 49% White 23% Two or more races 11% Hispanic / Latino 11% Asian 9%
- Hispanic origin (detail)
- Mexican 7% Puerto Rican 1%
- Common ancestry
- Portuguese 3% Lithuanian 2% Italian 1%
- Foreign-born
- 19% · Canada, Guatemala
- Languages at home
- 68% English-only · Other Asian/Pacific 8% Spanish 8%
Political lean MEDSL · Hennepin
- 2024 margin
- Solid D (+42.6) · D 70.2% · R 27.5% · Other 2.3%
- 2008→2024 swing
- +14.0pp toward D · 2008: 28.6pp · 2024: 42.6pp
- All cycles
- 2024: D+42.6 2020: D+43.2 2016: D+35.3 2012: D+27.1 2008: D+28.6
Not yet ingested
- Civics
- —
Market trends
- HPI YoY
- ▼ -33.91%
- Current HPI
- 356.6758
- Rent YoY
- ▲ 7.35%
- Metro
- Minneapolis-St. Paul-Bloomington, MN-WI
- State GDP YoY
- ▲ 2.41%
- F500 in state
- 34
Industry mix (Fortune 500 HQ in MN)
| Industry | F500 HQs | Revenue |
|---|---|---|
| Healthcare | 2 | $407B |
|
||
| Retail | 2 | $150B |
|
||
| Consumer Goods | 2 | $32B |
|
||
| Industrial Machinery | 2 | $6B |
|
||
| Agriculture | 1 | $40B |
|
||
| Healthcare / Medical Devices | 1 | $32B |
|
||
Price history
+0.0% since first listed2 events — show timeline
- 2026-05-04 Listed $170,000 NORTHSTARMLS as Distributed by MLS Grid
- 2026-05-01 Coming Soon $170,000 NORTHSTARMLS as Distributed by MLS Grid
Cash-flow waterfall
monthlySold comps — $/sqft
last 12 mo · ≤1 miLoading sold comps…