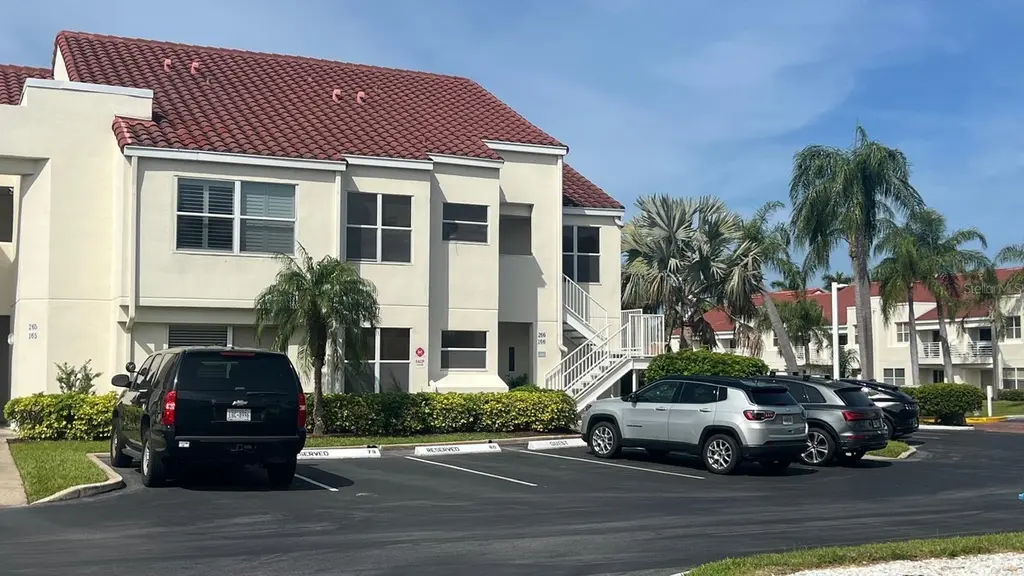
6047 Bahia Del Mar Blvd #266 · St. Petersburg, FL
Flood risk 6/10 · Moderate
- FEMA flood zone
- X (shaded)
- Chance of flooding over 30 yrs
- 0.53%
- Est. flood insurance / yr
- $507 – $1,088
Fire risk 1/10 · Minimal
- Est. fire insurance / yr
- $947 – $1,759
Heat risk 10/10 · Severe
- Hot days now (above 106°F)
- 7 days/yr
- Hot days in 30 yrs
- 27 days/yr
Wind risk 10/10 · Severe
- Chance of severe wind over 30 yrs
- 99.0%
Air-quality risk 3/10 · Minor
- Unhealthy air days now
- 3 days/yr
- Unhealthy air days in 30 yrs
- 3 days/yr
Risk factors via First Street. Map © Google.
Why this score? — see what drove the D grade
The composite is a weighted blend of 9 inputs, each scored 0–100. Each bar is that input's sub-score; the figure is the points it added to the 100-point composite (weight × sub-score).
- Cash flow +10.0/30.0
- ARV discount +7.5/15.0
- 1% rule +5.8/10.0
- Appreciation +4.9/10.0
- Schools +4.3/10.0
- DSCR +2.8/10.0
- Rent growth +2.5/5.0
- Livability +2.5/5.0
- Condition / age +2.5/5.0
$349,900
🖨 Deal sheet (PDF) 📄 Offer letter ✓ Due diligence
Listing remarks
This is beautiful Vista Verde East on Isla Del Sol, an inviting community surrounded by the beauty of an 18-hole golf course. This second-floor, furnished two-bedroom, two-bath condo is your perfect vacation getaway or income producing property. Relax on the private balcony overlooking a peaceful pond. Enjoy your primary suite featuring an en-suite bath and a generous walk-in closet. The in-unit laundry closet adds everyday convenience. Included in your monthly HOA Fee is Cable TV, Community Pool, Escrow Reserve Funds, Insurance, Internet, Exterior, Ground and Pool Maintenance, Sewer, Water Trash. Nestled within the Isla Del Sol Golf, Yacht & Tennis Club community, where optional memb
Key facts
- Community pool
- Private balcony
- Walk-in closet
Tags
Property features AI
Finance
- Other: Directions: From the Pinellas Bayway, go south towards Ft Desoto. Turn Right into Bahia Del Mar. Follow Bahia Del Mar to Vista Verde East. Turn right and go to building
- Financial info: Total monthly fees: $709; Total annual fees: $8,508; Lease restrictions apply
- HOA & community: HOA: Resource Property Assc.; Monthly condo/association fee of $709 (monthly); Association approval required; Association amenities include pool, maintenance, cable TV, and security; Association fees cover cable TV, common area taxes, reserves, insurance, structure & grounds maintenance, pest control, pool, security, sewer, trash and water; Community features: pool, golf (golf carts OK), irrigation with reclaimed water, street lights; Pets allowed (max weight 35 lbs)
Exterior
- Parking: Electric vehicle charging stations; Guest parking available; Reserved parking
- Security: Community security included in association services
- Utilities: Public sewer; Cable connected; Electricity connected; Phone available; Sewer connected; Water connected; Sprinkler recycled; Fire hydrant nearby; Water source: see remarks
- Home design: Residential condominium; One story (levels: One); Unit on 2nd floor; Northeast-facing
- Construction: Stucco and frame construction; Tile roof; Slab foundation; Completed property
- Exterior features: Balcony; Sliding doors; Exterior storage; Mature landscaping with trees; Near marina; Paved surfaces; Landscaped grounds; On golf course; Located on a pond with water views; Intracoastal waterway access
Interior
- Kitchen: Dishwasher; Disposal; Microwave; Range; Refrigerator; Electric water heater; Eat-in kitchen
- Bedrooms: 2 bedrooms
- Flooring: Tile flooring; Wood flooring
- Bathrooms: 2 full bathrooms
- Heating & cooling: Central heating (electric); Central air conditioning
- Interior features: Ceiling fans; Eat-in kitchen; Living room/dining room combo; Vaulted ceilings; Walk-in closets; Window treatments (blinds)
- Laundry & utility: Washer hookup; Electric dryer hookup; Washer and dryer listed among appliances
Neighborhood map
What this means for you Summary
Snapshot
- This is a 2-bed/2.0-bath condo listed at $350k.
Deal economics
- At list price, monthly cash flow is $-212 ($-3k/yr) — negative.
- To cash-flow at today's rent, offer at most $312k (10.7% below list).
- Meets the 1% rule at list price ($4k rent vs $350k).
- Recommended offer: $312k (10.7% below list) — sets the bar for cash-flow.
- Cap rate 5.6% vs local median 2.6% in St. Petersburg — top-decile yield for the area; either an underpriced asset or a hidden risk that comps aren't pricing in. Stress-test before assuming the spread holds.
Location & tenants
- Location reads: area grade D — affects rentability + tenant quality, not the cash-flow math above.
- Pinellas (suburban): math 51% / reading 51% proficiency, ranked #31 of 73 in FL (top 42%) — acceptable for families but not a draw, mixed tenant base, ~2y average lease.
- Zoned schools: Gulfport Montessori Elementary School (math 35% / reading 33%, grade F, #1,744 of 2,144 statewide, top 82%, 435 students, 86% FRL); Bay Point Middle School (math 38% / reading 38%, grade F, #388 of 571 statewide, top 69%, 770 students, 69% FRL); Lakewood High School (math 27% / reading 44%, grade F, #367 of 667 statewide, top 57%, 915 students, 59% FRL) — zoned schools average 71% FRL vs 48% district-wide (23 pts higher); higher-poverty schools than district average — tighter screening recommended.
- Zoned-school proficiency averages 36% at this address vs 51% district-wide (-15 pts) — the specific schools serving this property underperform the Pinellas average; the district grade overstates school quality for this exact location.
- Market conditions: 285 active listings in the ZIP; 40 comparable units currently listed for rent nearby; rentals at typical pace (median 26d on market — plan ~3-4 weeks tenant-placement turnaround); solid renter incomes; 2,676 units permitted in Pinellas County in 2024 (1,422 in 5+ unit buildings).
Forward outlook
- In year one you build about $2k of equity ($2k loan paydown + $-542 appreciation (-0.1% local appreciation)).
- Pinellas County population projected at +14% by 2050 — modest demand growth; plan on rents tracking national, not racing it.
- By year 10, paydown + projected appreciation supports a ~$31k cash-out refi (75% LTV) — recoverable capital for the next deal without selling this one.
Negotiation context
- It's been on market 75 days — a 6% lower offer ($329k) is reasonable based on typical stale-listing flexibility.
- 3 sale attempts since 21y ago with the ask held roughly flat each time — persistent listings suggest the price (not the market) is what's stuck; bring a comps-based counter.
- Current owner paid $200k; list at $350k implies a 75% gain — meaningful room to come down on a strong offer.
Risks & watch-outs
- Climate carrying-cost: major flood risk; severe wind risk, 99% chance of damaging wind over 30y; extreme-heat days projected 7→27/yr by 2055 (HVAC capex compounding) — expect insurance premiums to compound above CPI over the hold.
Questions for the listing agent
- What do current leases actually rent for vs. the listed asking? Can we see a recent rent roll and the last 12 months of T-12 income?
- It's been on market 75 days. Have you received any prior offers? Is the seller open to a 11% concession, seller financing, or rate buy-down credit?
- What does the HOA fee cover, when was the last increase, and are there any pending special assessments or reserve-fund shortfalls?
- Any open or pending special assessments — roof, HVAC, plumbing, elevator, façade? What's the per-unit balance and payoff schedule, and is the seller paying it off at close or rolling it to the buyer?
- Why hasn't it sold? Are there any deal-killer items the seller is aware of (foundation, flood, title, zoning, code violations)?
- Is there a deadline driving the sale (1031 exchange, divorce, estate, relocation)? That informs how much negotiation room exists.
- The area grade is low — what's the realistic commute time and amenity access for the typical tenant pool here? Any planned neighborhood developments (good or bad) we should know about?
- What's the average days-on-market for RENTAL listings here right now (not sales)? A rising rental-DOM trend means longer vacancies and softer asking-rent achievability than the comps imply.
- What's the recent tenant-quality profile in this submarket — average credit score on applications, eviction rate, late-payment / NSF rate, and stable-employment percentage? A property-management company in the area should have these aggregated.
- How much new apartment / multifamily construction is in the pipeline within 1–3 miles? Heavy new supply (>2% of stock underway) typically softens rents 12–24 months out; light construction supports rent growth.
Investment metrics
- 1% rule
- 1.08% ✓
- Cap rate
- 5.56%
- Cash-on-cash
- -2.60%
- DSCR
- 0.88
- GRM
- 7.7
CMA / ARV
No comps found within radius.
Projected returns pro-forma
-0.15% appreciation · 3.0% rent growth · sell at horizon
- IRR
- -5.7%
- Equity multiple
- 0.74×
- Total profit
- $-25,766
- Equity at exit
- $98,899
- IRR
- 0.5%
- Equity multiple
- 1.05×
- Total profit
- $5,356
- Equity at exit
- $116,746
Cash invested: $97,972 (down + closing). Projections, not guarantees.
Landlord ↔ Tenant lean methodology
- Overall (STATE)
- 87 Strongly Landlord-Friendly
- State Florida
- 87 Strongly Landlord-Friendly · R+3
- County
- — inherits STATE
- City
- — inherits STATE
ZIP-level market 33715
- Home prices YoY
- -0.1%
- Active inventory
- 285
- Price-to-rent
- 7.7×
Monthly cashflow live
- Estimated rent
- $3,763 high interval (Pro) →
- Mortgage (P&I)
- −$1,835
- Tax from tax record
- −$495 /mo · $5,940/yr
- Insurance
- −$146
- HOA
- −$709
- Vacancy / Maint / Mgmt
- −$790
- Net cashflow
- $-212
Break-even live
Sensitivity live
| Price | -10% $-14 | -5% $-113 | +0% $-212 | +5% $-311 | +10% $-410 |
|---|---|---|---|---|---|
| Rent | -10% $-510 | -5% $-361 | +0% $-212 | +5% $-64 | +10% $85 |
| Rate | -1.0pp $-36 | -0.5pp $-123 | base $-212 | +0.5pp $-303 | +1.0pp $-395 |
UW: 25.0% down · 7.5% · 30yr · 1.5% tax · 5.0% vac · 8.0% maint · 8.0% mgmt
Financing live
Cash to close
- Down payment
- $87,475
- Closing costs
- $10,497
- Reserves months
- —
- Total cash needed
- —
Loan-product check · same deal, 3 products live
Conventional
25% down · 7.5% · 30yr
- Down + closing
- —
- Monthly P&I
- —
- Monthly cashflow
- —
- DSCR
- —
- Eligible?
- —
Personal DTI + credit; lowest rate.
DSCR
20% down · 8.5% · 30yr
- Down + closing
- —
- Monthly P&I
- —
- Monthly cashflow
- —
- DSCR
- —
- Eligible?
- —
No personal income docs; deal must DSCR.
Hard money
10% down · 12.0% · 12mo
- Down + closing
- —
- Monthly P&I
- —
- Monthly cashflow
- —
- DSCR
- —
- Eligible?
- —
Short-term bridge; refi at stabilization.
Rent comps 40 comps
| Address | Beds | Baths | Sqft | Rent | $/sqft | DOM | Units | Dist |
|---|---|---|---|---|---|---|---|---|
| 6357 Bahia del Mar Blvd St Petersburg, FL | 1.0–2.0 | 1.5–2.0 | 915 | $7,000 | $7.65 | 26d | 2 | 0.05mi |
| 6294 Bahia del Mar Cir St Petersburg, FL | 2.0 | 2.0 | 945 | $4,142 | $4.38 | 26d | 3 | 0.06mi |
| 6073 Bahia del Mar Blvd #129 Saint Petersburg, FL | 2.0 | 2.0 | 1145 | $2,200 | $1.92 | 26d | 1 | 0.06mi |
| 6281 Bahia del Mar Blvd #208 Saint Petersburg, FL | 2.0 | 2.0 | 890 | $2,100 | $2.36 | 26d | 1 | 0.06mi |
| 6295 Bahia del Mar Cir St Petersburg, FL | 1.0–2.0 | 1.0–2.0 | 915 | $7,110 | $7.77 | 26d | 6 | 0.07mi |
| 6059 Bahia del Mar Blvd #241 Saint Petersburg, FL | 2.0 | 2.0 | 1070 | $5,170 | $4.83 | 19d | 1 | 0.07mi |
| 6077 Bahia del Mar Blvd St Petersburg, FL | 2.0 | 2.0 | 1107 | $2,198 | $1.98 | 14d | 2 | 0.08mi |
| 6361 Bahia del Mar Blvd St Petersburg, FL | 1.0–2.0 | 1.5–2.0 | 835 | $5,800 | $6.95 | 4d | 3 | 0.10mi |
| 6273 Bahia del Mar Blvd #216 Saint Petersburg, FL | 2.0 | 2.0 | 915 | $5,700 | $6.23 | 26d | 1 | 0.11mi |
| 6141 Bahia del Mar Blvd #229 Saint Petersburg, FL | 2.0 | 2.0 | 1145 | $6,090 | $5.32 | 26d | 1 | 0.15mi |
| 6141 Bahia Del Mar Blvd S Unit 1546330P St. Petersburg, FL | 2.0 | 2.0 | 1140 | $2,631 | $2.31 | 9d | 1 | 0.15mi |
| 6365 Bahia del Mar Blvd St Petersburg, FL | 1.0–2.0 | 1.5–2.0 | 827 | $2,500 | $3.02 | 19d | 3 | 0.16mi |
| 6291 Bahia del Mar Cir St Petersburg, FL | 2.0 | 2.0 | 1222 | $3,830 | $3.13 | 26d | 2 | 0.16mi |
| 6107 Mirada Cir Saint Petersburg, FL | 3.0 | 2.5 | 1320 | $3,200 | $2.42 | 6d | 1 | 0.16mi |
| 6100 Bahia del Mar Cir #103 Saint Petersburg, FL | 2.0 | 2.5 | 1145 | $5,580 | $4.87 | 6d | 1 | 0.18mi |
| 6100 Bahia del Mar Cir St Petersburg, FL | 2.0 | 2.0–2.5 | 1145 | $4,038 | $3.53 | 26d | 2 | 0.18mi |
| 6151 Bahia del Mar Blvd St Petersburg, FL | 2.0 | 2.0 | 1107 | $4,540 | $4.10 | 26d | 3 | 0.19mi |
| 6287 Bahia del Mar Cir #311 St Petersburg, FL | 2.0 | 2.0 | 890 | $2,100 | $2.36 | 6d | 1 | 0.21mi |
| 6287 Bahia del Mar Cir #312 Saint Petersburg, FL | 2.0 | 2.0 | 890 | $3,200 | $3.60 | 6d | 1 | 0.21mi |
| 6382 Palma del Mar Blvd S #222 Saint Petersburg, FL | 2.0 | 2.0 | 890 | $2,200 | $2.47 | 26d | 1 | 0.23mi |
| 5901 Bahia del Mar Cir #122 Saint Petersburg, FL | 2.0 | 2.0 | 1080 | $3,500 | $3.24 | 26d | 1 | 0.24mi |
| 5901 Bahia del Mar Cir #124 Saint Petersburg, FL | 2.0 | 2.0 | 1150 | $2,500 | $2.17 | 26d | 1 | 0.24mi |
| 5901 Bahia del Mar Cir #223 Saint Petersburg, FL | 2.0 | 2.0 | 1080 | $7,860 | $7.28 | 26d | 1 | 0.24mi |
| 5901 Bahia del Mar Cir #422 Saint Petersburg, FL | 2.0 | 2.0 | 1080 | $7,860 | $7.28 | 26d | 1 | 0.24mi |
| 5901 Bahia del Mar Cir #518 Saint Petersburg, FL | 2.0 | 2.0 | 1080 | $3,000 | $2.78 | 26d | 1 | 0.24mi |
| 6343 Palma del Mar Blvd S #228 Saint Petersburg, FL | 2.0 | 2.0 | 890 | $2,395 | $2.69 | 26d | 1 | 0.25mi |
| 6343 Palma del Mar Blvd S #226 Saint Petersburg, FL | 2.0 | 2.0 | 890 | $2,235 | $2.51 | 19d | 1 | 0.25mi |
| 6191 Bahia del Mar Blvd #205 Saint Petersburg, FL | 2.0 | 2.0 | 1070 | $3,400 | $3.18 | 26d | 1 | 0.27mi |
| 5900 Bahia del Mar Cir #138 St Petersburg, FL | 2.0 | 2.0 | 1075 | $5,070 | $4.72 | 6d | 1 | 0.27mi |
| 6061 Bahia del Mar Cir #347 St Petersburg, FL | 2.0 | 2.0 | 1080 | $2,300 | $2.13 | 6d | 1 | 0.27mi |
| 6061 Bahia del Mar Cir #448 St Petersburg, FL | 2.0 | 2.0 | 1150 | $7,530 | $6.55 | 6d | 1 | 0.27mi |
| 6083 Bahia del Mar Cir #460 St Petersburg, FL | 2.0 | 2.0 | 1215 | $7,460 | $6.14 | 6d | 1 | 0.28mi |
| 6083 Bahia del Mar Cir #159 Saint Petersburg, FL | 2.0 | 2.0 | 1135 | $8,310 | $7.32 | 26d | 1 | 0.28mi |
| 6061 Bahia del Mar Cir #146 Saint Petersburg, FL | 2.0 | 2.0 | 1080 | $2,600 | $2.41 | 26d | 1 | 0.28mi |
| 6081 Bahia del Mar Cir #456 Saint Petersburg, FL | 2.0 | 2.0 | 1150 | $3,000 | $2.61 | 26d | 1 | 0.28mi |
| 6000 Bahia del Mar Cir St Petersburg, FL | 2.0 | 2.0 | 1107 | $4,195 | $3.79 | 9d | 2 | 0.28mi |
| 6000 Bahia del Mar Cir St Petersburg, FL | 2.0 | 2.0 | 1107 | $4,095 | $3.70 | 26d | 3 | 0.28mi |
| 6372 Palma Del Mar Blvd S Unit 1545876P St. Petersburg, FL | 2.0 | 2.0 | 882 | $2,258 | $2.56 | 16d | 1 | 0.29mi |
| 6372 Palma Del Mar Blvd S Unit 1546269P St. Petersburg, FL | 1.0 | 1.0 | 721 | $2,581 | $3.58 | 16d | 1 | 0.29mi |
| 6269 Palma del Mar Blvd S #104 Saint Petersburg, FL | 2.0 | 2.0 | 890 | $2,500 | $2.81 | 6d | 1 | 0.29mi |
HOA detail condo
- Monthly dues
- $709 · $8,508/yr
- Likely covers
- watersewertrashinternetcablepool
- Assessments
- None detected in remarks — confirm with the listing agent.
Listing history 19 events
-
2026-06-22days on market $349,900 Active 75 DOM
-
2026-06-18days on market $349,900 Active 72 DOM
-
2026-06-17days on market $349,900 Active 71 DOM
-
2026-06-16days on market $349,900 Active 70 DOM
-
2026-06-15days on market $349,900 Active 69 DOM
-
2026-06-13days on market $349,900 Active 67 DOM
-
2026-06-09days on market $349,900 Active 63 DOM
-
2026-06-08days on market $349,900 Active 62 DOM
-
2026-06-07days on market $349,900 Active 61 DOM
-
2026-06-04days on market $349,900 Active 58 DOM
-
2026-06-03days on market $349,900 Active 57 DOM
-
2026-06-01days on market $349,900 Active 55 DOM
-
2026-05-31days on market $349,900 Active 54 DOM
-
2026-04-07$349,900 Active
-
2020-12-28soldstatus $200,000
-
2005-08-13$365,000
-
2005-05-09$345,000
-
1996-11-19soldstatus $95,000
-
1988-04-15soldstatus $75,900
ⓘ Source: listings_history table (triggers on properties + properties_extension) + one-shot
backfill from property_details.listing_events for pre-trigger history.
Tax reassessment forecast FL · Resets to sale price
- Current annual tax
- $5,940 · $495/mo
- Projected year-2 tax
- $5,940 · $495/mo
- Expected delta
- $0/yr ($0/mo · 0.0%)
ⓘ Screening estimate from a state-policy table — verify with the county assessor before closing.
Climate risk First Street
- Flood 6/10 Major FEMA zone X (shaded) · 53% chance over 30 yrs
- Wildfire 1/10 Low
- Heat 10/10 Extreme 7 d/yr ≥106°F today · 27 d/yr by 30 yrs out
- Wind 10/10 Extreme 99% chance of damaging wind over 30 yrs
- Air quality 3/10 Moderate 3 unhealthy d/yr today · 3 by 30 yrs out
Nearby sold comps map
Loading sold comps map…
Walkable amenities ~0.75 mi
Loading nearby amenities…
Taxation est. · year 1
- Rental income
- $45,152
- − Mortgage interest
- −$19,600
- − Property taxes
- −$5,940
- − Insurance
- −$1,750
- − Repairs & maintenance
- −$3,612
- − Management
- −$3,612
- − HOA
- −$8,508
- − Depreciation
- −$10,179
- Taxable loss
- −$8,049
- Est. tax savings @ 24.0%
- +$1,932
- After-tax cash flow
- $-615/yr
For passive investors: Depreciation is non-cash, so a rental often shows a tax loss while cash-flowing — sheltering income. Rental losses are passive: they offset passive income freely, and up to $25,000/yr can offset ordinary (W-2) income if you actively participate and your MAGI is under $100k (phasing out to $0 by $150k); unused losses carry forward. On sale, claimed depreciation is recaptured at up to 25%, and gains may owe capital-gains tax (a 1031 exchange can defer both). Figures are a year-1 estimate at your 24.0% rate — not tax advice; consult a CPA.
Schools (NCES district)
- District
- Pinellas
- NCES district ID
- 1201560
- Math proficiency
- 51% ▼ -5.00%
- Reading proficiency
- 51% ▼ -3.00%
- Median HH income
- $46,270
- Composite
- 43.27/100
- National rank
- #3046
- State rank
- #31 of 73 in FL
Livability — St. Petersburg
No livability data for this city. (Only ~50 U.S. cities are tracked.)
Census & demographics
- Census place
- St. Petersburg, FL
- County
- Pinellas County · 939,478 people
- City population
- 249,151
- Metro
- Tampa-St. Petersburg-Clearwater, FL
- Population (ZIP)
- 8,032
- Household income
- $102,782
- Rent vs Own
- Severe rent burden
- 106.0
Population outlook (Pinellas County) Hauer SSP2
- Today (2025)
- 1,027,532 people
- By 2030
- 1,063,586 · +3.5%
- By 2040
- 1,125,020 · +9.5%
- By 2050
- 1,168,637 · +13.7%
- By 2075
- 1,265,188 · +23.1%
- By 2100
- 1,260,357 · +22.7%
Race, ethnicity, and origin ACS 2023
- Neighborhood character
- Predominantly White (89%)
- Race & ethnicity
- White 89% Two or more races 5% Hispanic / Latino 5% Asian 2%
- Hispanic origin (detail)
- Puerto Rican 2%
- Common ancestry
- Romanian 6% Hungarian 3% Lithuanian 3%
- Foreign-born
- 11% · Canada, China
- Languages at home
- 88% English-only · Spanish 5% Russian/Polish/Slavic 2% Arabic 1%
Political lean MEDSL · Pinellas
- 2024 margin
- Lean R (+5.2) · D 46.9% · R 52.1%
- 2008→2024 swing
- -13.5pp toward R · 2008: 8.3pp · 2024: -5.2pp
- All cycles
- 2024: R+5.2 2020: D+0.2 2016: R+1.1 2012: D+5.6 2008: D+8.3
Not yet ingested
- Civics
- —
Market trends
- HPI YoY
- ▼ -0.15%
- Current HPI
- 264.9727
- Rent YoY
- —
- Metro
- Tampa-St. Petersburg-Clearwater, FL
- State GDP YoY
- ▲ 3.28%
- F500 in state
- 36
Industry mix (Fortune 500 HQ in FL)
| Industry | F500 HQs | Revenue |
|---|---|---|
| Industrial Technology | 2 | $29B |
|
||
| Insurance | 2 | $17B |
|
||
| Retail | 1 | $60B |
|
||
| Technology Distribution | 1 | $58B |
|
||
| Homebuilding | 1 | $35B |
|
||
| Technology Manufacturing | 1 | $35B |
|
||
Price history
+361.0% since first listed6 events — show timeline
- 2026-04-07 Listed $349,900 Stellar MLS as Distributed by MLS Grid
- 2020-12-28 Sold (Public Records) $200,000 Public Records
- 2005-08-13 Listed $365,000 Stellar MLS as Distributed by MLS Grid
- 2005-05-09 Listed $345,000 Stellar MLS as Distributed by MLS Grid
- 1996-11-19 Sold (Public Records) $95,000 Public Records
- 1988-04-15 Sold (Public Records) $75,900 Public Records
Property tax history
+7.6%/yrLatest (2025): $5,940 · +7.1% YoY. Source: county tax records.
Cash-flow waterfall
monthlySold comps — $/sqft
last 12 mo · ≤1 miLoading sold comps…