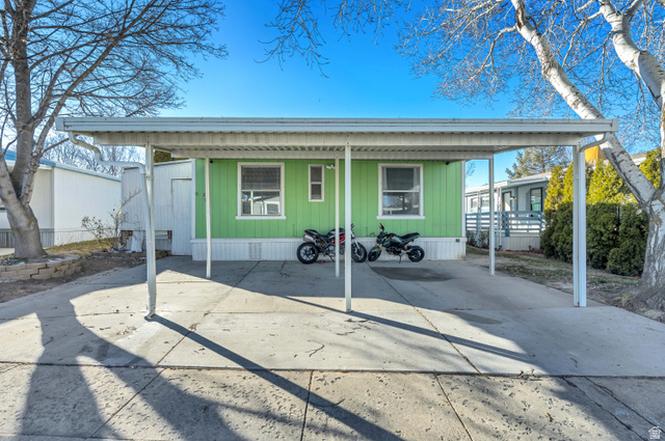
276 E Hidden View Dr #98 · Sandy, UT
Flood risk 1/10 · Minimal
- FEMA flood zone
- X (unshaded)
- Chance of flooding over 30 yrs
- 0.0%
- Est. flood insurance / yr
- $507 – $1,088
Fire risk 1/10 · Minimal
- Est. fire insurance / yr
- $453 – $841
Heat risk 4/10 · Minor
- Hot days now (above 96°F)
- 7 days/yr
- Hot days in 30 yrs
- 17 days/yr
Wind risk 1/10 · Minimal
- Chance of severe wind over 30 yrs
- —
Air-quality risk 2/10 · Minimal
- Unhealthy air days now
- 2 days/yr
- Unhealthy air days in 30 yrs
- 2 days/yr
Risk factors via First Street. Map © Google.
Why this score? — see what drove the D- grade
The composite is a weighted blend of 9 inputs, each scored 0–100. Each bar is that input's sub-score; the figure is the points it added to the 100-point composite (weight × sub-score).
- 1% rule +10.0/10.0
- ARV discount +7.5/15.0
- Cash flow +7.3/30.0
- Schools +4.6/10.0
- Livability +4.2/5.0
- Condition / age +2.5/5.0
- Rent growth +1.8/5.0
- DSCR +1.5/10.0
- Appreciation +0.0/10.0
$115,000
🖨 Deal sheet 📄 Offer letter ✓ Due diligence
Listing remarks MLS
There are no remarks available.
Key facts
- Large tub
- Tile in kitchen
- Vaulted ceiling
Tags
Property features AI
Finance
- Other: Subdivision: CRESENT
- HOA & community: Homeowners association with monthly fee; Monthly association fee of $1,180; Community amenities include clubhouse, RV parking, playground, pool, pet-friendly, and snow removal
Exterior
- Parking: Six total parking spaces; Three covered/carport spaces; Three open parking spaces; Covered parking; Common RV parking
- Utilities: Natural gas connected; Electricity connected; Sewer connected; Culinary (municipal) water connected
- Home design: Manufactured home; Residential use; Faces north
- Construction: Asphalt roof; Built/standing condition; Construction materials: Other
- Exterior features: Curb and gutter; Fully fenced yard; Automatic full sprinkler system; Storage shed(s); Full landscaping; Flat terrain
Interior
- Kitchen: Range hood; Refrigerator
- Bedrooms: Three main-level bedrooms; Primary bedroom on the first floor
- Flooring: Carpet; Linoleum; Tile
- Bathrooms: Two full bathrooms
- Heating & cooling: Forced air heating (gas central); Central air conditioning; Evaporative cooling
- Interior features: Primary bathroom with separate tub and shower; Walk-in closet; Vaulted ceilings; Range/Oven (free standing); Blinds on windows
- Laundry & utility: Electric dryer hookup
Neighborhood map
What this means for you Summary
Snapshot
- This is a 3-bed/2.0-bath manufactured listed at $115k.
Deal economics
- At list price, monthly cash flow is $-153 ($-2k/yr) — negative.
- To cash-flow at today's rent, offer at most $93k (19.3% below list).
- Meets the 1% rule at list price ($2k rent vs $115k).
- Recommended offer: $93k (19.3% below list) — sets the bar for cash-flow.
Location & tenants
- Location reads 83/100 on livability (#23 in UT, #920 nationally) — a professional / high-income tenant draw. Strengths: crime A+, commute A+, employment A+; Watch: amenities F, cost of living F.
- Canyons District (suburban): math 49% / reading 53% proficiency, ranked #12 of 80 in UT (top 15%) — acceptable for families but not a draw, mixed tenant base, ~2y average lease.
- Zoned schools: Crescent School (math 42% / reading 42%, grade F, #287 of 585 statewide, top 52%, 423 students, 30% FRL); Alta High (math 27% / reading 59%, grade F, #53 of 171 statewide, top 31%, 2,294 students, 15% FRL) — zoned schools at 23% FRL track the district average.
- Market conditions: Rents soft (-2.7%/yr); 134 active listings in the ZIP; 21 comparable units currently listed for rent nearby; rentals leasing fast (median 4d on market — plan ~1-2 weeks tenant-placement turnaround); solid renter incomes; 4,970 units permitted in Salt Lake County in 2024 (1,963 in 5+ unit buildings).
- This rent runs 35% of the median local income ($79k/yr) — at the standard rent-burdened threshold; future hikes will face affordability resistance.
Forward outlook
- Local home prices are declining (-3.0%/yr); year-one equity from $795 of loan paydown is wiped out by about $3k of value loss. Plan a longer hold.
- Salt Lake County population projected at +37% by 2050 — long-run rental-demand tailwind backs the buy-and-hold thesis.
Negotiation context
- It's been on market 96 days — a 9% lower offer ($105k) is reasonable based on typical stale-listing flexibility.
- 4 sale attempts since 5y ago with the ask held roughly flat each time — persistent listings suggest the price (not the market) is what's stuck; bring a comps-based counter.
Risks & watch-outs
- Watch-outs: HOA is 51% of rent.
Questions for the listing agent
- What do current leases actually rent for vs. the listed asking? Can we see a recent rent roll and the last 12 months of T-12 income?
- It's been on market 96 days. Have you received any prior offers? Is the seller open to a 19% concession, seller financing, or rate buy-down credit?
- What does the HOA fee cover, when was the last increase, and are there any pending special assessments or reserve-fund shortfalls?
- Why hasn't it sold? Are there any deal-killer items the seller is aware of (foundation, flood, title, zoning, code violations)?
- Is there a deadline driving the sale (1031 exchange, divorce, estate, relocation)? That informs how much negotiation room exists.
- Schools are A-rated — typically a magnet for longer-tenancy family renters. What's the average tenant stay here, and is there a school-zone premium baked into asking?
- The area grade is low — what's the realistic commute time and amenity access for the typical tenant pool here? Any planned neighborhood developments (good or bad) we should know about?
- What's the average days-on-market for RENTAL listings here right now (not sales)? A rising rental-DOM trend means longer vacancies and softer asking-rent achievability than the comps imply.
- What's the recent tenant-quality profile in this submarket — average credit score on applications, eviction rate, late-payment / NSF rate, and stable-employment percentage? A property-management company in the area should have these aggregated.
- How much new for-sale + rental construction is in the pipeline within 1–3 miles? Heavy new supply typically softens prices + rents 12–24 months out; constrained supply supports both.
Investment metrics
- 1% rule
- 2.01% ✓
- Cap rate
- 4.69%
- Cash-on-cash
- -5.71%
- DSCR
- 0.75
- GRM
- 4.2
CMA / ARV
No comps found within radius.
Projected returns pro-forma
-3.0% appreciation · 0.0% rent growth · sell at horizon
- IRR
- -35.4%
- Equity multiple
- -0.07×
- Total profit
- $-34,386
- Equity at exit
- $17,147
- IRR
- —
- Equity multiple
- -1.04×
- Total profit
- $-65,530
- Equity at exit
- $9,943
Cash invested: $32,200 (down + closing). Projections, not guarantees.
Landlord ↔ Tenant lean methodology
- Overall (STATE)
- 86 Strongly Landlord-Friendly
- State Utah
- 86 Strongly Landlord-Friendly · R+15
- County
- — inherits STATE
- City
- — inherits STATE
ZIP-level market 84070
- Rents YoY
- -2.7%
- Active inventory
- 134
- Price-to-rent
- 4.2×
Monthly cashflow live
- Estimated rent
- $2,306 high interval (Pro) →
- Mortgage (P&I)
- −$603
- Tax est. 1.5%
- −$144 /mo · $1,725/yr
- Insurance
- −$48
- HOA
- −$1,180
- Vacancy / Maint / Mgmt
- −$484
- Net cashflow
- $-153
Break-even live
UW: 25.0% down · 7.5% · 30yr · 1.5% tax · 5.0% vac · 8.0% maint · 8.0% mgmt
Financing live
Cash to close
- Down payment
- $28,750
- Closing costs
- $3,450
- Reserves months
- —
- Total cash needed
- —
Loan-product check · same deal, 3 products live
Conventional
25% down · 7.5% · 30yr
- Down + closing
- —
- Monthly P&I
- —
- Monthly cashflow
- —
- DSCR
- —
- Eligible?
- —
Personal DTI + credit; lowest rate.
DSCR
20% down · 8.5% · 30yr
- Down + closing
- —
- Monthly P&I
- —
- Monthly cashflow
- —
- DSCR
- —
- Eligible?
- —
No personal income docs; deal must DSCR.
Hard money
10% down · 12.0% · 12mo
- Down + closing
- —
- Monthly P&I
- —
- Monthly cashflow
- —
- DSCR
- —
- Eligible?
- —
Short-term bridge; refi at stabilization.
Rent comps 21 comps
| Address | Beds | Baths | Sqft | Rent | $/sqft | DOM | Units | Dist |
|---|---|---|---|---|---|---|---|---|
| 11251 S State St Sandy, UT | 1.0–3.0 | 1.0–2.0 | 895 | $2,235 | $2.50 | 1d | 20 | 0.40mi |
| 11171 S Apple Cider Dr Sandy, UT | 2.0–4.0 | 2.0–3.5 | 1508 | $2,986 | $1.98 | 1d | 3 | 0.59mi |
| 644 E Shadow View Ln Draper, UT | 3.0 | 2.5 | 1260 | $2,195 | $1.74 | 3d | 1 | 0.78mi |
| 12092 S Draper Crest Ln Draper, UT | 1.0–3.0 | 1.0–2.5 | 1183 | $2,489 | $2.10 | 1d | 14 | 0.98mi |
| 983 E Dry Gulch Cir Sandy, UT | 3.0 | 2.0 | 1550 | $2,650 | $1.71 | 23d | 1 | 1.07mi |
| 11627 S Frost View Ln Draper, UT | 3.0 | 2.5 | 1736 | $2,350 | $1.35 | 4d | 1 | 1.08mi |
| 10463 S Crimson Sage Ln Sandy, UT | 4.0 | 3.5 | 2198 | $2,995 | $1.36 | 17d | 1 | 1.13mi |
| 10374 S Sage Canal Way #126 Sandy, UT | 4.0 | 3.5 | 2178 | $3,250 | $1.49 | 23d | 1 | 1.15mi |
| 11875 S Poultry Dr Draper, UT | 4.0 | 2.0 | 1568 | $2,295 | $1.46 | 4d | 1 | 1.15mi |
| 11418 S Lemongrass CT Draper, UT | 2.0–4.0 | 2.0–3.5 | 1643 | $2,699 | $1.64 | 23d | 1 | 1.17mi |
| 10742 S 930 E Unit 1 Sandy, UT | 2.0 | 2.0 | 1350 | $1,600 | $1.19 | 16d | 1 | 1.22mi |
| 11065 S Sterling View Dr South Jordan, UT | 1.0–2.0 | 1.0–2.0 | 1114 | $1,930 | $1.73 | 2d | 6 | 1.24mi |
| 10470 S 700 E Unit a Sandy, UT | 2.0 | 1.0 | 1100 | $1,245 | $1.13 | 21d | 1 | 1.25mi |
| 11006 S Maple Farms Ln South Jordan, UT | 3.0 | 2.0 | 2109 | $2,250 | $1.07 | 17d | 1 | 1.27mi |
| 652 E 12225 S Draper, UT | 3.0 | 2.0 | 1588 | $2,300 | $1.45 | 23d | 1 | 1.28mi |
| 12358 Pony Express Rd Draper, UT | 2.0 | 1.0–2.0 | 774 | $1,849 | $2.39 | 4d | 13 | 1.39mi |
| 575 E 10315 S Sandy, UT | 3.0 | 2.0 | 1900 | $2,295 | $1.21 | 21d | 1 | 1.39mi |
| 10656 S Windsor Ridge Way South Jordan, UT | 1.0–2.0 | 1.0–2.5 | 925 | $2,028 | $2.19 | 3d | 3 | 1.40mi |
| 10668 S Monica Ridge Way South Jordan, UT | 1.0–2.0 | 1.0–2.5 | 925 | $2,028 | $2.19 | 3d | 3 | 1.42mi |
| 10203 S 360 E Sandy, UT | 4.0 | 2.0 | 1758 | $2,550 | $1.45 | 4d | 1 | 1.45mi |
| 12150 S 1000 E Draper, UT | 3.0–4.0 | 2.5–3.5 | 1724 | $2,400 | $1.39 | 23d | 1 | 1.47mi |
HOA detail
- Monthly dues
- $1,180 · $14,160/yr
Listing history 24 events
-
2026-06-18days on market $115,000 Active 96 DOM
-
2026-06-17days on market $115,000 Active 95 DOM
-
2026-06-16days on market $115,000 Active 94 DOM
-
2026-06-15days on market $115,000 Active 93 DOM
-
2026-06-13days on market $115,000 Active 91 DOM
-
2026-06-09days on market $115,000 Active 87 DOM
-
2026-06-08days on market $115,000 Active 86 DOM
-
2026-06-07days on market $115,000 Active 85 DOM
-
2026-06-05days on market $115,000 Active 82 DOM
-
2026-06-03days on market $115,000 Active 81 DOM
-
2026-06-02days on market $115,000 Active 80 DOM
-
2026-06-01days on market $115,000 Active 79 DOM
-
2026-05-31days on market $115,000 Active 78 DOM
-
2026-04-09status Active
-
2026-04-09price $115,000
-
2026-03-21status Under Contract
-
2026-02-23$120,000 Active
-
2022-02-22soldstatus Closed 31-char remark
Show marketing remark (31 chars)
There are no remarks available.
-
2021-12-12status Under Contract 31-char remark
Show marketing remark (31 chars)
There are no remarks available.
-
2021-12-02status Active 31-char remark
Show marketing remark (31 chars)
There are no remarks available.
-
2021-11-10status Under Contract 31-char remark
Show marketing remark (31 chars)
There are no remarks available.
-
2021-11-02price $94,000 31-char remark
Show marketing remark (31 chars)
There are no remarks available.
-
2021-10-16price $95,000 31-char remark
Show marketing remark (31 chars)
There are no remarks available.
-
2021-09-23$97,000 Active 31-char remark
Show marketing remark (31 chars)
There are no remarks available.
ⓘ Source: listings_history table (triggers on properties + properties_extension) + one-shot
backfill from property_details.listing_events for pre-trigger history.
Climate risk First Street
- Flood 1/10 Low FEMA zone X (unshaded) · 0% chance over 30 yrs
- Wildfire 1/10 Low
- Heat 4/10 Moderate 7 d/yr ≥96°F today · 17 d/yr by 30 yrs out
- Wind 1/10 Low
- Air quality 2/10 Low 2 unhealthy d/yr today · 2 by 30 yrs out
Nearby sold comps map
Loading sold comps map…
Walkable amenities ~0.75 mi
Loading nearby amenities…
Taxation est. · year 1
- Rental income
- $27,670
- − Mortgage interest
- −$6,442
- − Property taxes
- −$1,725
- − Insurance
- −$575
- − Repairs & maintenance
- −$2,214
- − Management
- −$2,214
- − HOA
- −$14,160
- − Depreciation
- −$3,345
- Taxable loss
- −$3,005
- Est. tax savings @ 24.0%
- +$721
- After-tax cash flow
- $-1,117/yr
For passive investors: Depreciation is non-cash, so a rental often shows a tax loss while cash-flowing — sheltering income. Rental losses are passive: they offset passive income freely, and up to $25,000/yr can offset ordinary (W-2) income if you actively participate and your MAGI is under $100k (phasing out to $0 by $150k); unused losses carry forward. On sale, claimed depreciation is recaptured at up to 25%, and gains may owe capital-gains tax (a 1031 exchange can defer both). Figures are a year-1 estimate at your 24.0% rate — not tax advice; consult a CPA.
Schools (NCES district)
- District
- Canyons District
- NCES district ID
- 4900142
- Math proficiency
- 49% ▼ -5.00%
- Reading proficiency
- 53% ▼ -3.00%
- Median HH income
- $74,107
- Composite
- 45.91/100
- National rank
- #2548
- State rank
- #12 of 80 in UT
Livability — Sandy
- Score
- 83/100
- State rank
- #23
- US rank
- #920
Category grades
Schools grade is shown separately in the Schools card above.
Census & demographics
- Census place
- Sandy, UT
- County
- Salt Lake County · 1,195,750 people
- City population
- 81,994
- Metro
- Salt Lake City, UT
- Population (ZIP)
- 30,472
- Household income
- $78,991
- Rent vs Own
- Severe rent burden
- 1137.0
Population outlook (Salt Lake County) Hauer SSP2
- Today (2025)
- 1,305,860 people
- By 2030
- 1,402,611 · +7.4%
- By 2040
- 1,594,533 · +22.1%
- By 2050
- 1,787,244 · +36.9%
- By 2075
- 2,224,138 · +70.3%
- By 2100
- 2,551,390 · +95.4%
Race, ethnicity, and origin ACS 2023
- Neighborhood character
- Predominantly White (67%)
- Race & ethnicity
- White 67% Hispanic / Latino 23% Two or more races 10% Asian 4% Native American 2%
- Hispanic origin (detail)
- Mexican 10% Salvadoran 1%
- Common ancestry
- Slovak 4% Italian 2% Portuguese 2%
- Foreign-born
- 15% · Canada, Dominican Republic, China
- Languages at home
- 76% English-only · Spanish 17% Other Asian/Pacific 2% Russian/Polish/Slavic 1%
Political lean MEDSL · Salt Lake
- 2024 margin
- D (+10.2) · D 53.7% · R 43.5% · Other 2.8%
- 2008→2024 swing
- +10.1pp toward D · 2008: 0.1pp · 2024: 10.2pp
- All cycles
- 2024: D+10.2 2020: D+11.0 2016: D+10.2 2012: R+19.3 2008: D+0.1
Not yet ingested
- Civics
- —
Market trends
- HPI YoY
- ▼ -207.18%
- Current HPI
- 313.8027
- Rent YoY
- ▼ -2.71%
- Metro
- Salt Lake City, UT
- State GDP YoY
- ▲ 3.54%
- F500 in state
- 2
Industry mix (Fortune 500 HQ in UT)
| Industry | F500 HQs | Revenue |
|---|---|---|
| Financial Services | 1 | $3B |
|
||
Price history
+18.6% since first listed11 events — show timeline
- 2026-04-09 Relisted — WFRMLS
- 2026-04-09 Price Changed $115,000 WFRMLS
- 2026-03-21 Pending — WFRMLS
- 2026-02-23 Listed $120,000 WFRMLS
- 2022-02-22 Sold (MLS) — WFRMLS
- 2021-12-12 Pending — WFRMLS
- 2021-12-02 Relisted — WFRMLS
- 2021-11-10 Pending — WFRMLS
- 2021-11-02 Price Changed $94,000 WFRMLS
- 2021-10-16 Price Changed $95,000 WFRMLS
- 2021-09-23 Listed $97,000 WFRMLS
Cash-flow waterfall
monthlySold comps — $/sqft
last 12 mo · ≤1 miLoading sold comps…