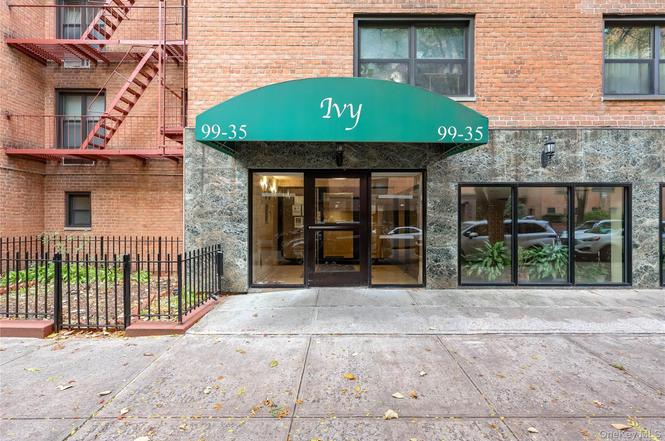
99-35 59th Ave Unit 4E · New York, NY
Flood risk 8/10 · Major
- FEMA flood zone
- X (unshaded)
- Chance of flooding over 30 yrs
- 0.78%
- Est. flood insurance / yr
- $507 – $1,088
Fire risk 1/10 · Minimal
- Est. fire insurance / yr
- $691 – $1,283
Heat risk 6/10 · Moderate
- Hot days now (above 99°F)
- 7 days/yr
- Hot days in 30 yrs
- 15 days/yr
Wind risk 6/10 · Moderate
- Chance of severe wind over 30 yrs
- 27.0%
Air-quality risk 5/10 · Moderate
- Unhealthy air days now
- 6 days/yr
- Unhealthy air days in 30 yrs
- 8 days/yr
Risk factors via First Street. Map © Google.
Why this score? — see what drove the C- grade
The composite is a weighted blend of 9 inputs, each scored 0–100. Each bar is that input's sub-score; the figure is the points it added to the 100-point composite (weight × sub-score).
- Cash flow +15.7/30.0
- Appreciation +8.7/10.0
- ARV discount +7.5/15.0
- Schools +5.0/10.0
- DSCR +4.8/10.0
- 1% rule +4.3/10.0
- Livability +3.8/5.0
- Rent growth +2.5/5.0
- Condition / age +2.5/5.0
$280,000
🖨 Deal sheet 📄 Offer letter ✓ Due diligence
Listing remarks
Welcome to Sherwood Village, a well-established, pet-friendly cooperative known for its exceptional clean upkeep and attentive live-in superintendent. This spacious residence offers approximately 960 square feet of living space, highlighted by a bright L-shaped living and dining area with flexible layout options, unobstructed views, and abundant natural light. The home features an eat-in kitchen and generously sized rooms throughout. Monthly maintenance offers outstanding value, covering heat, hot water, gas, electricity, real estate taxes, and common area maintenance. Residents also enjoy access to a dedicated garden area. For everyday living, the location offers flexibility and convenienc
Key facts
- 75 garage spots
- Built 1951
- Listed 175 days
Property features AI
Finance
- HOA & community: Association managed by Kaled Management Corp
Exterior
- Parking: Garage and parking lot available; Total parking spaces: 132; Garage spaces: 75; Parking fee required
- Utilities: Public sewer; Electricity connected
- Home design: Stock cooperative property; One level; 7 total stories in building
- Construction: Brick exterior
- Exterior features: Courtyard; Brick construction
Interior
- Kitchen: Oven; Range; Refrigerator
- Bedrooms: Total of 4 rooms (includes bedroom count within rooms total)
- Bathrooms: 1 full bathroom
- Heating & cooling: Baseboard heating; Other heating; No central cooling
- Interior features: Pets allowed; Courtyard access
Neighborhood map
What this means for you Summary
Snapshot
- This is a 1-bed/1.0-bath condo listed at $280k.
Deal economics
- At list price, monthly cash flow is $54 ($652/yr) — positive.
- The deal already cash-flows at list — no discount required.
- To meet the 1% rule (rent ≥ 1% of price), the offer needs to be $260k (7.1% below list).
- Recommended offer: $246k (12.0% below list) — sets the bar for market timing.
- Cap rate 6.8% vs local median 2.6% in New York — top-decile yield for the area; either an underpriced asset or a hidden risk that comps aren't pricing in. Stress-test before assuming the spread holds.
Location & tenants
- Location reads 75/100 on livability (#268 in NY, #4,188 nationally) — a middle-class / working-renter tenant base. Strengths: amenities A+, commute A+, health & safety A; Watch: crime F, cost of living F.
- Market conditions: 243 active listings in the ZIP; 40 comparable units currently listed for rent nearby; rentals at typical pace (median 19d on market — plan ~3-4 weeks tenant-placement turnaround); 5,302 units permitted in Queens County in 2024 (4,918 in 5+ unit buildings).
- This rent runs 43% of the median local income ($72k/yr) — at the standard rent-burdened threshold; future hikes will face affordability resistance.
Forward outlook
- In year one you build about $23k of equity ($2k loan paydown + $21k appreciation (7.4% local appreciation)).
- Queens County population projected at +16% by 2050 — long-run rental-demand tailwind backs the buy-and-hold thesis.
- At projected returns (7.4% appreciation + 3.0% rent growth), your $78k cash investment doubles in ~4 years — after that, you're playing with house money.
- By year 2, paydown + projected appreciation supports a ~$36k cash-out refi (75% LTV) — recoverable capital for the next deal without selling this one.
Negotiation context
- It's been on market 175 days — a 12% lower offer ($246k) is reasonable based on typical stale-listing flexibility.
- 2 sale attempts; this cycle's ask has dropped $28k (9%) from the opening price — seller is motivated, your offer sets the floor, not the list.
Risks & watch-outs
- Watch-outs: flood insurance adds $66/mo; built in 1951 — expect roof / HVAC / electrical / plumbing capex.
- Climate carrying-cost: severe flood risk; major wind risk, 27% chance of damaging wind over 30y; extreme-heat days projected 7→15/yr by 2055 (HVAC capex compounding) — expect insurance premiums to compound above CPI over the hold.
Questions for the listing agent
- It's been on market 175 days. Have you received any prior offers? Is the seller open to a 12% concession, seller financing, or rate buy-down credit?
- Built in 1951 — when were the roof, HVAC, electrical panel, plumbing, and water heater last replaced?
- What's the actual annual flood-insurance premium (NFIP or private), and is the property in a SFHA with mandatory coverage?
- Any open or pending special assessments — roof, HVAC, plumbing, elevator, façade? What's the per-unit balance and payoff schedule, and is the seller paying it off at close or rolling it to the buyer?
- Why hasn't it sold? Are there any deal-killer items the seller is aware of (foundation, flood, title, zoning, code violations)?
- Is there a deadline driving the sale (1031 exchange, divorce, estate, relocation)? That informs how much negotiation room exists.
- Schools are B-rated — typically a magnet for longer-tenancy family renters. What's the average tenant stay here, and is there a school-zone premium baked into asking?
- Crime grade is F in this area — have there been break-ins, vandalism, or insurance claims at this property in the last 3 years? What carrier currently insures it and at what premium?
- What's the average days-on-market for RENTAL listings here right now (not sales)? A rising rental-DOM trend means longer vacancies and softer asking-rent achievability than the comps imply.
- What's the recent tenant-quality profile in this submarket — average credit score on applications, eviction rate, late-payment / NSF rate, and stable-employment percentage? A property-management company in the area should have these aggregated.
- How much new apartment / multifamily construction is in the pipeline within 1–3 miles? Heavy new supply (>2% of stock underway) typically softens rents 12–24 months out; light construction supports rent growth.
Investment metrics
- 1% rule
- 0.93% ✗
- Cap rate
- 6.81%
- Cash-on-cash
- 1.85%
- DSCR
- 1.08
- GRM
- 9.0
CMA / ARV
No comps found within radius.
Projected returns pro-forma
7.4% appreciation · 3.0% rent growth · sell at horizon
- IRR
- 19.3%
- Equity multiple
- 2.38×
- Total profit
- $108,230
- Equity at exit
- $201,391
- IRR
- 18.2%
- Equity multiple
- 4.97×
- Total profit
- $311,639
- Equity at exit
- $389,410
Cash invested: $78,400 (down + closing). Projections, not guarantees.
Landlord ↔ Tenant lean methodology
- Overall (CITY)
- 0 Strongly Tenant-Friendly
- State New York
- 15 Strongly Tenant-Friendly · D+10
- County
- — inherits STATE
- City New York
- 0 Strongly Tenant-Friendly · D+34
ZIP-level market 11368
- Home prices YoY
- 2.7%
- Active inventory
- 243
- Price-to-rent
- 9.0×
Monthly cashflow live
- Estimated rent
- $2,602 high interval (Pro) →
- Mortgage (P&I)
- −$1,468
- Tax est. 1.5%
- −$350 /mo · $4,200/yr
- Insurance
- −$117
- Flood insurance flood zone
- −$66 /mo · $798/yr
- HOA
- −$0
- Vacancy / Maint / Mgmt
- −$546
- Net cashflow
- $54
Break-even live
UW: 25.0% down · 7.5% · 30yr · 1.5% tax · 5.0% vac · 8.0% maint · 8.0% mgmt
Financing live
Cash to close
- Down payment
- $70,000
- Closing costs
- $8,400
- Reserves months
- —
- Total cash needed
- —
Loan-product check · same deal, 3 products live
Conventional
25% down · 7.5% · 30yr
- Down + closing
- —
- Monthly P&I
- —
- Monthly cashflow
- —
- DSCR
- —
- Eligible?
- —
Personal DTI + credit; lowest rate.
DSCR
20% down · 8.5% · 30yr
- Down + closing
- —
- Monthly P&I
- —
- Monthly cashflow
- —
- DSCR
- —
- Eligible?
- —
No personal income docs; deal must DSCR.
Hard money
10% down · 12.0% · 12mo
- Down + closing
- —
- Monthly P&I
- —
- Monthly cashflow
- —
- DSCR
- —
- Eligible?
- —
Short-term bridge; refi at stabilization.
Rent comps 40 comps
| Address | Beds | Baths | Sqft | Rent | $/sqft | DOM | Units | Dist |
|---|---|---|---|---|---|---|---|---|
| 102-45 62nd Rd Unit 7J Forest Hills, NY | 1.0 | 1.0 | 770 | $2,950 | $3.83 | 24d | 1 | 0.25mi |
| 6155 98th St Unit 8B Rego Park, NY | 1.0 | 1.0 | 700 | $2,500 | $3.57 | 5d | 1 | 0.26mi |
| 6145 98th St Rego Park, NY | 1.0–3.0 | 1.0 | 825 | $2,350 | $2.85 | 3d | 3 | 0.29mi |
| 6145 98th St Rego Park, NY | 1.0–3.0 | 1.0 | 825 | $2,500 | $3.03 | 24d | 3 | 0.29mi |
| 102-06 63rd Ave #2 Queens, NY | 2.0 | 1.0 | 1000 | $3,000 | $3.00 | 24d | 1 | 0.35mi |
| 54-01 108th St Unit 2R Flushing, NY | 2.0 | 1.0 | 1000 | $3,050 | $3.05 | 24d | 1 | 0.35mi |
| 6125 97th St Unit 4D Rego Park, NY | — | 1.0 | 650 | $2,300 | $3.54 | 5d | 1 | 0.37mi |
| 9710 62nd Dr Unit 9F Rego Park, NY | 1.0 | 1.0 | 750 | $2,700 | $3.60 | 4d | 1 | 0.41mi |
| 9430 58th Ave Unit 3A Elmhurst, NY | — | 1.0 | 530 | $1,800 | $3.40 | 11d | 1 | 0.44mi |
| 9707 63rd Rd Unit 15B Rego Park, NY | 1.0 | 1.0 | 700 | $2,300 | $3.29 | 2d | 1 | 0.46mi |
| 9941 64th Ave Rego Park, NY | 1.0–2.0 | 1.0 | 975 | $2,400 | $2.46 | 19d | 2 | 0.48mi |
| 10849 63rd Ave Unit 2C Forest Hills, NY | — | 1.0 | 600 | $1,900 | $3.17 | 24d | 1 | 0.50mi |
| 9810 64th Ave Rego Park, NY | 1.0 | 1.0 | 825 | $2,125 | $2.58 | 17d | 2 | 0.53mi |
| 9810 64th Ave Unit 3A Rego Park, NY | 1.0 | 1.0 | 850 | $2,450 | $2.88 | 2d | 1 | 0.53mi |
| 6405 Yellowstone Blvd Flushing, NY | 1.0 | 1.0–1.5 | 920 | $3,075 | $3.34 | 24d | 2 | 0.53mi |
| 6405 Yellowstone Blvd Unit 403S Forest Hills, NY | 1.0 | 1.0 | 720 | $3,100 | $4.31 | 24d | 1 | 0.53mi |
| 9825 64th Rd Unit 8F Rego Park, NY | 2.0 | 1.0 | 850 | $2,400 | $2.82 | 1d | 1 | 0.55mi |
| 9725 64th Ave Rego Park, NY | 1.0 | 1.0 | 760 | $1,800 | $2.37 | 19d | 1 | 0.55mi |
| 61-20 Grand Central Pkwy Unit Bb706 Forest Hills, NY | 2.0 | 1.0 | 970 | $2,850 | $2.94 | 19d | 1 | 0.56mi |
| 6435 Yellowstone Blvd Unit 6G Forest Hills, NY | — | 1.0 | 575 | $1,900 | $3.30 | 19d | 1 | 0.60mi |
| 10525 65th Ave Unit 4F Forest Hills, NY | 2.0 | 1.0 | 980 | $3,998 | $4.08 | 15d | 1 | 0.61mi |
| 10523 65th Rd Forest Hills, NY | 2.0 | 2.0 | 760 | $3,200 | $4.21 | 24d | 1 | 0.65mi |
| 102-39 66th Ave Unit 1 Flushing, NY | 2.0 | 1.0 | 981 | $3,000 | $3.06 | 1d | 1 | 0.68mi |
| 97-12 65th Rd Unit 4-C Rego Park, NY | 1.0 | 1.0 | 650 | $3,350 | $5.15 | 5d | 1 | 0.68mi |
| 6347 Booth St Unit 3C Rego Park, NY | 1.0 | 1.0 | 700 | $3,400 | $4.86 | 24d | 1 | 0.69mi |
| 97-12 65th Rd Apt 5D Rego Park, NY | 1.0 | 1.0 | 800 | $3,395 | $4.24 | 5d | 1 | 0.70mi |
| 10533 66th Ave Unit 3F Forest Hills, NY | 1.0 | 1.0 | 775 | $2,200 | $2.84 | 5d | 1 | 0.71mi |
| 10302 42nd Ave Unit 4D Corona, NY | 2.0 | 1.5 | 761 | $3,400 | $4.47 | 19d | 1 | 0.71mi |
| 98-81 Queens Blvd Unit 15E Rego Park, NY | 1.0 | 1.0 | 700 | $3,335 | $4.76 | 5d | 1 | 0.71mi |
| 98-81 Queens Blvd Unit 14K Rego Park, NY | 2.0 | 2.0 | 950 | $4,490 | $4.73 | 13d | 1 | 0.71mi |
| 10530 66th Ave Unit 3F Forest Hills, NY | 1.0 | 1.0 | 800 | $2,200 | $2.75 | 24d | 1 | 0.74mi |
| 9876 Queens Blvd Unit 3A Rego Park, NY | 1.0 | 1.0 | 820 | $2,900 | $3.54 | 24d | 1 | 0.75mi |
| 11105 66th Ave Unit 2B Forest Hills, NY | 1.0 | 1.0 | 850 | $2,600 | $3.06 | 15d | 1 | 0.77mi |
| 10025 Queens Blvd Unit 3M Forest Hills, NY | 2.0 | 1.0 | 925 | $2,900 | $3.14 | 24d | 1 | 0.80mi |
| 102-45 67th Rd Forest Hills, NY | 1.0 | 1.0 | 700 | $2,350 | $3.36 | 19d | 1 | 0.82mi |
| 102-55 67th Rd Unit 2V Forest Hills, NY | 1.0 | 1.0 | 633 | $2,350 | $3.71 | 19d | 1 | 0.83mi |
| 11131 66th Ave Unit 3C Forest Hills, NY | 1.0 | 1.0 | 600 | $2,000 | $3.33 | 5d | 1 | 0.84mi |
| 105-25 67th Rd Forest Hills, NY | 1.0 | 1.0 | 750 | $1,800 | $2.40 | 19d | 1 | 0.84mi |
| 6620 Wetherole St Rego Park, NY | 1.0–2.0 | 1.0–2.0 | 700 | $2,400 | $3.43 | 24d | 2 | 0.89mi |
| 10240 67th Dr Unit 1C Forest Hills, NY | 1.0 | 1.5 | 780 | $2,500 | $3.21 | 24d | 1 | 0.89mi |
HOA detail condo
- Monthly dues
- $0 · $0/yr
- Likely covers
- watergaselectric
- Assessments
- None detected in remarks — confirm with the listing agent.
Listing history 8 events
-
2026-04-28status Pending
-
2026-01-16price $280,000
-
2025-11-05$308,000 Active
-
2025-10-31historical $308,000
-
2025-08-28status Pending
-
2025-08-28historical
-
2025-05-09price $318,000
-
2025-03-05$328,000 Active
ⓘ Source: listings_history table (triggers on properties + properties_extension) + one-shot
backfill from property_details.listing_events for pre-trigger history.
Climate risk First Street
- Flood 8/10 Severe FEMA zone X (unshaded) · 78% chance over 30 yrs
- Wildfire 1/10 Low
- Heat 6/10 Major 7 d/yr ≥99°F today · 15 d/yr by 30 yrs out
- Wind 6/10 Major 27% chance of damaging wind over 30 yrs
- Air quality 5/10 Major 6 unhealthy d/yr today · 8 by 30 yrs out
Nearby sold comps map
Loading sold comps map…
Walkable amenities ~0.75 mi
Loading nearby amenities…
Taxation est. · year 1
- Rental income
- $31,227
- − Mortgage interest
- −$15,684
- − Property taxes
- −$4,200
- − Insurance
- −$2,198
- − Repairs & maintenance
- −$2,498
- − Management
- −$2,498
- − Depreciation
- −$8,145
- Taxable loss
- −$3,997
- Est. tax savings @ 24.0%
- +$959
- After-tax cash flow
- $1,611/yr
For passive investors: Depreciation is non-cash, so a rental often shows a tax loss while cash-flowing — sheltering income. Rental losses are passive: they offset passive income freely, and up to $25,000/yr can offset ordinary (W-2) income if you actively participate and your MAGI is under $100k (phasing out to $0 by $150k); unused losses carry forward. On sale, claimed depreciation is recaptured at up to 25%, and gains may owe capital-gains tax (a 1031 exchange can defer both). Figures are a year-1 estimate at your 24.0% rate — not tax advice; consult a CPA.
Schools (NCES district)
No district data.
Livability — New York
- Score
- 75/100
- State rank
- #268
- US rank
- #4188
Category grades
Schools grade is shown separately in the Schools card above.
Census & demographics
- Census place
- New York, NY
- County
- Queens County · 1,914,869 people
- City population
- 7,731,280
- Metro
- New York-Newark-Jersey City, NY-NJ-PA
- Population (ZIP)
- 105,716
- Household income
- $72,270
- Rent vs Own
- Severe rent burden
- 6817.0
Population outlook (Queens County) Hauer SSP2
- Today (2025)
- 2,546,320 people
- By 2030
- 2,643,059 · +3.8%
- By 2040
- 2,815,563 · +10.6%
- By 2050
- 2,944,423 · +15.6%
- By 2075
- 3,123,338 · +22.7%
- By 2100
- 3,098,688 · +21.7%
Race, ethnicity, and origin ACS 2023
- Neighborhood character
- Predominantly Hispanic (75%)
- Race & ethnicity
- Hispanic / Latino 75% Two or more races 14% Asian 12% Black 8% White 4% Native American 1%
- Hispanic origin (detail)
- Mexican 20% Puerto Rican 2% Dominican 14%
- Foreign-born
- 60% · Canada, China, Jamaica
- Languages at home
- 15% English-only · Spanish 70% Chinese 6% Other Indo-European 3%
Political lean MEDSL · Queens
- 2024 margin
- Strong D (+24.6) · D 62.3% · R 37.7%
- 2008→2024 swing
- -26.2pp toward R · 2008: 50.8pp · 2024: 24.6pp
- All cycles
- 2024: D+24.6 2020: D+45.2 2016: D+53.4 2012: D+58.5 2008: D+50.8
Not yet ingested
- Civics
- —
Market trends
- HPI YoY
- ▲ 7.40%
- Current HPI
- 282.8276
- Rent YoY
- —
- Metro
- New York-Newark-Jersey City, NY-NJ-PA
- State GDP YoY
- ▲ 2.60%
- F500 in state
- 92
Industry mix (Fortune 500 HQ in NY)
| Industry | F500 HQs | Revenue |
|---|---|---|
| Financial Services | 10 | $950B |
|
||
| Consumer Goods | 9 | $162B |
|
||
| Insurance | 4 | $225B |
|
||
| Telecommunications | 2 | $144B |
|
||
| Pharmaceuticals | 2 | $112B |
|
||
| Media / Entertainment | 2 | $69B |
|
||
Price history
-14.6% since first listed8 events — show timeline
- 2026-04-28 Pending — OneKey® MLS as Distributed by MLS Grid
- 2026-01-16 Price Changed $280,000 OneKey® MLS as Distributed by MLS Grid
- 2025-11-05 Listed $308,000 OneKey® MLS as Distributed by MLS Grid
- 2025-10-31 Coming Soon $308,000 OneKey® MLS as Distributed by MLS Grid
- 2025-08-28 Pending — OneKey® MLS as Distributed by MLS Grid
- 2025-08-28 Listing Removed — OneKey® MLS as Distributed by MLS Grid
- 2025-05-09 Price Changed $318,000 OneKey® MLS as Distributed by MLS Grid
- 2025-03-05 Listed $328,000 OneKey® MLS as Distributed by MLS Grid
Cash-flow waterfall
monthlySold comps — $/sqft
last 12 mo · ≤1 miLoading sold comps…