1721 Brunswick Blvd · San Antonio, TX
Flood risk 1/10 · Minimal
- FEMA flood zone
- X (unshaded)
- Chance of flooding over 30 yrs
- 0.0%
- Est. flood insurance / yr
- $507 – $1,088
Fire risk 1/10 · Minimal
- Est. fire insurance / yr
- $1,222 – $2,270
Heat risk 8/10 · Major
- Hot days now (above 108°F)
- 7 days/yr
- Hot days in 30 yrs
- 22 days/yr
Wind risk 8/10 · Major
- Chance of severe wind over 30 yrs
- 80.0%
Air-quality risk 2/10 · Minimal
- Unhealthy air days now
- 1 days/yr
- Unhealthy air days in 30 yrs
- 2 days/yr
Risk factors via First Street. Map © Google.
Why this score? — see what drove the C- grade
The composite is a weighted blend of 9 inputs, each scored 0–100. Each bar is that input's sub-score; the figure is the points it added to the 100-point composite (weight × sub-score).
- ARV discount +15.0/15.0
- Cash flow +13.4/30.0
- Appreciation +4.8/10.0
- 1% rule +4.6/10.0
- DSCR +4.0/10.0
- Livability +4.0/5.0
- Rent growth +2.5/5.0
- Condition / age +2.5/5.0
- Schools +1.9/10.0
$159,900
🖨 Deal sheet (PDF) 📄 Offer letter ✓ Due diligence
Listing remarks MLS
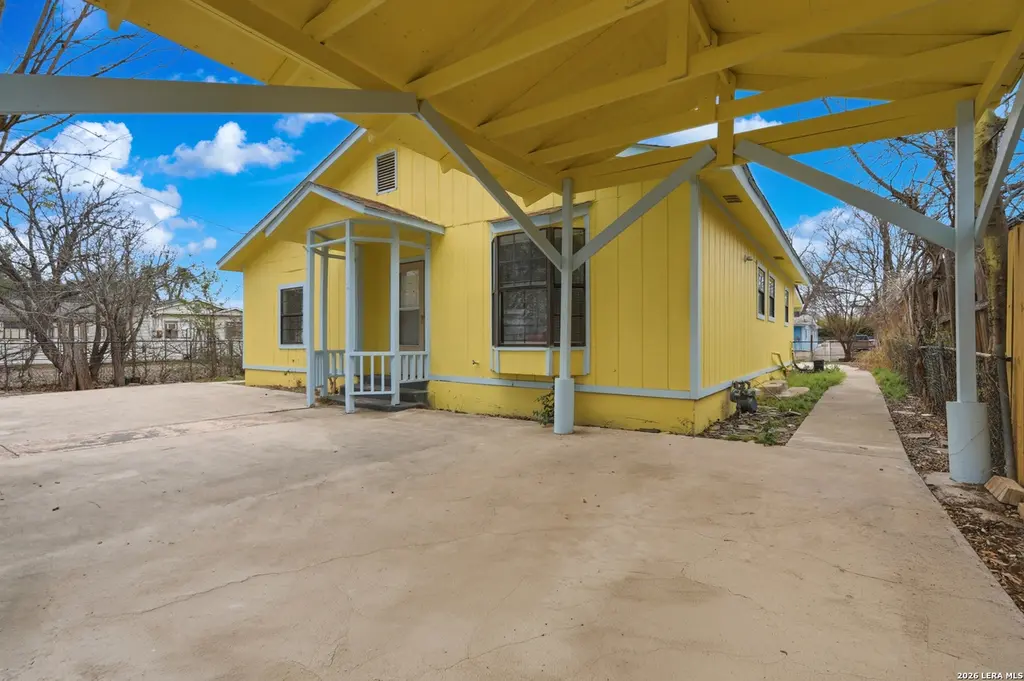
Charming 3-bedroom, 2-bath home located on the desirable south side of San Antonio! This well-maintained 1,296 square foot home offers a comfortable and functional layout perfect for families, first-time buyers, or investors. Enjoy a spacious living area that flows seamlessly into the kitchen and dining space, creating a warm and inviting atmosphere for everyday living and entertaining. The primary suite features a private full bath, while the additional bedrooms provide flexibility for guests, a home office, or growing families. Conveniently located near schools, shopping, dining, and major highways, this home offers both comfort and accessibility. Don't miss the opportunity to make this South San Antonio gem your own.
Key facts
- Near schools
- Near dining
- Near shopping
Tags
Neighborhood map
What this means for you Summary
Snapshot
- This is a 3-bed/2.0-bath single-family listed at $160k.
Deal economics
- At list price, monthly cash flow is $4 ($44/yr) — positive.
- The deal already cash-flows at list — no discount required.
- To meet the 1% rule (rent ≥ 1% of price), the offer needs to be $154k (3.9% below list).
- Recommended offer: $146k (9.0% below list) — sets the bar for market timing.
- Cap rate 6.3% vs local median 3.8% in San Antonio — top-decile yield for the area; either an underpriced asset or a hidden risk that comps aren't pricing in. Stress-test before assuming the spread holds.
Location & tenants
- Location reads 80/100 on livability (#31 in TX, #1,616 nationally) — a professional / high-income tenant draw. Strengths: amenities A+, commute A+, cost of living A+; Watch: schools C-, crime F.
- Harlandale ISD (urban): math 20% / reading 27% proficiency, ranked #748 of 826 in TX (top 91%) — low school quality limits family demand, transient renter base, plan for 1-2y turnover; 66% free/reduced lunch — lower-income household profile, screen leases tightly.
- Market conditions: 162 active listings in the ZIP; 24 comparable units currently listed for rent nearby; rentals at typical pace (median 25d on market — plan ~3-4 weeks tenant-placement turnaround); 8,308 units permitted in Bexar County in 2024 (2,506 in 5+ unit buildings).
- This rent runs 33% of the median local income ($55k/yr) — at the standard rent-burdened threshold; future hikes will face affordability resistance.
Forward outlook
- In year one you build about $388 of equity ($1k loan paydown + $-718 appreciation (-0.5% local appreciation)).
- Bexar County population projected at +50% by 2050 — long-run rental-demand tailwind backs the buy-and-hold thesis.
Negotiation context
- It's been on market 103 days — a 9% lower offer ($146k) is reasonable based on typical stale-listing flexibility.
- 3 sale attempts since 19y ago; this cycle's ask has dropped $10k (6%) from the opening price — seller is motivated, your offer sets the floor, not the list.
Risks & watch-outs
- Watch-outs: built in 1942 — expect roof / HVAC / electrical / plumbing capex.
- Climate carrying-cost: severe wind risk, 80% chance of damaging wind over 30y; extreme-heat days projected 7→22/yr by 2055 (HVAC capex compounding) — expect insurance premiums to compound above CPI over the hold.
Questions for the listing agent
- It's been on market 103 days. Have you received any prior offers? Is the seller open to a 9% concession, seller financing, or rate buy-down credit?
- Built in 1942 — when were the roof, HVAC, electrical panel, plumbing, and water heater last replaced?
- Why hasn't it sold? Are there any deal-killer items the seller is aware of (foundation, flood, title, zoning, code violations)?
- Is there a deadline driving the sale (1031 exchange, divorce, estate, relocation)? That informs how much negotiation room exists.
- Crime grade is F in this area — have there been break-ins, vandalism, or insurance claims at this property in the last 3 years? What carrier currently insures it and at what premium?
- What's the average days-on-market for RENTAL listings here right now (not sales)? A rising rental-DOM trend means longer vacancies and softer asking-rent achievability than the comps imply.
- What's the recent tenant-quality profile in this submarket — average credit score on applications, eviction rate, late-payment / NSF rate, and stable-employment percentage? A property-management company in the area should have these aggregated.
- How much new for-sale + rental construction is in the pipeline within 1–3 miles? Heavy new supply typically softens prices + rents 12–24 months out; constrained supply supports both.
Investment metrics
- 1% rule
- 0.96% ✗
- Cap rate
- 6.32%
- Cash-on-cash
- 0.10%
- DSCR
- 1.00
- GRM
- 8.7
CMA / ARV
- ARV (median comp)
- $193,734
- List price
- $159,900
- Delta
- -17.46%
- Verdict
- UNDERPRICED
- Comps
- 20 within 1.0 mi
Show comp detail 12 sales within ~0.75 mi
| Address | Dist | Beds/Ba | Sqft | Sold | Price | $/sf | Match |
|---|---|---|---|---|---|---|---|
| 702 Berlin | 0.20mi | 3/1.0 | 1,296 (0%) | 7mo | $100,000 | $77 | 81 |
| 503 Vickers | 0.38mi | 3/2.0 | 1,328 (+2%) | 4mo | $183,900 | $138 | 75 |
| 1229 Flanders Ave | 0.52mi | 3/2.0 | 1,295 (-0%) | 1mo | $230,000 | $178 | 75 |
| 1166 Fitch | 0.49mi | 3/2.0 | 1,292 (-0%) | 3mo | $225,000 | $174 | 74 |
| 1918 Brunswick | 0.13mi | 3/2.0 | 1,438 (+11%) | 3mo | $239,000 | $166 | 73 |
| 918 Berlin Ave | 0.24mi | 3/2.0 | 1,383 (+7%) | 6mo | $282,500 | $204 | 73 |
| 1161 Fitch | 0.48mi | 3/2.0 | 1,300 (+0%) | 6mo | $235,000 | $181 | 72 |
| 1201 Brighton | 0.61mi | 3/2.0 | 1,259 (-3%) | 2mo | $260,000 | $207 | 65 |
| 1214 Chalmers Ave | 0.66mi | 3/2.0 | 1,261 (-3%) | 1mo | $229,900 | $182 | 64 |
| 862 W Southcross | 0.52mi | 3/2.0 | 1,407 (+9%) | 1mo | $235,000 | $167 | 61 |
| 1407 Crystal | 0.45mi | 3/2.0 | 1,104 (-15%) | 8mo | $165,000 | $149 | 48 |
| 234 Southway | 0.70mi | 3/2.0 | 1,422 (+10%) | 9mo | $198,000 | $139 | 44 |
Match score weights: distance 35% · size 25% · config 20% · recency 20%. Top-matched comps best support the ARV.
Projected returns pro-forma
-0.45% appreciation · 3.0% rent growth · sell at horizon
- IRR
- -3.8%
- Equity multiple
- 0.83×
- Total profit
- $-7,703
- Equity at exit
- $42,872
- IRR
- 2.5%
- Equity multiple
- 1.25×
- Total profit
- $11,222
- Equity at exit
- $48,773
Cash invested: $44,772 (down + closing). Projections, not guarantees.
Landlord ↔ Tenant lean methodology
- Overall (STATE)
- 87 Strongly Landlord-Friendly
- State Texas
- 87 Strongly Landlord-Friendly · R+5
- County
- — inherits STATE
- City
- — inherits STATE
ZIP-level market 78211
- Home prices YoY
- -0.2%
- Active inventory
- 162
- Price-to-rent
- 8.7×
Monthly cashflow live
- Estimated rent
- $1,536 high interval (Pro) →
- Mortgage (P&I)
- −$839
- Tax from tax record
- −$305 /mo · $3,660/yr
- Insurance
- −$67
- HOA
- −$0
- Vacancy / Maint / Mgmt
- −$323
- Net cashflow
- $4
Break-even live
Sensitivity live
| Price | -10% $94 | -5% $49 | +0% $4 | +5% $-42 | +10% $-87 |
|---|---|---|---|---|---|
| Rent | -10% $-118 | -5% $-57 | +0% $4 | +5% $64 | +10% $125 |
| Rate | -1.0pp $84 | -0.5pp $44 | base $4 | +0.5pp $-38 | +1.0pp $-80 |
UW: 25.0% down · 7.5% · 30yr · 1.5% tax · 5.0% vac · 8.0% maint · 8.0% mgmt
Financing live
Cash to close
- Down payment
- $39,975
- Closing costs
- $4,797
- Reserves months
- —
- Total cash needed
- —
Loan-product check · same deal, 3 products live
Conventional
25% down · 7.5% · 30yr
- Down + closing
- —
- Monthly P&I
- —
- Monthly cashflow
- —
- DSCR
- —
- Eligible?
- —
Personal DTI + credit; lowest rate.
DSCR
20% down · 8.5% · 30yr
- Down + closing
- —
- Monthly P&I
- —
- Monthly cashflow
- —
- DSCR
- —
- Eligible?
- —
No personal income docs; deal must DSCR.
Hard money
10% down · 12.0% · 12mo
- Down + closing
- —
- Monthly P&I
- —
- Monthly cashflow
- —
- DSCR
- —
- Eligible?
- —
Short-term bridge; refi at stabilization.
Rent comps 24 comps
| Address | Beds | Baths | Sqft | Rent | $/sqft | DOM | Units | Dist |
|---|---|---|---|---|---|---|---|---|
| 507 Linden Ave San Antonio, TX | 3.0 | 2.5 | 1668 | $1,695 | $1.02 | 5d | 1 | 0.35mi |
| 1467 W Gerald Ave San Antonio, TX | 3.0 | 2.5 | 1120 | $1,300 | $1.16 | 11d | 1 | 0.46mi |
| 328 Elks Dr San Antonio, TX | 4.0 | 1.0 | 1600 | $1,500 | $0.94 | 24d | 1 | 0.51mi |
| 422 Wagner Ave San Antonio, TX | 3.0 | 2.0 | 1220 | $1,750 | $1.43 | 44d | 1 | 0.55mi |
| 923 Whitman Ave San Antonio, TX | 4.0 | 2.0 | 1208 | $1,700 | $1.41 | 15d | 1 | 0.55mi |
| 737 W Mayfield Blvd San Antonio, TX | 3.0 | 1.0 | 1150 | $1,462 | $1.27 | 44d | 1 | 0.71mi |
| 1130 Sims Ave San Antonio, TX | 3.0 | 2.0 | 1206 | $1,300 | $1.08 | 24d | 1 | 0.87mi |
| 118 Carthage Ct San Antonio, TX | 3.0 | 2.0 | 1368 | $1,450 | $1.06 | 18d | 1 | 0.87mi |
| 909 Sims Ave San Antonio, TX | 4.0 | 2.0 | 1400 | $1,750 | $1.25 | 24d | 1 | 0.92mi |
| 834 Division Ave Unit 2 San Antonio, TX | 2.0 | 1.0 | 936 | $950 | $1.01 | 5d | 1 | 1.02mi |
| 616 Sims Ave San Antonio, TX | 3.0 | 1.0 | 1148 | $875 | $0.76 | 44d | 1 | 1.06mi |
| 1862 Kendalia Ave San Antonio, TX | 3.0 | 1.0 | 1345 | $1,350 | $1.00 | 24d | 1 | 1.12mi |
| 1067 Rayburn Dr San Antonio, TX | 4.0 | 2.0 | 1744 | $1,495 | $0.86 | 5d | 1 | 1.16mi |
| 463 Linares St San Antonio, TX | 3.0 | 1.0 | 1220 | $1,400 | $1.15 | 24d | 1 | 1.23mi |
| 838 McCauley Blvd San Antonio, TX | 3.0 | 2.0 | 1009 | $1,646 | $1.63 | 15d | 1 | 1.29mi |
| 1425 Quintana Rd Unit 1 San Antonio, TX | 3.0 | 1.5 | 1200 | $1,345 | $1.12 | 44d | 1 | 1.32mi |
| 150 Hearne San Antonio, TX | 2.0 | 1.0 | 1044 | $1,400 | $1.34 | 24d | 1 | 1.33mi |
| 503 W Hart Ave San Antonio, TX | 3.0 | 1.0 | 1232 | $1,750 | $1.42 | 11d | 1 | 1.41mi |
| 575 Division Ave San Antonio, TX | 3.0 | 1.5 | 1362 | $1,950 | $1.43 | 18d | 1 | 1.41mi |
| 425 San Blas San Antonio, TX | 2.0 | 1.0 | 1568 | $1,285 | $0.82 | 44d | 1 | 1.45mi |
| 611 Brunswick Blvd San Antonio, TX | 3.0 | 2.0 | 1080 | $1,700 | $1.57 | 15d | 1 | 1.45mi |
| 611 Brunswick Blvd San Antonio, TX | 3.0 | 2.0 | 1080 | $1,700 | $1.57 | 24d | 1 | 1.45mi |
| 2114 Jupiter St San Antonio, TX | 3.0 | 3.0 | 1233 | $1,457 | $1.18 | 22d | 1 | 1.46mi |
| 607 Brunswick Blvd San Antonio, TX | 3.0 | 2.0 | 1350 | $1,750 | $1.30 | 44d | 1 | 1.46mi |
Listing history 26 events
-
2026-06-21days on market $159,900 Active 103 DOM
-
2026-06-18days on market $159,900 Active 100 DOM
-
2026-06-18status $159,900 Active 99 DOM
-
2026-06-17days on market $159,900 Price Change 99 DOM
-
2026-06-16days on market $159,900 Price Change 98 DOM
-
2026-06-15days on market $159,900 Price Change 97 DOM
-
2026-06-13days on market $159,900 Price Change 95 DOM
-
2026-06-13days on market $159,900 Price Change 94 DOM
-
2026-06-09days on market $159,900 Price Change 91 DOM
-
2026-06-08days on market $159,900 Price Change 90 DOM
-
2026-06-08pricestatus $159,900 Price Change 89 DOM
-
2026-06-07days on market $169,900 Active 89 DOM
-
2026-06-04days on market $169,900 Active 86 DOM
-
2026-06-03days on market $169,900 Active 85 DOM
-
2026-06-02days on market $169,900 Active 84 DOM
-
2026-06-01days on market $169,900 Active 83 DOM
-
2026-05-31days on market $169,900 Active 82 DOM
-
2026-03-10$169,900 New 730-char remark
Show marketing remark (730 chars)
Charming 3-bedroom, 2-bath home located on the desirable south side of San Antonio! This well-maintained 1,296 square foot home offers a comfortable and functional layout perfect for families, first-time buyers, or investors. Enjoy a spacious living area that flows seamlessly into the kitchen and dining space, creating a warm and inviting atmosphere for everyday living and entertaining. The primary suite features a private full bath, while the additional bedrooms provide flexibility for guests, a home office, or growing families. Conveniently located near schools, shopping, dining, and major highways, this home offers both comfort and accessibility. Don't miss the opportunity to make this South San Antonio gem your own.
-
2009-10-28soldstatus
-
2009-10-26soldstatus 292-char remark
Show marketing remark (292 chars)
Just Remodled home with Berber Carpet and Ceramic Tile. Living Room and Bedrooms have Ceiling Fans. The interior walls have been refinished and freshly painted. Home has a very large mud room and Laundry, that can be used for Storage or a 4th bedroom. The lot extends from one street to next.
-
2009-10-22historical 292-char remark
Show marketing remark (292 chars)
Just Remodled home with Berber Carpet and Ceramic Tile. Living Room and Bedrooms have Ceiling Fans. The interior walls have been refinished and freshly painted. Home has a very large mud room and Laundry, that can be used for Storage or a 4th bedroom. The lot extends from one street to next.
-
2008-04-09$69,900 292-char remark
Show marketing remark (292 chars)
Just Remodled home with Berber Carpet and Ceramic Tile. Living Room and Bedrooms have Ceiling Fans. The interior walls have been refinished and freshly painted. Home has a very large mud room and Laundry, that can be used for Storage or a 4th bedroom. The lot extends from one street to next.
-
2007-10-03soldstatus
-
2007-10-01soldstatus
-
2007-09-10historical
-
2007-08-08$49,000
ⓘ Source: listings_history table (triggers on properties + properties_extension) + one-shot
backfill from property_details.listing_events for pre-trigger history.
Tax reassessment forecast TX · Resets to sale price
- Current annual tax
- $3,660 · $305/mo
- Projected year-2 tax
- $3,660 · $305/mo
- Expected delta
- $0/yr ($0/mo · 0.0%)
ⓘ Screening estimate from a state-policy table — verify with the county assessor before closing.
Climate risk First Street
- Flood 1/10 Low FEMA zone X (unshaded) · 0% chance over 30 yrs
- Wildfire 1/10 Low
- Heat 8/10 Severe 7 d/yr ≥108°F today · 22 d/yr by 30 yrs out
- Wind 8/10 Severe 80% chance of damaging wind over 30 yrs
- Air quality 2/10 Low 1 unhealthy d/yr today · 2 by 30 yrs out
Nearby sold comps map
Loading sold comps map…
Walkable amenities ~0.75 mi
Loading nearby amenities…
Taxation est. · year 1
- Rental income
- $18,437
- − Mortgage interest
- −$8,957
- − Property taxes
- −$3,660
- − Insurance
- −$800
- − Repairs & maintenance
- −$1,475
- − Management
- −$1,475
- − Depreciation
- −$4,652
- Taxable loss
- −$2,581
- Est. tax savings @ 24.0%
- +$619
- After-tax cash flow
- $663/yr
For passive investors: Depreciation is non-cash, so a rental often shows a tax loss while cash-flowing — sheltering income. Rental losses are passive: they offset passive income freely, and up to $25,000/yr can offset ordinary (W-2) income if you actively participate and your MAGI is under $100k (phasing out to $0 by $150k); unused losses carry forward. On sale, claimed depreciation is recaptured at up to 25%, and gains may owe capital-gains tax (a 1031 exchange can defer both). Figures are a year-1 estimate at your 24.0% rate — not tax advice; consult a CPA.
Schools (NCES district)
- District
- Harlandale ISD
- NCES district ID
- 4822470
- Math proficiency
- 20% ▼ -22.00%
- Reading proficiency
- 27% ▼ -9.00%
- Median HH income
- $33,850
- Composite
- 19.25/100
- National rank
- #8806
- State rank
- #748 of 826 in TX
Livability — San Antonio
- Score
- 80/100
- State rank
- #31
- US rank
- #1616
Category grades
Schools grade is shown separately in the Schools card above.
Census & demographics
- Census place
- San Antonio, TX
- County
- Bexar County · 1,990,555 people
- City population
- 1,806,925
- Metro
- San Antonio-New Braunfels, TX
- Population (ZIP)
- 30,857
- Household income
- $55,436
- Rent vs Own
- Severe rent burden
- 729.0
Population outlook (Bexar County) Hauer SSP2
- Today (2025)
- 2,336,851 people
- By 2030
- 2,560,728 · +9.6%
- By 2040
- 3,020,569 · +29.3%
- By 2050
- 3,493,522 · +49.5%
- By 2075
- 4,668,459 · +99.8%
- By 2100
- 5,533,242 · +136.8%
Race, ethnicity, and origin ACS 2023
- Neighborhood character
- Predominantly Hispanic (93%)
- Race & ethnicity
- Hispanic / Latino 93% Two or more races 30% White 5% Black 1% Native American 1%
- Hispanic origin (detail)
- Mexican 76%
- Foreign-born
- 18% · Canada
- Languages at home
- 35% English-only · Spanish 65%
Political lean MEDSL · Bexar
- 2024 margin
- Lean D (+9.8) · D 54.3% · R 44.6% · Other 1.1%
- 2008→2024 swing
- +4.2pp toward D · 2008: 5.6pp · 2024: 9.8pp
- All cycles
- 2024: D+9.8 2020: D+18.2 2016: D+13.5 2012: D+4.6 2008: D+5.6
Not yet ingested
- Civics
- —
Market trends
- HPI YoY
- ▼ -0.45%
- Current HPI
- 241.1709
- Rent YoY
- —
- Metro
- San Antonio-New Braunfels, TX
- State GDP YoY
- ▲ 3.95%
- F500 in state
- 110
Industry mix (Fortune 500 HQ in TX)
| Industry | F500 HQs | Revenue |
|---|---|---|
| Energy | 16 | $1,198B |
|
||
| Technology | 5 | $198B |
|
||
| Engineering / Construction | 4 | $72B |
|
||
| Energy Services | 3 | $60B |
|
||
| Utilities | 3 | $41B |
|
||
| Healthcare | 2 | $330B |
|
||
Price history
+246.7% since first listed9 events — show timeline
- 2026-03-10 Listed $169,900 LERA
- 2009-10-28 Sold (Public Records) — Public Records
- 2009-10-26 Sold (MLS) — LERA
- 2009-10-22 Listing Removed — LERA
- 2008-04-09 Listed $69,900 LERA
- 2007-10-03 Sold (Public Records) — Public Records
- 2007-10-01 Sold (MLS) — LERA
- 2007-09-10 Listing Removed — LERA
- 2007-08-08 Listed $49,000 LERA
Property tax history
+6.1%/yrLatest (2025): $3,660 · -3.7% YoY. Source: county tax records.
Cash-flow waterfall
monthlySold comps — $/sqft
last 12 mo · ≤1 miLoading sold comps…