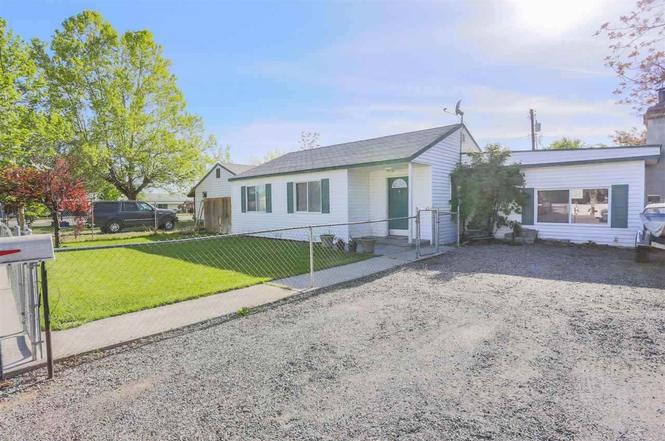
818 S Juniper St · Kennewick, WA
Flood risk 1/10 · Minimal
- FEMA flood zone
- X
- Chance of flooding over 30 yrs
- 0.0%
- Est. flood insurance / yr
- $507 – $1,088
Fire risk 3/10 · Minor
- Est. fire insurance / yr
- $604 – $1,122
Heat risk 5/10 · Moderate
- Hot days now (above 100°F)
- 6 days/yr
- Hot days in 30 yrs
- 13 days/yr
Wind risk 1/10 · Minimal
- Chance of severe wind over 30 yrs
- —
Air-quality risk 8/10 · Major
- Unhealthy air days now
- 15 days/yr
- Unhealthy air days in 30 yrs
- 16 days/yr
Risk factors via First Street. Map © Google.
Why this score? — see what drove the C- grade
The composite is a weighted blend of 9 inputs, each scored 0–100. Each bar is that input's sub-score; the figure is the points it added to the 100-point composite (weight × sub-score).
- Cash flow +15.3/30.0
- ARV discount +15.0/15.0
- DSCR +4.7/10.0
- Schools +4.6/10.0
- Livability +3.9/5.0
- Rent growth +3.3/5.0
- 1% rule +2.8/10.0
- Condition / age +2.5/5.0
- Appreciation +0.0/10.0
$249,000
🖨 Deal sheet (PDF) 📄 Offer letter ✓ Due diligence
Listing remarks MLS
You will be pleasantly surprised at all the beautiful updates in this Kennewick home! New appliances, vaulted ceiling and breakfast bar in the well designed kitchen, 3 bedrooms, 2 bathrooms, 1466 sq ft, fireplace with insert in the living room, RV/boat parking, and a fantastic backyard. Affordable and Adorable home!
Key facts
- Carpeted bedrooms
- Covered carport
- Vinyl siding
Tags
Property features AI
Exterior
- Parking: One parking space total; One covered space; Carport; Off-street and on-street parking (no garage)
- Utilities: Public water; Electricity on property; Cable connected; Natural gas connected
- Home design: Single-family residence; Two-story home; Site-built on owned lot; New construction
- Construction: Vinyl and wood siding; Composition roof; Concrete perimeter foundation; Built recently (new construction)
- Exterior features: Patio; Full fencing; Exterior lighting; Paved road access
Interior
- Kitchen: Dishwasher, Microwave, Oven, Refrigerator, Range
- Bathrooms: Two full bathrooms
- Heating & cooling: Forced air heating (natural gas)
- Interior features: Dishwasher, Microwave, Oven, Refrigerator, Range; One masonry fireplace; No basement
Neighborhood map
What this means for you Summary
Snapshot
- This is a 3-bed/2.0-bath single-family listed at $249k.
Deal economics
- At list price, monthly cash flow is $92 ($1k/yr) — positive.
- The deal already cash-flows at list — no discount required.
- To meet the 1% rule (rent ≥ 1% of price), the offer needs to be $195k (21.6% below list).
- Recommended offer: $195k (21.6% below list) — sets the bar for 1% rule.
- Cap rate 6.7% vs local median 3.3% in Kennewick — top-decile yield for the area; either an underpriced asset or a hidden risk that comps aren't pricing in. Stress-test before assuming the spread holds.
Location & tenants
- Location reads 78/100 on livability (#131 in WA, #2,599 nationally) — a middle-class / working-renter tenant base. Strengths: commute A+, housing A+, health & safety A; Watch: amenities D+, crime F.
- Kennewick School District (urban): math 43% / reading 58% proficiency, ranked #141 of 291 in WA (top 48%) — acceptable for families but not a draw, mixed tenant base, ~2y average lease.
- Zoned schools: Eastgate Elementary School (494 students, 85% FRL); Park Middle School (692 students, 89% FRL); Kennewick High School (1,785 students, 69% FRL) — zoned schools average 81% FRL vs 48% district-wide (33 pts higher); higher-poverty schools than district average — tighter screening recommended.
- Market conditions: Rents rising (+3.4%/yr); 292 active listings in the ZIP; 7 comparable units currently listed for rent nearby; rentals at typical pace (median 16d on market — plan ~3-4 weeks tenant-placement turnaround); 43% of comp listings sitting > 30 days — soft ceiling on asking rent; 1,532 units permitted in Benton County in 2024 (389 in 5+ unit buildings).
- This rent runs 37% of the median local income ($63k/yr) — at the standard rent-burdened threshold; future hikes will face affordability resistance.
Forward outlook
- Local home prices are declining (-3.0%/yr); year-one equity from $2k of loan paydown is wiped out by about $7k of value loss. Plan a longer hold.
- Benton County population projected at +32% by 2050 — long-run rental-demand tailwind backs the buy-and-hold thesis.
Negotiation context
- It's been on market 38 days — a 3% lower offer ($242k) is reasonable based on typical stale-listing flexibility.
- 4 sale attempts since 24y ago; this cycle's ask has dropped $51k (17%) from the opening price — seller is motivated, your offer sets the floor, not the list.
- Current owner paid $116k; list at $249k implies a 115% gain — meaningful room to come down on a strong offer.
Risks & watch-outs
- Watch-outs: built in 1940 — expect roof / HVAC / electrical / plumbing capex.
- Climate carrying-cost: extreme-heat days projected 6→13/yr by 2055 (HVAC capex compounding) — expect insurance premiums to compound above CPI over the hold.
Questions for the listing agent
- It's been on market 38 days. Have you received any prior offers? Is the seller open to a 22% concession, seller financing, or rate buy-down credit?
- Built in 1940 — when were the roof, HVAC, electrical panel, plumbing, and water heater last replaced?
- Is there a deadline driving the sale (1031 exchange, divorce, estate, relocation)? That informs how much negotiation room exists.
- Schools are D-rated, which usually means shorter tenancies and higher turnover. Who's the typical renter profile here, and what's been the actual vacancy rate?
- Crime grade is F in this area — have there been break-ins, vandalism, or insurance claims at this property in the last 3 years? What carrier currently insures it and at what premium?
- What's the average days-on-market for RENTAL listings here right now (not sales)? A rising rental-DOM trend means longer vacancies and softer asking-rent achievability than the comps imply.
- What's the recent tenant-quality profile in this submarket — average credit score on applications, eviction rate, late-payment / NSF rate, and stable-employment percentage? A property-management company in the area should have these aggregated.
- How much new for-sale + rental construction is in the pipeline within 1–3 miles? Heavy new supply typically softens prices + rents 12–24 months out; constrained supply supports both.
Investment metrics
- 1% rule
- 0.78% ✗
- Cap rate
- 6.73%
- Cash-on-cash
- 1.58%
- DSCR
- 1.07
- GRM
- 10.6
CMA / ARV
- ARV (on-the-fly)
- $354,486
- Comps found
- 12
Show comp detail 12 sales within ~0.75 mi
| Address | Dist | Beds/Ba | Sqft | Sold | Price | $/sf | Match |
|---|---|---|---|---|---|---|---|
| 514 S Ivy St | 0.22mi | 3/2.0 | 1,456 (+1%) | 7mo | $295,000 | $203 | 82 |
| 218 E 8th Pl | 0.43mi | 3/2.0 | 1,416 (-2%) | 1mo | $246,000 | $174 | 76 |
| 1401 E 6th Ave | 0.30mi | 3/2.0 | 1,352 (-6%) | 8mo | $324,900 | $240 | 70 |
| 620 E 7th Ave | 0.29mi | 3/2.0 | 1,320 (-8%) | 5mo | $325,000 | $246 | 68 |
| 2135 S Elm Pl | 0.68mi | 3/2.0 | 1,440 (-0%) | 5mo | $408,000 | $283 | 64 |
| 2150 S Elm Pl | 0.68mi | 4/2.0 (+1) | 1,435 (-0%) | 1mo | $412,900 | $288 | 61 |
| 1140 S Cedar Pl | 0.42mi | 3/3.0 | 1,595 (+11%) | 1mo | $339,900 | $213 | 58 |
| 209 E 16th Ave | 0.60mi | 3/2.0 | 1,536 (+7%) | 4mo | $389,900 | $254 | 58 |
| 821 S Elm St | 0.31mi | 3/2.5 | 1,250 (-13%) | 5mo | $319,998 | $256 | 57 |
| 706 S Alder St | 0.62mi | 4/1.0 (+1) | 1,477 (+2%) | 3mo | $296,000 | $200 | 56 |
| 2183 S Elm Pl | 0.68mi | 3/2.0 | 1,363 (-5%) | 5mo | $394,900 | $290 | 55 |
| 406 S Fir St | 0.46mi | 3/1.0 | 1,610 (+12%) | 1mo | $315,000 | $196 | 54 |
Match score weights: distance 35% · size 25% · config 20% · recency 20%. Top-matched comps best support the ARV.
Projected returns pro-forma
-3.0% appreciation · 3.39% rent growth · sell at horizon
- IRR
- -13.5%
- Equity multiple
- 0.51×
- Total profit
- $-33,879
- Equity at exit
- $37,127
- IRR
- -4.1%
- Equity multiple
- 0.72×
- Total profit
- $-19,356
- Equity at exit
- $21,529
Cash invested: $69,720 (down + closing). Projections, not guarantees.
Landlord ↔ Tenant lean methodology
- Overall (STATE)
- 28 Tenant-Leaning
- State Washington
- 28 Tenant-Leaning · D+8
- County
- — inherits STATE
- City
- — inherits STATE
ZIP-level market 99336
- Rents YoY
- 3.4%
- Active inventory
- 292
- Price-to-rent
- 10.6×
Monthly cashflow live
- Estimated rent
- $1,953 high interval (Pro) →
- Mortgage (P&I)
- −$1,306
- Tax from tax record
- −$42 /mo · $500/yr
- Insurance
- −$104
- HOA
- −$0
- Vacancy / Maint / Mgmt
- −$410
- Net cashflow
- $92
Break-even live
Sensitivity live
| Price | -10% $233 | -5% $162 | +0% $92 | +5% $-264 | +10% $-350 |
|---|---|---|---|---|---|
| Rent | -10% $-63 | -5% $15 | +0% $92 | +5% $169 | +10% $246 |
| Rate | -1.0pp $217 | -0.5pp $155 | base $92 | +0.5pp $27 | +1.0pp $-39 |
UW: 25.0% down · 7.5% · 30yr · 1.5% tax · 5.0% vac · 8.0% maint · 8.0% mgmt
Financing live
Cash to close
- Down payment
- $62,250
- Closing costs
- $7,470
- Reserves months
- —
- Total cash needed
- —
Loan-product check · same deal, 3 products live
Conventional
25% down · 7.5% · 30yr
- Down + closing
- —
- Monthly P&I
- —
- Monthly cashflow
- —
- DSCR
- —
- Eligible?
- —
Personal DTI + credit; lowest rate.
DSCR
20% down · 8.5% · 30yr
- Down + closing
- —
- Monthly P&I
- —
- Monthly cashflow
- —
- DSCR
- —
- Eligible?
- —
No personal income docs; deal must DSCR.
Hard money
10% down · 12.0% · 12mo
- Down + closing
- —
- Monthly P&I
- —
- Monthly cashflow
- —
- DSCR
- —
- Eligible?
- —
Short-term bridge; refi at stabilization.
Rent comps 7 comps
| Address | Beds | Baths | Sqft | Rent | $/sqft | DOM | Units | Dist |
|---|---|---|---|---|---|---|---|---|
| 402 E 10th Ave Kennewick, WA | 3.0 | 1.0 | 924 | $1,495 | $1.62 | 45d | 1 | 0.38mi |
| 402 E 10th Ave Lot 10 Kennewick, WA | 3.0 | 1.0 | 924 | $1,425 | $1.54 | 45d | 1 | 0.38mi |
| 212 N Elm St Kennewick, WA | 1.0–3.0 | 1.5–3.5 | 1782 | $4,705 | $2.64 | 15d | 19 | 0.89mi |
| 919 E 27th Ave Kennewick, WA | 2.0 | 1.0 | 900 | $1,195 | $1.33 | 45d | 1 | 1.05mi |
| 705 S Ione St Kennewick, WA | 3.0 | 1.5 | 1056 | $2,000 | $1.89 | 15d | 1 | 1.29mi |
| 1114 W 10th Ave Kennewick, WA | 3.0 | 1.0–2.0 | 829 | $1,551 | $1.87 | 15d | 41 | 1.47mi |
| 1000 W 5th Ave Kennewick, WA | 3.0–4.0 | 2.0 | 1157 | $1,371 | $1.18 | 15d | 4 | 1.48mi |
Listing history 14 events
-
2026-04-13status Pending
-
2026-04-07price $249,000
-
2026-03-23price $289,900
-
2026-03-03$299,900 Active
-
2025-09-29price $305,000
-
2025-05-29price $315,000
-
2014-12-19soldstatus $116,000 317-char remark
Show marketing remark (317 chars)
You will be pleasantly surprised at all the beautiful updates in this Kennewick home! New appliances, vaulted ceiling and breakfast bar in the well designed kitchen, 3 bedrooms, 2 bathrooms, 1466 sq ft, fireplace with insert in the living room, RV/boat parking, and a fantastic backyard. Affordable and Adorable home!
-
2014-12-19soldstatus $116,000
Show marketing remark (317 chars)
You will be pleasantly surprised at all the beautiful updates in this Kennewick home! New appliances, vaulted ceiling and breakfast bar in the well designed kitchen, 3 bedrooms, 2 bathrooms, 1466 sq ft, fireplace with insert in the living room, RV/boat parking, and a fantastic backyard. Affordable and Adorable home!
-
2014-09-09$120,000 317-char remark
Show marketing remark (317 chars)
You will be pleasantly surprised at all the beautiful updates in this Kennewick home! New appliances, vaulted ceiling and breakfast bar in the well designed kitchen, 3 bedrooms, 2 bathrooms, 1466 sq ft, fireplace with insert in the living room, RV/boat parking, and a fantastic backyard. Affordable and Adorable home!
-
2014-04-30$120,000
-
2003-04-11soldstatus $104,000
-
2003-04-11soldstatus $104,000
-
2002-07-29$104,000
-
2002-05-28soldstatus $61,000
ⓘ Source: listings_history table (triggers on properties + properties_extension) + one-shot
backfill from property_details.listing_events for pre-trigger history.
Tax reassessment forecast WA · Resets to sale price
- Current annual tax
- $500 · $42/mo
- Projected year-2 tax
- $2,440 · $203/mo
- Expected delta
- +$1,940/yr (+$162/mo · 388.2%)
ⓘ Screening estimate from a state-policy table — verify with the county assessor before closing.
Climate risk First Street
- Flood 1/10 Low FEMA zone X · 0% chance over 30 yrs
- Wildfire 3/10 Moderate
- Heat 5/10 Major 6 d/yr ≥100°F today · 13 d/yr by 30 yrs out
- Wind 1/10 Low
- Air quality 8/10 Severe 15 unhealthy d/yr today · 16 by 30 yrs out
Nearby sold comps map
Loading sold comps map…
Walkable amenities ~0.75 mi
Loading nearby amenities…
Taxation est. · year 1
- Rental income
- $23,435
- − Mortgage interest
- −$13,948
- − Property taxes
- −$500
- − Insurance
- −$1,245
- − Repairs & maintenance
- −$1,875
- − Management
- −$1,875
- − Depreciation
- −$7,244
- Taxable loss
- −$3,251
- Est. tax savings @ 24.0%
- +$780
- After-tax cash flow
- $1,880/yr
For passive investors: Depreciation is non-cash, so a rental often shows a tax loss while cash-flowing — sheltering income. Rental losses are passive: they offset passive income freely, and up to $25,000/yr can offset ordinary (W-2) income if you actively participate and your MAGI is under $100k (phasing out to $0 by $150k); unused losses carry forward. On sale, claimed depreciation is recaptured at up to 25%, and gains may owe capital-gains tax (a 1031 exchange can defer both). Figures are a year-1 estimate at your 24.0% rate — not tax advice; consult a CPA.
Schools (NCES district)
- District
- Kennewick School District
- NCES district ID
- 5303930
- Math proficiency
- 43% ▼ -1.00%
- Reading proficiency
- 58% ▬ 0.00%
- Median HH income
- $54,191
- Composite
- 45.56/100
- National rank
- #5667
- State rank
- #141 of 291 in WA
Livability — Kennewick
- Score
- 78/100
- State rank
- #131
- US rank
- #2599
Category grades
Schools grade is shown separately in the Schools card above.
Census & demographics
- Census place
- Kennewick, WA
- County
- Benton County · 186,895 people
- City population
- 104,655
- Metro
- Kennewick-Richland, WA
- Population (ZIP)
- 50,735
- Household income
- $62,527
- Rent vs Own
- Severe rent burden
- 2605.0
Population outlook (Benton County) Hauer SSP2
- Today (2025)
- 219,421 people
- By 2030
- 233,813 · +6.6%
- By 2040
- 262,134 · +19.5%
- By 2050
- 290,100 · +32.2%
- By 2075
- 363,525 · +65.7%
- By 2100
- 418,667 · +90.8%
Race, ethnicity, and origin ACS 2023
- Neighborhood character
- Diverse neighborhood (Simpson 0.56)
- Race & ethnicity
- White 55% Hispanic / Latino 37% Two or more races 15% Black 3% Asian 2% Native American 1%
- Hispanic origin (detail)
- Mexican 31% Cuban 2%
- Common ancestry
- Portuguese 4% Slovak 3% Romanian 1%
- Foreign-born
- 16% · Canada, Jamaica
- Languages at home
- 68% English-only · Spanish 29% Arabic 1%
Political lean MEDSL · Benton
- 2024 margin
- Strong R (+21.9) · D 37.7% · R 59.6% · Other 2.7%
- 2008→2024 swing
- +4.2pp toward D · 2008: -26.1pp · 2024: -21.9pp
- All cycles
- 2024: R+21.9 2020: R+21.0 2016: R+26.6 2012: R+27.0 2008: R+26.1
Not yet ingested
- Civics
- —
Market trends
- HPI YoY
- ▼ -408.26%
- Current HPI
- 256.1143
- Rent YoY
- ▲ 3.39%
- Metro
- Kennewick-Richland, WA
- State GDP YoY
- ▲ 4.65%
- F500 in state
- 22
Industry mix (Fortune 500 HQ in WA)
| Industry | F500 HQs | Revenue |
|---|---|---|
| Retail | 2 | $269B |
|
||
| Technology / Retail | 1 | $638B |
|
||
| Technology | 1 | $245B |
|
||
| Telecommunications | 1 | $38B |
|
||
| Food / Beverage | 1 | $36B |
|
||
| Automotive / Trucks | 1 | $34B |
|
||
Price history
+308.2% since first listed14 events — show timeline
- 2026-04-13 Pending — PACMLS
- 2026-04-07 Price Changed $249,000 PACMLS
- 2026-03-23 Price Changed $289,900 PACMLS
- 2026-03-03 Listed $299,900 PACMLS
- 2025-09-29 Price Changed $305,000 PACMLS
- 2025-05-29 Price Changed $315,000 PACMLS
- 2014-12-19 Sold (Public Records) $116,000 Public Records
- 2014-12-19 Sold (MLS) $116,000 PACMLS
- 2014-09-09 Listed $120,000 PACMLS
- 2014-04-30 Listed $120,000 PACMLS
- 2003-04-11 Sold (Public Records) $104,000 Public Records
- 2003-04-11 Sold (MLS) $104,000 PACMLS
- 2002-07-29 Listed $104,000 PACMLS
- 2002-05-28 Sold (Public Records) $61,000 Public Records
Property tax history
-9.2%/yrLatest (2026): $500 · -2.3% YoY. Source: county tax records.
Cash-flow waterfall
monthlySold comps — $/sqft
last 12 mo · ≤1 miLoading sold comps…