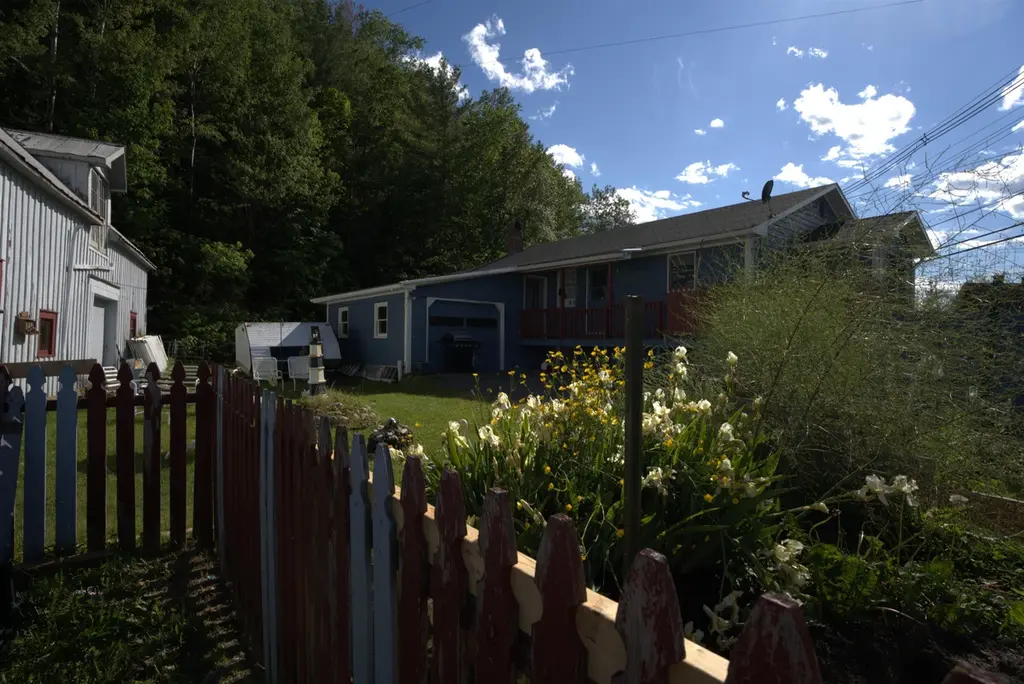
8 Birch St · Brighton, VT
Flood risk 1/10 · Minimal
- FEMA flood zone
- X
- Chance of flooding over 30 yrs
- 0.0%
- Est. flood insurance / yr
- $507 – $1,088
Fire risk 1/10 · Minimal
- Est. fire insurance / yr
- $480 – $892
Heat risk 1/10 · Minimal
- Hot days now (above 86°F)
- 7 days/yr
- Hot days in 30 yrs
- 17 days/yr
Wind risk 2/10 · Minimal
- Chance of severe wind over 30 yrs
- 4.0%
Air-quality risk 2/10 · Minimal
- Unhealthy air days now
- 1 days/yr
- Unhealthy air days in 30 yrs
- 1 days/yr
Risk factors via First Street. Map © Google.
Why this score? — see what drove the C grade
The composite is a weighted blend of 9 inputs, each scored 0–100. Each bar is that input's sub-score; the figure is the points it added to the 100-point composite (weight × sub-score).
- Cash flow +15.7/30.0
- ARV discount +15.0/15.0
- Appreciation +7.6/10.0
- Schools +5.0/10.0
- DSCR +4.9/10.0
- 1% rule +3.7/10.0
- Rent growth +2.5/5.0
- Livability +2.5/5.0
- Condition / age +2.5/5.0
$289,000
🖨 Deal sheet 📄 Offer letter ✓ Due diligence
Key facts
- 0.72 acre lot
- Garage
- Built 1980
Property features AI
Finance
- Other: Property contains 2 total units (one 2-bedroom unit and one 1-bedroom unit)
Exterior
- Parking: Garage with capacity for 1 car; Walkout, garage access for one unit
- Utilities: Public water; Public sewer; 200 Amp electric service; Electric company: Vermont Electric; Internet available by DSL, cable, or satellite; Cable and phone service by XFinity; Satellite service available; Fuel delivered by Butler
- Home design: Raised ranch style; Manufactured home; Existing construction; Blue exterior color; Built in 1980; Water view (Island Pond) but not waterfront
- Construction: Clapboard exterior; Shingle roof; Concrete basement foundation
- Exterior features: Corner lot; Lake view of Island Pond; Level lot in town, near schools; Paved driveway; Public maintained road frontage
Interior
- Bedrooms: One unit with 2 bedrooms; One unit with 1 bedroom
- Bathrooms: Two full bathrooms total; Each unit has one full bathroom
- Heating & cooling: Baseboard heating; Electric heating; Hot air heating; No central cooling
- Interior features: Basement with walkout access; Basement partially finished with daylight windows and concrete floor; Basement includes exterior stairs and apartments (separate access)
Neighborhood map
What this means for you Summary
Snapshot
- This is a 5-bed/2.0-bath single-family listed at $289k.
Deal economics
- At list price, monthly cash flow is $129 ($2k/yr) — positive.
- The deal already cash-flows at list — no discount required.
- To meet the 1% rule (rent ≥ 1% of price), the offer needs to be $250k (13.5% below list).
- Recommended offer: $250k (13.5% below list) — sets the bar for 1% rule.
Location & tenants
- Location reads: area grade C — affects rentability + tenant quality, not the cash-flow math above.
- Market conditions: 17 active listings in the ZIP; 1 comparable units currently listed for rent nearby; 11 units permitted in Essex County in 2024 (0 in 5+ unit buildings).
Forward outlook
- In year one you build about $17k of equity ($2k loan paydown + $15k appreciation (5.3% local appreciation)).
- Essex County population projected at -30% by 2050 — secular population decline; favor cash flow + early exit over multi-decade hold.
- At projected returns (5.3% appreciation + 3.0% rent growth), your $81k cash investment doubles in ~4 years — after that, you're playing with house money.
- By year 3, paydown + projected appreciation supports a ~$42k cash-out refi (75% LTV) — recoverable capital for the next deal without selling this one.
Negotiation context
- Only 1 days on market — expect competitive offers; lowballing is unlikely to land.
- Current owner paid $180k; list at $289k implies a 61% gain — meaningful room to come down on a strong offer.
Questions for the listing agent
- Is there a deadline driving the sale (1031 exchange, divorce, estate, relocation)? That informs how much negotiation room exists.
- What's the average days-on-market for RENTAL listings here right now (not sales)? A rising rental-DOM trend means longer vacancies and softer asking-rent achievability than the comps imply.
- What's the recent tenant-quality profile in this submarket — average credit score on applications, eviction rate, late-payment / NSF rate, and stable-employment percentage? A property-management company in the area should have these aggregated.
- How much new for-sale + rental construction is in the pipeline within 1–3 miles? Heavy new supply typically softens prices + rents 12–24 months out; constrained supply supports both.
Investment metrics
- 1% rule
- 0.87% ✗
- Cap rate
- 6.83%
- Cash-on-cash
- 1.91%
- DSCR
- 1.09
- GRM
- 9.6
CMA / ARV
- ARV (on-the-fly)
- $361,557
- Comps found
- 2
Show comp detail 2 sales within ~0.75 mi
| Address | Dist | Beds/Ba | Sqft | Sold | Price | $/sf | Match |
|---|---|---|---|---|---|---|---|
| 356 Pleasant St | 0.44mi | 4/2.0 (-1) | 2,142 (+12%) | 6mo | $259,000 | $121 | 50 |
| 278 Dale Ave | 0.37mi | 4/2.0 (-1) | 1,743 (-9%) | 23mo | $329,900 | $189 | 44 |
Match score weights: distance 35% · size 25% · config 20% · recency 20%. Top-matched comps best support the ARV.
Projected returns pro-forma
5.26% appreciation · 3.0% rent growth · sell at horizon
- IRR
- 15.1%
- Equity multiple
- 1.98×
- Total profit
- $79,017
- Equity at exit
- $168,300
- IRR
- 15.6%
- Equity multiple
- 3.84×
- Total profit
- $229,793
- Equity at exit
- $294,277
Cash invested: $80,920 (down + closing). Projections, not guarantees.
Landlord ↔ Tenant lean methodology
- Overall (STATE)
- 41 Moderately Tenant-Leaning
- State Vermont
- 41 Moderately Tenant-Leaning · D+15
- County
- — inherits STATE
- City
- — inherits STATE
ZIP-level market 05846
- Home prices YoY
- 3.0%
- Active inventory
- 17
- Price-to-rent
- 9.6×
Monthly cashflow live
- Estimated rent
- $2,500 medium interval (Pro) →
- Mortgage (P&I)
- −$1,516
- Tax from tax record
- −$210 /mo · $2,522/yr
- Insurance
- −$120
- HOA
- −$0
- Vacancy / Maint / Mgmt
- −$525
- Net cashflow
- $129
Break-even live
UW: 25.0% down · 7.5% · 30yr · 1.5% tax · 5.0% vac · 8.0% maint · 8.0% mgmt
Financing live
Cash to close
- Down payment
- $72,250
- Closing costs
- $8,670
- Reserves months
- —
- Total cash needed
- —
Loan-product check · same deal, 3 products live
Conventional
25% down · 7.5% · 30yr
- Down + closing
- —
- Monthly P&I
- —
- Monthly cashflow
- —
- DSCR
- —
- Eligible?
- —
Personal DTI + credit; lowest rate.
DSCR
20% down · 8.5% · 30yr
- Down + closing
- —
- Monthly P&I
- —
- Monthly cashflow
- —
- DSCR
- —
- Eligible?
- —
No personal income docs; deal must DSCR.
Hard money
10% down · 12.0% · 12mo
- Down + closing
- —
- Monthly P&I
- —
- Monthly cashflow
- —
- DSCR
- —
- Eligible?
- —
Short-term bridge; refi at stabilization.
Rent comps 1 comps
| Address | Beds | Baths | Sqft | Rent | $/sqft | DOM | Units | Dist |
|---|---|---|---|---|---|---|---|---|
| 201 Cottage Rd Island Pond, VT | 4.0 | 1.0 | 1400 | $2,500 | $1.79 | 43d | 1 | 0.94mi |
Listing history 2 events
-
2026-06-18$289,000 Active 1 DOM
-
2026-06-17$289,000 Active 1 DOM
ⓘ Source: listings_history table (triggers on properties + properties_extension) + one-shot
backfill from property_details.listing_events for pre-trigger history.
Tax reassessment forecast VT · Partial reset (capped growth)
- Current annual tax
- $2,522 · $210/mo
- Projected year-2 tax
- $4,007 · $334/mo
- Expected delta
- +$1,484/yr (+$124/mo · 58.8%)
ⓘ Screening estimate from a state-policy table — verify with the county assessor before closing.
Climate risk First Street
- Flood 1/10 Low FEMA zone X · 0% chance over 30 yrs
- Wildfire 1/10 Low
- Heat 1/10 Low 7 d/yr ≥86°F today · 17 d/yr by 30 yrs out
- Wind 2/10 Low 4% chance of damaging wind over 30 yrs
- Air quality 2/10 Low 1 unhealthy d/yr today · 1 by 30 yrs out
Nearby sold comps map
Loading sold comps map…
Walkable amenities ~0.75 mi
Loading nearby amenities…
Taxation est. · year 1
- Rental income
- $30,000
- − Mortgage interest
- −$16,188
- − Property taxes
- −$2,522
- − Insurance
- −$1,445
- − Repairs & maintenance
- −$2,400
- − Management
- −$2,400
- − Depreciation
- −$8,407
- Taxable loss
- −$3,363
- Est. tax savings @ 24.0%
- +$807
- After-tax cash flow
- $2,353/yr
For passive investors: Depreciation is non-cash, so a rental often shows a tax loss while cash-flowing — sheltering income. Rental losses are passive: they offset passive income freely, and up to $25,000/yr can offset ordinary (W-2) income if you actively participate and your MAGI is under $100k (phasing out to $0 by $150k); unused losses carry forward. On sale, claimed depreciation is recaptured at up to 25%, and gains may owe capital-gains tax (a 1031 exchange can defer both). Figures are a year-1 estimate at your 24.0% rate — not tax advice; consult a CPA.
Schools (NCES district)
No district data.
Livability — Brighton
No livability data for this city. (Only ~50 U.S. cities are tracked.)
Census & demographics
- Census place
- Island Pond, VT
- Population (ZIP)
- 1,144
Population outlook (Essex County) Hauer SSP2
- Today (2025)
- 5,715 people
- By 2030
- 5,396 · -5.6%
- By 2040
- 4,680 · -18.1%
- By 2050
- 4,025 · -29.6%
- By 2075
- 3,104 · -45.7%
- By 2100
- 2,590 · -54.7%
Race, ethnicity, and origin ACS 2023
- Neighborhood character
- Predominantly White (94%)
- Race & ethnicity
- White 94% Hispanic / Latino 4% Two or more races 2%
- Common ancestry
- Lithuanian 18% Slovak 4% Romanian 2%
- Foreign-born
- 3% · Canada
- Languages at home
- 93% English-only · French/Haitian/Cajun 5% Spanish 3%
Political lean MEDSL · Essex
- 2024 margin
- R (+16.0) · D 39.4% · R 55.4% · Other 5.2%
- 2008→2024 swing
- -30.5pp toward R · 2008: 14.5pp · 2024: -16.0pp
- All cycles
- 2024: R+16.0 2020: R+11.2 2016: R+18.0 2012: D+13.4 2008: D+14.5
Not yet ingested
- Civics
- —
Market trends
- HPI YoY
- ▲ 5.26%
- Current HPI
- 183.2072
- Rent YoY
- —
- Metro
- —
- State GDP YoY
- —
- F500 in state
- 0
Price history
+60.6% since first listed2 events — show timeline
- 2026-06-16 Listed $289,000 PrimeMLS
- 2007-09-22 Sold (Public Records) $180,000 Public Records
Property tax history
+15.0%/yrLatest (2024): $2,522 · +10.2% YoY. Source: county tax records.
Cash-flow waterfall
monthlySold comps — $/sqft
last 12 mo · ≤1 miLoading sold comps…