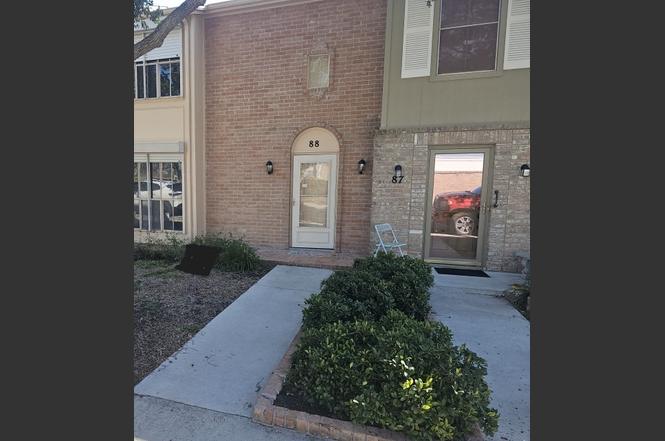
88 Townhouse #88 · Corpus Christi, TX
Flood risk No data
- FEMA flood zone
- —
- Chance of flooding over 30 yrs
- —
- Est. flood insurance / yr
- —
Fire risk No data
- Est. fire insurance / yr
- —
Heat risk No data
- Hot days now (above threshold)
- —
- Hot days in 30 yrs
- —
Wind risk No data
- Chance of severe wind over 30 yrs
- —
Air-quality risk No data
- Unhealthy air days now
- —
- Unhealthy air days in 30 yrs
- —
Risk factors via First Street. Map © Google.
Why this score? — see what drove the B+ grade
The composite is a weighted blend of 9 inputs, each scored 0–100. Each bar is that input's sub-score; the figure is the points it added to the 100-point composite (weight × sub-score).
- Cash flow +29.0/30.0
- ARV discount +15.0/15.0
- 1% rule +10.0/10.0
- DSCR +10.0/10.0
- Livability +3.9/5.0
- Schools +2.8/10.0
- Condition / age +2.2/5.0
- Rent growth +2.1/5.0
- Appreciation +0.0/10.0
$119,900
🖨 Deal sheet (PDF) 📄 Offer letter ✓ Due diligence
Listing remarks
3 bedroom, 2.5 bath 2 story townhome with 2 car garage located in Carrige Park Town House. This property has now been entered into an online auction. The first online event will begin on 4-5-26 thru 4-7-26.
Key facts
- $350 HOA
- 2 garage spots
- Built 1971
Neighborhood map
What this means for you Summary
Snapshot
- This is a 3-bed/2.5-bath townhouse listed at $120k. Condition is rated fair.
Deal economics
- At list price, monthly cash flow is $411 ($5k/yr) — positive.
- The deal already cash-flows at list — no discount required.
- Meets the 1% rule at list price ($2k rent vs $120k).
- Recommended offer: $113k (6.0% below list) — sets the bar for market timing.
- Cap rate 10.4% vs local median 3.6% in Corpus Christi — top-decile yield for the area; either an underpriced asset or a hidden risk that comps aren't pricing in. Stress-test before assuming the spread holds.
Location & tenants
- Location reads 78/100 on livability (#66 in TX, #2,404 nationally) — a middle-class / working-renter tenant base. Strengths: commute A+, cost of living A+, housing A+; Watch: crime F.
- Corpus Christi ISD (urban): math 31% / reading 35% proficiency, ranked #562 of 826 in TX (top 68%) — families likely to look elsewhere, expect single-tenant / working-renter base with shorter leases; 63% free/reduced lunch — lower-income household profile, screen leases tightly.
- Zoned schools: Windsor Park G/T (math 85% / reading 90%, grade A+, #6 of 4,322 statewide, top 0%, 609 students, 29% FRL); Adkins Middle (math 40% / reading 39%, grade F, #660 of 1,662 statewide, top 41%, 956 students, 48% FRL); King H S (math 35% / reading 36%, grade F, #941 of 1,632 statewide, top 58%, 1,400 students, 63% FRL) — zoned schools average 47% FRL vs 63% district-wide (16 pts lower); this property's tenant base skews higher-income than the district average.
- Zoned-school proficiency averages 54% at this address vs 33% district-wide (+21 pts) — the actual schools serving this property are materially stronger than the Corpus Christi ISD average implies; a family-tenant draw the district grade alone would hide.
- Market conditions: Rents soft (-1.5%/yr); 212 active listings in the ZIP; 19 comparable units currently listed for rent nearby; rentals at typical pace (median 25d on market — plan ~3-4 weeks tenant-placement turnaround); 42% of comp listings sitting > 30 days — soft ceiling on asking rent; 1,397 units permitted in Nueces County in 2024 (47 in 5+ unit buildings).
- This rent runs 39% of the median local income ($61k/yr) — at the standard rent-burdened threshold; future hikes will face affordability resistance.
Forward outlook
- Local home prices are declining (-3.0%/yr); year-one equity from $829 of loan paydown is wiped out by about $4k of value loss. Plan a longer hold.
- Nueces County population projected at +36% by 2050 — long-run rental-demand tailwind backs the buy-and-hold thesis.
Negotiation context
- It's been on market 71 days — a 6% lower offer ($113k) is reasonable based on typical stale-listing flexibility.
Questions for the listing agent
- It's been on market 71 days. Have you received any prior offers? Is the seller open to a 6% concession, seller financing, or rate buy-down credit?
- Have any recent inspections been done? Can we get a copy of the seller's disclosures and any deferred-maintenance estimates?
- Built in 1971 — when were the roof, HVAC, electrical panel, plumbing, and water heater last replaced?
- What does the HOA fee cover, when was the last increase, and are there any pending special assessments or reserve-fund shortfalls?
- Why hasn't it sold? Are there any deal-killer items the seller is aware of (foundation, flood, title, zoning, code violations)?
- Is there a deadline driving the sale (1031 exchange, divorce, estate, relocation)? That informs how much negotiation room exists.
- Crime grade is F in this area — have there been break-ins, vandalism, or insurance claims at this property in the last 3 years? What carrier currently insures it and at what premium?
- What's the average days-on-market for RENTAL listings here right now (not sales)? A rising rental-DOM trend means longer vacancies and softer asking-rent achievability than the comps imply.
- What's the recent tenant-quality profile in this submarket — average credit score on applications, eviction rate, late-payment / NSF rate, and stable-employment percentage? A property-management company in the area should have these aggregated.
- How much new for-sale + rental construction is in the pipeline within 1–3 miles? Heavy new supply typically softens prices + rents 12–24 months out; constrained supply supports both.
Investment metrics
- 1% rule
- 1.68% ✓
- Cap rate
- 10.40%
- Cash-on-cash
- 14.67%
- DSCR
- 1.65
- GRM
- 5.0
CMA / ARV
- ARV (on-the-fly)
- $205,335
- Comps found
- 12
Show comp detail 12 sales within ~0.75 mi
| Address | Dist | Beds/Ba | Sqft | Sold | Price | $/sf | Match |
|---|---|---|---|---|---|---|---|
| 88 Townhouse #88 | 0.00mi | 3/2.5 | 1,755 (0%) | 1mo | $119,900 | $68 | 99 |
| 88 Townhouse Ln Unit L88 | 0.00mi | 3/2.5 | 1,755 (0%) | 1mo | $119,900 | $68 | 99 |
| 27 Townhouse | 0.08mi | 3/2.5 | 1,746 (-0%) | 11mo | $229,900 | $132 | 86 |
| 42 Townhouse | 0.03mi | 3/2.5 | 1,751 (-0%) | 15mo | $198,000 | $113 | 86 |
| 47 Townhouse | 0.02mi | 2/2.5 (-1) | 1,728 (-2%) | 7mo | $249,000 | $144 | 85 |
| 20 Townhouse | 0.03mi | 2/2.5 (-1) | 1,712 (-2%) | 8mo | $200,000 | $117 | 82 |
| 41 Townhouse | 0.03mi | 2/2.5 (-1) | 1,663 (-5%) | 3mo | $159,000 | $96 | 82 |
| 44 Rock Creek Dr #44 | 0.22mi | 2/2.5 (-1) | 1,614 (-8%) | 3mo | $230,000 | $143 | 69 |
| 73 Townhouse | 0.10mi | 3/2.5 | 2,015 (+15%) | 9mo | $244,000 | $121 | 63 |
| 22 Townhouse Ln | 0.06mi | 3/3.0 | 1,977 (+13%) | 15mo | $189,000 | $96 | 62 |
| 15 Rock Creek Dr | 0.17mi | 3/3.0 | 1,997 (+14%) | 8mo | $299,000 | $150 | 61 |
| 91 Townhouse Ln | 0.11mi | 2/2.0 (-1) | 1,496 (-15%) | 9mo | $149,000 | $100 | 56 |
Match score weights: distance 35% · size 25% · config 20% · recency 20%. Top-matched comps best support the ARV.
Projected returns pro-forma
-3.0% appreciation · 0.0% rent growth · sell at horizon
- IRR
- 0.9%
- Equity multiple
- 1.03×
- Total profit
- $1,068
- Equity at exit
- $17,877
- IRR
- 6.2%
- Equity multiple
- 1.38×
- Total profit
- $12,813
- Equity at exit
- $10,367
Cash invested: $33,572 (down + closing). Projections, not guarantees.
Landlord ↔ Tenant lean methodology
- Overall (STATE)
- 87 Strongly Landlord-Friendly
- State Texas
- 87 Strongly Landlord-Friendly · R+5
- County
- — inherits STATE
- City
- — inherits STATE
ZIP-level market 78412
- Rents YoY
- -1.5%
- Active inventory
- 212
- Price-to-rent
- 5.0×
Monthly cashflow live
- Estimated rent
- $2,012 high interval (Pro) →
- Mortgage (P&I)
- −$629
- Tax est. 1.5%
- −$150 /mo · $1,798/yr
- Insurance
- −$50
- HOA
- −$350
- Lot rent
- −$0
- Vacancy / Maint / Mgmt
- −$422
- Net cashflow
- $411
Break-even live
Sensitivity live
| Price | -10% $493 | -5% $452 | +0% $411 | +5% $369 | +10% $328 |
|---|---|---|---|---|---|
| Rent | -10% $252 | -5% $331 | +0% $411 | +5% $490 | +10% $569 |
| Rate | -1.0pp $471 | -0.5pp $441 | base $411 | +0.5pp $379 | +1.0pp $348 |
UW: 25.0% down · 7.5% · 30yr · 1.5% tax · 5.0% vac · 8.0% maint · 8.0% mgmt
Financing live
Cash to close
- Down payment
- $29,975
- Closing costs
- $3,597
- Reserves months
- —
- Total cash needed
- —
Loan-product check · same deal, 3 products live
Conventional
25% down · 7.5% · 30yr
- Down + closing
- —
- Monthly P&I
- —
- Monthly cashflow
- —
- DSCR
- —
- Eligible?
- —
Personal DTI + credit; lowest rate.
DSCR
20% down · 8.5% · 30yr
- Down + closing
- —
- Monthly P&I
- —
- Monthly cashflow
- —
- DSCR
- —
- Eligible?
- —
No personal income docs; deal must DSCR.
Hard money
10% down · 12.0% · 12mo
- Down + closing
- —
- Monthly P&I
- —
- Monthly cashflow
- —
- DSCR
- —
- Eligible?
- —
Short-term bridge; refi at stabilization.
Rent comps 19 comps
| Address | Beds | Baths | Sqft | Rent | $/sqft | DOM | Units | Dist |
|---|---|---|---|---|---|---|---|---|
| 16 Rock Creek Dr Corpus Christi, TX | 3.0 | 2.5 | 2450 | $1,950 | $0.80 | 24d | 1 | 0.14mi |
| 16 Rock Creek Dr #16 Corpus Christi, TX | 3.0 | 3.0 | 2450 | $1,955 | $0.80 | 24d | 1 | 0.14mi |
| 1701 Ennis Joslin Rd Corpus Christi, TX | 1.0–3.0 | 1.0–2.0 | 1035 | $2,259 | $2.18 | 17d | 25 | 0.42mi |
| 1514 Ennis Joslin Rd Corpus Christi, TX | 1.0–3.0 | 1.0–2.0 | 1164 | $2,285 | $1.96 | 17d | 1 | 0.48mi |
| 1802 Ennis Joslin Rd Corpus Christi, TX | 1.0–3.0 | 1.0–2.0 | 1030 | $1,962 | $1.90 | 17d | 36 | 0.80mi |
| 6845 Rhine Dr Corpus Christi, TX | 3.0 | 1.5 | 1518 | $1,695 | $1.12 | 47d | 1 | 0.86mi |
| 6629 Rhine Dr Unit A Corpus Christi, TX | 3.0 | 2.0 | 1350 | $1,695 | $1.26 | 17d | 1 | 0.98mi |
| 7430 Cessna Dr Corpus Christi, TX | 3.0 | 2.0 | 1370 | $2,000 | $1.46 | 47d | 1 | 1.00mi |
| 6433 Aspenwood Dr Corpus Christi, TX | 3.0 | 2.0 | 1465 | $1,750 | $1.19 | 47d | 1 | 1.04mi |
| 6530 Ample Arbor Ct Corpus Christi, TX | 3.0 | 2.5 | 2256 | $2,400 | $1.06 | 47d | 1 | 1.12mi |
| 7454 Seal Beach Ct Corpus Christi, TX | 3.0 | 2.0 | 1571 | $2,250 | $1.43 | 17d | 1 | 1.14mi |
| 7454 Seal Beach Ct Corpus Christi, TX | 3.0 | 2.0 | 1571 | $2,250 | $1.43 | 24d | 1 | 1.14mi |
| 7610 Quartz Dr Corpus Christi, TX | 3.0 | 2.0 | 1538 | $2,195 | $1.43 | 47d | 1 | 1.24mi |
| 2221 Crystal Bay Dr Corpus Christi, TX | 4.0 | 2.0 | 1705 | $2,200 | $1.29 | 17d | 1 | 1.28mi |
| 2001 Woodbend Dr Corpus Christi, TX | 2.0–3.0 | 2.0 | 1267 | $2,204 | $1.74 | 17d | 17 | 1.31mi |
| 7617 Diamond Dr Corpus Christi, TX | 4.0 | 3.0 | 2312 | $2,795 | $1.21 | 17d | 1 | 1.34mi |
| 7325 Clapton Dr Corpus Christi, TX | 4.0 | 3.0 | 1900 | $2,900 | $1.53 | 47d | 1 | 1.42mi |
| 6617 Meadowbreeze Pkwy Corpus Christi, TX | 3.0 | 2.0 | 1284 | $1,800 | $1.40 | 47d | 1 | 1.43mi |
| 6606 Riding Wind Dr Corpus Christi, TX | 3.0 | 2.0 | 1325 | $1,950 | $1.47 | 47d | 1 | 1.49mi |
HOA detail
- Monthly dues
- $350 · $4,200/yr
Listing history 6 events
-
2026-04-17status Pending
-
2026-03-20price $119,900
-
2026-03-16price $124,900
-
2026-03-06price $129,900
-
2026-02-11price $139,900
-
2026-02-05$149,900 Active
ⓘ Source: listings_history table (triggers on properties + properties_extension) + one-shot
backfill from property_details.listing_events for pre-trigger history.
Nearby sold comps map
Loading sold comps map…
Walkable amenities ~0.75 mi
Loading nearby amenities…
Taxation est. · year 1
- Rental income
- $24,139
- − Mortgage interest
- −$6,716
- − Property taxes
- −$1,798
- − Insurance
- −$600
- − Repairs & maintenance
- −$1,931
- − Management
- −$1,931
- − HOA
- −$4,200
- − Depreciation
- −$3,488
- Taxable income
- $3,474
- Est. tax owed @ 24.0%
- −$834
- After-tax cash flow
- $4,092/yr
For passive investors: Depreciation is non-cash, so a rental often shows a tax loss while cash-flowing — sheltering income. Rental losses are passive: they offset passive income freely, and up to $25,000/yr can offset ordinary (W-2) income if you actively participate and your MAGI is under $100k (phasing out to $0 by $150k); unused losses carry forward. On sale, claimed depreciation is recaptured at up to 25%, and gains may owe capital-gains tax (a 1031 exchange can defer both). Figures are a year-1 estimate at your 24.0% rate — not tax advice; consult a CPA.
Condition & rehab AI · 14 photos
This townhouse requires moderate renovations, focusing on updating the kitchen and bathrooms, and improving the landscaping to increase its resale and rental value.
Repairs flagged
- Major Kitchen cabinets — Older cabinets and dated countertops need replacement.
- Major Bathroom fixtures — Older fixtures and dated tile need updating.
- Major Landscaping — Sparse landscaping and a lack of curb appeal need improvement.
Value-add opportunities
- Resale New kitchen cabinets and countertops — Modernizing the kitchen will attract more buyers.
- Resale New bathroom fixtures and tile — Updating the bathrooms will improve the home's appeal.
- Both Landscaping improvements — Enhancing the landscaping will increase curb appeal and attract more renters.
Renovation cost estimate screening
| Repair item | Severity | Est. cost |
|---|---|---|
| Kitchen cabinets · Older cabinets and dated countertops need replacement. | Major | $15,000–50,000 |
| Bathroom fixtures · Older fixtures and dated tile need updating. | Major | $15,000–50,000 |
| Landscaping · Sparse landscaping and a lack of curb appeal need improvement. | Major | $15,000–50,000 |
| Total estimated repair cost · 3 items | $45,000–150,000 |
Value-add ROI direction
- Resale New kitchen cabinets and countertops — Modernizing the kitchen will attract more buyers. ↑
- Resale New bathroom fixtures and tile — Updating the bathrooms will improve the home's appeal. ↑
- Both Landscaping improvements — Enhancing the landscaping will increase curb appeal and attract more renters. ↑
ⓘ Cost ranges are severity-bucket heuristics (US national rule-of-thumb). Get contractor quotes + a written scope before underwriting a rehab budget.
Schools (NCES district)
- District
- Corpus Christi ISD
- NCES district ID
- 4815270
- Math proficiency
- 31% ▼ -18.00%
- Reading proficiency
- 35% ▼ -7.00%
- Median HH income
- $45,672
- Composite
- 28.27/100
- National rank
- #6793
- State rank
- #562 of 826 in TX
Livability — Corpus Christi
- Score
- 78/100
- State rank
- #66
- US rank
- #2404
Category grades
Schools grade is shown separately in the Schools card above.
Census & demographics
- Census place
- Corpus Christi, TX
- County
- Nueces County · 296,836 people
- City population
- 296,836
- Metro
- Corpus Christi, TX
- Population (ZIP)
- 38,631
- Household income
- $61,215
- Rent vs Own
- Severe rent burden
- 1932.0
Population outlook (Nueces County) Hauer SSP2
- Today (2025)
- 418,037 people
- By 2030
- 447,123 · +7.0%
- By 2040
- 505,911 · +21.0%
- By 2050
- 567,522 · +35.8%
- By 2075
- 729,686 · +74.6%
- By 2100
- 847,087 · +102.6%
Race, ethnicity, and origin ACS 2023
- Neighborhood character
- Diverse neighborhood (Simpson 0.56)
- Race & ethnicity
- Hispanic / Latino 57% White 34% Two or more races 29% Asian 4% Black 3%
- Hispanic origin (detail)
- Mexican 52%
- Common ancestry
- Slovak 2% Romanian 1% Lithuanian 1%
- Foreign-born
- 8% · Canada, China, Vietnam
- Languages at home
- 74% English-only · Spanish 22% Other Indo-European 1% Vietnamese 1%
Political lean MEDSL · Nueces
- 2024 margin
- R (+11.5) · D 43.8% · R 55.3%
- 2008→2024 swing
- -7.1pp toward R · 2008: -4.4pp · 2024: -11.5pp
- All cycles
- 2024: R+11.5 2020: R+2.9 2016: R+1.5 2012: R+3.2 2008: R+4.4
Not yet ingested
- Civics
- —
Market trends
- HPI YoY
- ▼ -255.29%
- Current HPI
- 177.36
- Rent YoY
- ▼ -1.53%
- Metro
- Corpus Christi, TX
- State GDP YoY
- ▲ 3.95%
- F500 in state
- 110
Industry mix (Fortune 500 HQ in TX)
| Industry | F500 HQs | Revenue |
|---|---|---|
| Energy | 16 | $1,198B |
|
||
| Technology | 5 | $198B |
|
||
| Engineering / Construction | 4 | $72B |
|
||
| Energy Services | 3 | $60B |
|
||
| Utilities | 3 | $41B |
|
||
| Healthcare | 2 | $330B |
|
||
Price history
-20.0% since first listed6 events — show timeline
- 2026-04-17 Pending — CBMLS
- 2026-03-20 Price Changed $119,900 CBMLS
- 2026-03-16 Price Changed $124,900 CBMLS
- 2026-03-06 Price Changed $129,900 CBMLS
- 2026-02-11 Price Changed $139,900 CBMLS
- 2026-02-05 Listed $149,900 CBMLS
Cash-flow waterfall
monthlySold comps — $/sqft
last 12 mo · ≤1 miLoading sold comps…