 🏗️ New Construction
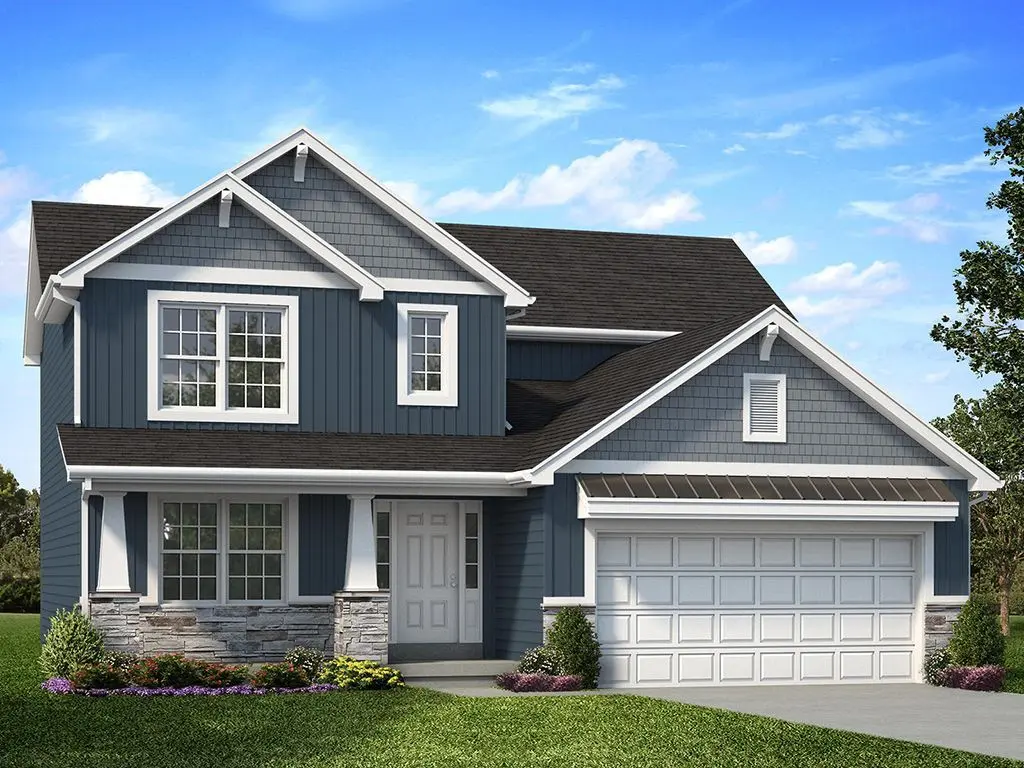
Royal II Plan · Wentzville, MO
Flood risk 1/10 · Minimal
- FEMA flood zone
- X (unshaded)
- Chance of flooding over 30 yrs
- 0.0%
- Est. flood insurance / yr
- $507 – $1,088
Fire risk 1/10 · Minimal
- Est. fire insurance / yr
- $1,054 – $1,958
Heat risk 4/10 · Minor
- Hot days now (above 108°F)
- 7 days/yr
- Hot days in 30 yrs
- 20 days/yr
Wind risk 2/10 · Minimal
- Chance of severe wind over 30 yrs
- 1.0%
Air-quality risk 1/10 · Minimal
- Unhealthy air days now
- 0 days/yr
- Unhealthy air days in 30 yrs
- 0 days/yr
Risk factors via First Street. Map © Google.
Why this score? — see what drove the F grade
The composite is a weighted blend of 9 inputs, each scored 0–100. Each bar is that input's sub-score; the figure is the points it added to the 100-point composite (weight × sub-score).
- ARV discount +7.5/15.0
- Cash flow +6.5/30.0
- Schools +4.3/10.0
- Livability +4.0/5.0
- Rent growth +3.5/5.0
- Condition / age +2.5/5.0
- 1% rule +1.6/10.0
- DSCR +0.8/10.0
- Appreciation +0.0/10.0
$327,900
🖨 Deal sheet (PDF) 📄 Offer letter ✓ Due diligence
Listing remarks MLS
This flexible two story home features 4 bedrooms and 2.5 baths with 7 different exterior elevation choices. The main floor is great for entertaining, with a kitchen that opens to the breakfast room and family room, plus a formal living room/dining room for additional space. Second floor features the master suite with private bath and 3 secondary bedrooms with hall bath. Additional choices include luxury kitchen floorplan, bay windows or window wall, fireplace, and luxury master bath.
Key facts
- Luxury master bath
- Formal living room
- Bay windows
Tags
Neighborhood map
What this means for you Summary
Snapshot
- This is a 4-bed/2.5-bath single-family listed at $328k.
Deal economics
- At list price, monthly cash flow is $-650 ($-8k/yr) — negative.
- To cash-flow at today's rent, offer at most $292k (11.0% below list).
- To meet the 1% rule (rent ≥ 1% of price), the offer needs to be $255k (22.2% below list).
- Recommended offer: $255k (22.2% below list) — sets the bar for 1% rule.
- Cap rate 4.3% vs local median 3.4% in Wentzville — meaningfully above typical; check what's discounted (condition, days-on-market, listing class) to confirm the premium yield is real.
Location & tenants
- Location reads 81/100 on livability (#14 in MO, #1,402 nationally) — a professional / high-income tenant draw. Strengths: crime A+, employment A+, housing A+; Watch: commute F.
- Wentzville R-IV (suburban): math 44% / reading 52% proficiency, ranked #32 of 324 in MO (top 10%) — families likely to look elsewhere, expect single-tenant / working-renter base with shorter leases; only 18% free/reduced lunch — higher-income household profile.
- Zoned schools: Peine Ridge Elem. (math 38% / reading 40%, grade F, #592 of 1,115 statewide, top 54%, 531 students, 20% FRL); Wentzville Middle (math 40% / reading 42%, grade F, #172 of 391 statewide, top 46%, 794 students, 19% FRL); Emil E. Holt Sr. High (math 48% / reading 58%, grade C-, #88 of 521 statewide, top 17%, 1,273 students, 12% FRL) — zoned schools at 17% FRL track the district average.
- Market conditions: Rents rising (+4.0%/yr); 700 active listings in the ZIP; 9 comparable units currently listed for rent nearby; rentals at typical pace (median 18d on market — plan ~3-4 weeks tenant-placement turnaround); high-income renter base; 2,021 units permitted in St. Charles County in 2024 (568 in 5+ unit buildings).
Forward outlook
- Local home prices are declining (-3.0%/yr); year-one equity from $3k of loan paydown is wiped out by about $12k of value loss. Plan a longer hold.
- St. Charles County population projected at +22% by 2050 — long-run rental-demand tailwind backs the buy-and-hold thesis.
Negotiation context
- It's been on market 156 days — a 12% lower offer ($289k) is reasonable based on typical stale-listing flexibility.
Questions for the listing agent
- What do current leases actually rent for vs. the listed asking? Can we see a recent rent roll and the last 12 months of T-12 income?
- It's been on market 156 days. Have you received any prior offers? Is the seller open to a 22% concession, seller financing, or rate buy-down credit?
- Why hasn't it sold? Are there any deal-killer items the seller is aware of (foundation, flood, title, zoning, code violations)?
- Is there a deadline driving the sale (1031 exchange, divorce, estate, relocation)? That informs how much negotiation room exists.
- Schools are B-rated — typically a magnet for longer-tenancy family renters. What's the average tenant stay here, and is there a school-zone premium baked into asking?
- The area grade is low — what's the realistic commute time and amenity access for the typical tenant pool here? Any planned neighborhood developments (good or bad) we should know about?
- What's the average days-on-market for RENTAL listings here right now (not sales)? A rising rental-DOM trend means longer vacancies and softer asking-rent achievability than the comps imply.
- What's the recent tenant-quality profile in this submarket — average credit score on applications, eviction rate, late-payment / NSF rate, and stable-employment percentage? A property-management company in the area should have these aggregated.
- How much new for-sale + rental construction is in the pipeline within 1–3 miles? Heavy new supply typically softens prices + rents 12–24 months out; constrained supply supports both.
Investment metrics
- 1% rule
- 0.66% ✗
- Cap rate
- 4.27%
- Cash-on-cash
- -7.22%
- DSCR
- 0.68
- GRM
- 12.6
CMA / ARV
- ARV (median comp)
- $385,714
- List price
- $327,900
- Delta
- -14.99%
- Verdict
- UNDERPRICED
- Comps
- 20 within 1.0 mi
Show comp detail 12 sales within ~0.75 mi
| Address | Dist | Beds/Ba | Sqft | Sold | Price | $/sf | Match |
|---|---|---|---|---|---|---|---|
| 316 Creek Sound Ct | 0.13mi | 4/2.5 | 1,890 (-6%) | 7mo | $372,000 | $197 | 79 |
| 113 Katie Lynn Ct | 0.30mi | 3/3.0 (-1) | 1,952 (-2%) | 3mo | $340,000 | $174 | 73 |
| 1032 Westhaven Blvd | 0.43mi | 4/2.5 | 2,081 (+4%) | 2mo | $392,973 | $189 | 72 |
| 4702 Providence Woods Cir | 0.37mi | 4/2.5 | 2,080 (+4%) | 7mo | $375,000 | $180 | 70 |
| 225 Schroeder Grove Dr | 0.41mi | 3/2.5 (-1) | 2,068 (+3%) | 7mo | $389,900 | $189 | 64 |
| 1062 Westhaven Blvd | 0.57mi | 4/2.5 | 1,902 (-5%) | 6mo | $379,900 | $200 | 61 |
| 518 Westhaven Manor Dr | 0.58mi | 4/2.5 | 1,902 (-5%) | 6mo | $379,900 | $200 | 60 |
| 212 Westhaven Circle Dr | 0.30mi | 3/2.5 (-1) | 1,728 (-14%) | 6mo | $359,900 | $208 | 54 |
| 1033 Westhaven Blvd | 0.45mi | 3/2.5 (-1) | 1,728 (-14%) | 1mo | $364,900 | $211 | 50 |
| 347 Heather Mill Dr | 0.47mi | 3/2.5 (-1) | 1,728 (-14%) | 6mo | $349,900 | $202 | 45 |
| 1916 Providence Estate Dr | 0.59mi | 3/2.0 (-1) | 1,703 (-15%) | 4mo | $368,999 | $217 | 37 |
| 2053 Lick Creek Dr | 0.71mi | 3/3.0 (-1) | 1,733 (-13%) | 8mo | $384,500 | $222 | 32 |
Match score weights: distance 35% · size 25% · config 20% · recency 20%. Top-matched comps best support the ARV.
Projected returns pro-forma
-3.0% appreciation · 3.96% rent growth · sell at horizon
- IRR
- -27.8%
- Equity multiple
- 0.06×
- Total profit
- $-101,362
- Equity at exit
- $57,511
- IRR
- -23.1%
- Equity multiple
- -0.21×
- Total profit
- $-130,987
- Equity at exit
- $33,350
Cash invested: $108,000 (down + closing). Projections, not guarantees.
Landlord ↔ Tenant lean methodology
- Overall (STATE)
- 81 Strongly Landlord-Friendly
- State Missouri
- 81 Strongly Landlord-Friendly · R+10
- County
- — inherits STATE
- City
- — inherits STATE
ZIP-level market 63385
- Home prices YoY
- -31.2%
- Rents YoY
- 4.0%
- Active inventory
- 700
- Price-to-rent
- 10.7×
Monthly cashflow live
- Estimated rent
- $2,552 high interval (Pro) →
- Mortgage (P&I)
- −$2,023
- Tax est. 1.5%
- −$482 /mo · $5,786/yr
- Insurance
- −$161
- HOA
- −$0
- Vacancy / Maint / Mgmt
- −$536
- Net cashflow
- $-650
Break-even live
Sensitivity live
| Price | -10% $-383 | -5% $-517 | +0% $-650 | +5% $-783 | +10% $-916 |
|---|---|---|---|---|---|
| Rent | -10% $-851 | -5% $-751 | +0% $-650 | +5% $-549 | +10% $-448 |
| Rate | -1.0pp $-456 | -0.5pp $-552 | base $-650 | +0.5pp $-750 | +1.0pp $-851 |
UW: 25.0% down · 7.5% · 30yr · 1.5% tax · 5.0% vac · 8.0% maint · 8.0% mgmt
Financing live
Cash to close
- Down payment
- $96,429
- Closing costs
- $11,571
- Reserves months
- —
- Total cash needed
- —
Loan-product check · same deal, 3 products live
Conventional
25% down · 7.5% · 30yr
- Down + closing
- —
- Monthly P&I
- —
- Monthly cashflow
- —
- DSCR
- —
- Eligible?
- —
Personal DTI + credit; lowest rate.
DSCR
20% down · 8.5% · 30yr
- Down + closing
- —
- Monthly P&I
- —
- Monthly cashflow
- —
- DSCR
- —
- Eligible?
- —
No personal income docs; deal must DSCR.
Hard money
10% down · 12.0% · 12mo
- Down + closing
- —
- Monthly P&I
- —
- Monthly cashflow
- —
- DSCR
- —
- Eligible?
- —
Short-term bridge; refi at stabilization.
Rent comps 9 comps
| Address | Beds | Baths | Sqft | Rent | $/sqft | DOM | Units | Dist |
|---|---|---|---|---|---|---|---|---|
| 314 Heather Mill Dr Wentzville, MO | 3.0 | 2.0 | 1525 | $2,576 | $1.69 | 9d | 1 | 0.32mi |
| 539 Great Oaks Meadow Dr Wentzville, MO | 3.0 | 2.5 | 1894 | $2,479 | $1.31 | 0d | 1 | 0.88mi |
| 443 Sweetgrass Dr Wentzville, MO | 3.0 | 2.0 | 1522 | $2,800 | $1.84 | 25d | 1 | 1.00mi |
| 714 Switchgrass Dr Wentzville, MO | 4.0 | 2.5 | 1912 | $2,875 | $1.50 | 45d | 1 | 1.02mi |
| 422 Sweetgrass Dr Wentzville, MO | 3.0 | 2.5 | 1900 | $2,900 | $1.53 | 0d | 1 | 1.05mi |
| 5542 Autumn Trace Pkwy Wentzville, MO | 3.0 | 2.0 | 1440 | $2,400 | $1.67 | 19d | 1 | 1.06mi |
| 310 Rustic Oaks Dr Wentzville, MO | 3.0 | 2.0 | 1753 | $2,271 | $1.30 | 25d | 1 | 1.08mi |
| 931 Mule Creek Dr Wentzville, MO | 3.0 | 2.5 | 2211 | $2,200 | $1.00 | 18d | 1 | 1.17mi |
| 1503 Jordan Lee Ct Wentzville, MO | 3.0 | 2.5 | 1400 | $2,196 | $1.57 | 13d | 1 | 1.24mi |
Listing history 18 events
-
2026-06-21days on market $327,900 Active 156 DOM
-
2026-06-18days on market $327,900 Active 153 DOM
-
2026-06-17days on market $327,900 Active 152 DOM
-
2026-06-16days on market $327,900 Active 151 DOM
-
2026-06-15days on market $327,900 Active 150 DOM
-
2026-06-13days on market $327,900 Active 148 DOM
-
2026-06-13days on market $327,900 Active 147 DOM
-
2026-06-09days on market $327,900 Active 144 DOM
-
2026-06-08days on market $327,900 Active 143 DOM
-
2026-06-08days on market $327,900 Active 142 DOM
-
2026-06-05days on market $327,900 Active 139 DOM
-
2026-06-03days on market $327,900 Active 138 DOM
-
2026-06-02days on market $327,900 Active 137 DOM
-
2026-06-01days on market $327,900 Active 136 DOM
-
2026-05-31days on market $327,900 Active 135 DOM
-
2026-04-01price $327,900 488-char remark
Show marketing remark (488 chars)
This flexible two story home features 4 bedrooms and 2.5 baths with 7 different exterior elevation choices. The main floor is great for entertaining, with a kitchen that opens to the breakfast room and family room, plus a formal living room/dining room for additional space. Second floor features the master suite with private bath and 3 secondary bedrooms with hall bath. Additional choices include luxury kitchen floorplan, bay windows or window wall, fireplace, and luxury master bath.
-
2026-03-01price $325,900 488-char remark
Show marketing remark (488 chars)
This flexible two story home features 4 bedrooms and 2.5 baths with 7 different exterior elevation choices. The main floor is great for entertaining, with a kitchen that opens to the breakfast room and family room, plus a formal living room/dining room for additional space. Second floor features the master suite with private bath and 3 secondary bedrooms with hall bath. Additional choices include luxury kitchen floorplan, bay windows or window wall, fireplace, and luxury master bath.
-
2026-01-16$322,900 Active 488-char remark
Show marketing remark (488 chars)
This flexible two story home features 4 bedrooms and 2.5 baths with 7 different exterior elevation choices. The main floor is great for entertaining, with a kitchen that opens to the breakfast room and family room, plus a formal living room/dining room for additional space. Second floor features the master suite with private bath and 3 secondary bedrooms with hall bath. Additional choices include luxury kitchen floorplan, bay windows or window wall, fireplace, and luxury master bath.
ⓘ Source: listings_history table (triggers on properties + properties_extension) + one-shot
backfill from property_details.listing_events for pre-trigger history.
Climate risk First Street
- Flood 1/10 Low FEMA zone X (unshaded) · 0% chance over 30 yrs
- Wildfire 1/10 Low
- Heat 4/10 Moderate 7 d/yr ≥108°F today · 20 d/yr by 30 yrs out
- Wind 2/10 Low 100% chance of damaging wind over 30 yrs
- Air quality 1/10 Low 0 unhealthy d/yr today · 0 by 30 yrs out
Nearby sold comps map
Loading sold comps map…
Walkable amenities ~0.75 mi
Loading nearby amenities…
Taxation est. · year 1
- Rental income
- $30,620
- − Mortgage interest
- −$21,606
- − Property taxes
- −$5,786
- − Insurance
- −$1,929
- − Repairs & maintenance
- −$2,450
- − Management
- −$2,450
- − Depreciation
- −$11,221
- Taxable loss
- −$14,821
- Est. tax savings @ 24.0%
- +$3,557
- After-tax cash flow
- $-4,241/yr
For passive investors: Depreciation is non-cash, so a rental often shows a tax loss while cash-flowing — sheltering income. Rental losses are passive: they offset passive income freely, and up to $25,000/yr can offset ordinary (W-2) income if you actively participate and your MAGI is under $100k (phasing out to $0 by $150k); unused losses carry forward. On sale, claimed depreciation is recaptured at up to 25%, and gains may owe capital-gains tax (a 1031 exchange can defer both). Figures are a year-1 estimate at your 24.0% rate — not tax advice; consult a CPA.
Schools (NCES district)
- District
- Wentzville R-IV
- NCES district ID
- 2931650
- Math proficiency
- 44% ▼ -9.00%
- Reading proficiency
- 52% ▼ -7.00%
- Median HH income
- $74,961
- Composite
- 43.49/100
- National rank
- #2994
- State rank
- #32 of 324 in MO
Livability — Wentzville
- Score
- 81/100
- State rank
- #14
- US rank
- #1402
Category grades
Schools grade is shown separately in the Schools card above.
Census & demographics
- Census place
- Wentzville, MO
- County
- Saint Charles County · 399,703 people
- City population
- 51,330
- Metro
- St. Louis, MO-IL
- Population (ZIP)
- 51,330
- Household income
- $112,199
- Rent vs Own
- Severe rent burden
- 662.0
Population outlook (St. Charles County) Hauer SSP2
- Today (2025)
- 437,857 people
- By 2030
- 461,707 · +5.4%
- By 2040
- 503,222 · +14.9%
- By 2050
- 534,684 · +22.1%
- By 2075
- 597,047 · +36.4%
- By 2100
- 609,682 · +39.2%
Race, ethnicity, and origin ACS 2023
- Neighborhood character
- Predominantly White (86%)
- Race & ethnicity
- White 86% Black 5% Two or more races 5% Hispanic / Latino 3% Asian 2%
- Common ancestry
- Lithuanian 3% Romanian 3% Italian 2%
- Foreign-born
- 2% · Canada, China
- Languages at home
- 97% English-only · Spanish 2%
Political lean MEDSL · St. Charles
- 2024 margin
- R (+17.0) · D 40.8% · R 57.8% · Other 1.4%
- 2008→2024 swing
- -7.2pp toward R · 2008: -9.7pp · 2024: -17.0pp
- All cycles
- 2024: R+17.0 2020: R+17.5 2016: R+26.4 2012: R+21.0 2008: R+9.7
Not yet ingested
- Civics
- —
Market trends
- HPI YoY
- ▼ -97.98%
- Current HPI
- 216.4917
- Rent YoY
- ▲ 3.96%
- Metro
- St. Louis, MO-IL
- State GDP YoY
- ▲ 1.84%
- F500 in state
- 20
Industry mix (Fortune 500 HQ in MO)
| Industry | F500 HQs | Revenue |
|---|---|---|
| Healthcare | 1 | $163B |
|
||
| Insurance | 1 | $21B |
|
||
| Industrial Technology | 1 | $17B |
|
||
| Retail | 1 | $16B |
|
||
| Industrial Distribution | 1 | $10B |
|
||
| Utilities | 1 | $9B |
|
||
Price history
+1.5% since first listed3 events — show timeline
- 2026-04-01 Price Changed $327,900 Zillow
- 2026-03-01 Price Changed $325,900 Zillow
- 2026-01-16 Listed $322,900 Zillow
Cash-flow waterfall
monthlySold comps — $/sqft
last 12 mo · ≤1 miLoading sold comps…