38828 Chaparrosa Way · Palm Desert, CA
Flood risk 1/10 · Minimal
- FEMA flood zone
- X (unshaded)
- Chance of flooding over 30 yrs
- 0.0%
- Est. flood insurance / yr
- $507 – $1,088
Fire risk 1/10 · Minimal
- Est. fire insurance / yr
- $659 – $1,223
Heat risk 9/10 · Severe
- Hot days now (above 114°F)
- 6 days/yr
- Hot days in 30 yrs
- 17 days/yr
Wind risk 1/10 · Minimal
- Chance of severe wind over 30 yrs
- —
Air-quality risk 4/10 · Minor
- Unhealthy air days now
- 5 days/yr
- Unhealthy air days in 30 yrs
- 7 days/yr
Risk factors via First Street. Map © Google.
Why this score? — see what drove the D grade
The composite is a weighted blend of 9 inputs, each scored 0–100. Each bar is that input's sub-score; the figure is the points it added to the 100-point composite (weight × sub-score).
- Cash flow +15.2/30.0
- ARV discount +7.5/15.0
- 1% rule +4.7/10.0
- DSCR +4.7/10.0
- Schools +3.8/10.0
- Rent growth +2.9/5.0
- Livability +2.6/5.0
- Condition / age +2.5/5.0
- Appreciation +0.0/10.0
$335,000
🖨 Deal sheet (PDF) 📄 Offer letter ✓ Due diligence
Listing remarks MLS
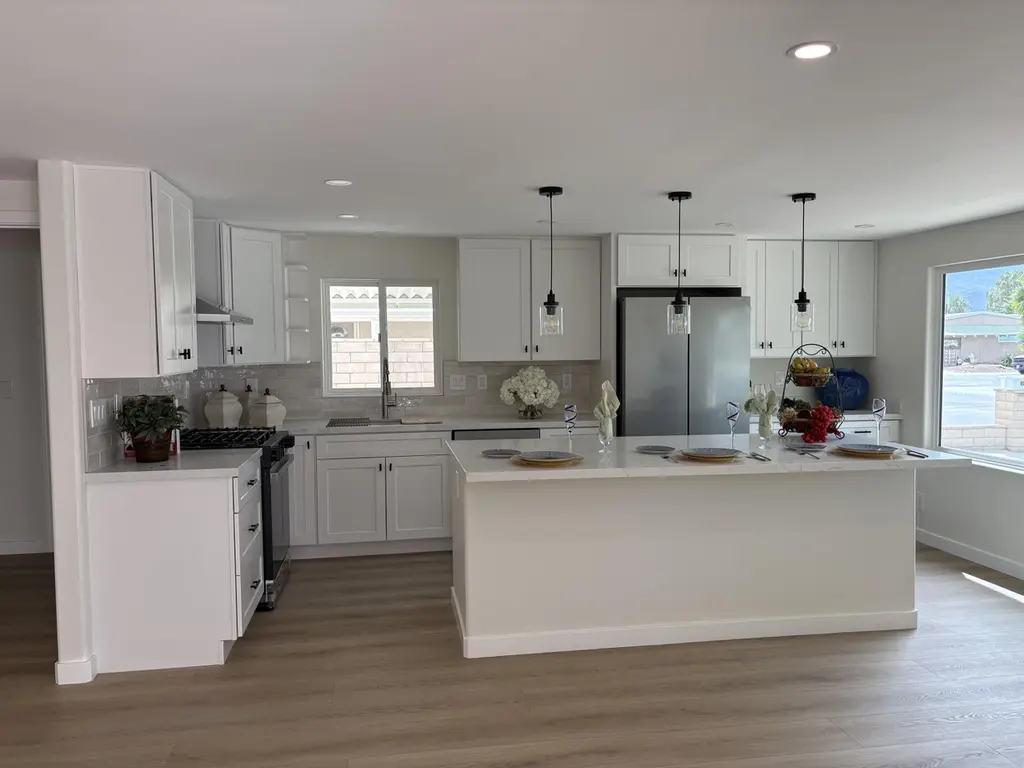
This beautifully updated home is just waiting for your personal touches. With an open floorplan, you will be able to entertain your family and friends with ease. The kitchen features granit counters, recessed lighting throughout the home, and a beautiful island. There is plenty of open space from the kitchen and family/living room. This home is offering you the opportunity to decorate and bring your own touches to this blank canvas. Come enjoy the country club lifestyle in the coveted Palm Desert Greens. Included in our low HOA dues, golf on our well manicured golf course, trash pickup, Spectrum WI-FI and TV. In addition, there are numerous clubs for you to participate in. BINGO is hosted on Friday nights here in the clubhouse. Whether you are looking for a quiet afternoon or social hour here with friends, Palm Desert Greens has it all. Come see this beautiful home today.
Key facts
- Beautiful island
- Open floorplan
- Recessed lighting
Tags
Neighborhood map
What this means for you Summary
Snapshot
- This is a 2-bed/2.0-bath manufactured listed at $335k.
Deal economics
- At list price, monthly cash flow is $117 ($1k/yr) — positive.
- The deal already cash-flows at list — no discount required.
- To meet the 1% rule (rent ≥ 1% of price), the offer needs to be $325k (2.9% below list).
- Recommended offer: $315k (6.0% below list) — sets the bar for market timing.
- Cap rate 6.7% vs local median 3.4% in Palm Desert — top-decile yield for the area; either an underpriced asset or a hidden risk that comps aren't pricing in. Stress-test before assuming the spread holds.
Location & tenants
- Location reads 51/100 on livability (#1,050 in CA) — a working-class tenant base; expect higher turnover. Strengths: employment B+, housing B; Watch: crime D, amenities F, commute F.
- Desert Sands Unified (suburban): math 31% / reading 56% proficiency, ranked #199 of 517 in CA (top 38%) — families likely to look elsewhere, expect single-tenant / working-renter base with shorter leases.
- Zoned schools: James Earl Carter Elementary (516 students, 53% FRL); Colonel Mitchell Paige Middle (math 10% / reading 10%, grade F, #474 of 498 statewide, top 99%, 436 students, 74% FRL); Palm Desert High (math 42% / reading 67%, grade C-, #256 of 1,170 statewide, top 24%, 2,050 students, 57% FRL).
- Market conditions: Rents rising (+1.6%/yr); 551 active listings in the ZIP; 7 comparable units currently listed for rent nearby; rentals lingering (median 46d on market — plan ~5-8 weeks vacancy on turnover, expect pricing pressure); 71% of comp listings sitting > 30 days — soft ceiling on asking rent; 9,195 units permitted in Riverside County in 2024 (1,512 in 5+ unit buildings).
- At $3,253/mo this rent would consume 56% of the median local household income ($70k/yr) (locally 1734% of renters already pay >50% of income on rent) — very limited rent-growth headroom before tenants either downsize or default.
Forward outlook
- Local home prices are declining (-3.0%/yr); year-one equity from $2k of loan paydown is wiped out by about $10k of value loss. Plan a longer hold.
- Riverside County population projected at +22% by 2050 — long-run rental-demand tailwind backs the buy-and-hold thesis.
Negotiation context
- It's been on market 83 days — a 6% lower offer ($315k) is reasonable based on typical stale-listing flexibility.
- 2 sale attempts since 28y ago with the ask held roughly flat each time — persistent listings suggest the price (not the market) is what's stuck; bring a comps-based counter.
Risks & watch-outs
- Climate carrying-cost: extreme-heat days projected 6→17/yr by 2055 (HVAC capex compounding) — expect insurance premiums to compound above CPI over the hold.
Questions for the listing agent
- It's been on market 83 days. Have you received any prior offers? Is the seller open to a 6% concession, seller financing, or rate buy-down credit?
- Built in 1972 — when were the roof, HVAC, electrical panel, plumbing, and water heater last replaced?
- What does the HOA fee cover, when was the last increase, and are there any pending special assessments or reserve-fund shortfalls?
- Why hasn't it sold? Are there any deal-killer items the seller is aware of (foundation, flood, title, zoning, code violations)?
- Is there a deadline driving the sale (1031 exchange, divorce, estate, relocation)? That informs how much negotiation room exists.
- Schools are A-rated — typically a magnet for longer-tenancy family renters. What's the average tenant stay here, and is there a school-zone premium baked into asking?
- Crime grade is D in this area — have there been break-ins, vandalism, or insurance claims at this property in the last 3 years? What carrier currently insures it and at what premium?
- The area grade is low — what's the realistic commute time and amenity access for the typical tenant pool here? Any planned neighborhood developments (good or bad) we should know about?
- What's the average days-on-market for RENTAL listings here right now (not sales)? A rising rental-DOM trend means longer vacancies and softer asking-rent achievability than the comps imply.
- What's the recent tenant-quality profile in this submarket — average credit score on applications, eviction rate, late-payment / NSF rate, and stable-employment percentage? A property-management company in the area should have these aggregated.
- How much new for-sale + rental construction is in the pipeline within 1–3 miles? Heavy new supply typically softens prices + rents 12–24 months out; constrained supply supports both.
Investment metrics
- 1% rule
- 0.97% ✗
- Cap rate
- 6.71%
- Cash-on-cash
- 1.50%
- DSCR
- 1.07
- GRM
- 8.6
CMA / ARV
- ARV (median comp)
- $156,867
- List price
- $335,000
- Delta
- 113.56%
- Verdict
- OVERPRICED
- Comps
- 1 within 2.0 mi
Show comp detail 1 sale within ~0.75 mi
| Address | Dist | Beds/Ba | Sqft | Sold | Price | $/sf | Match |
|---|---|---|---|---|---|---|---|
| 38768 Bautista Canyon Way | 0.04mi | 2/1.5 | 960 (+7%) | 14mo | $175,000 | $182 | 73 |
Match score weights: distance 35% · size 25% · config 20% · recency 20%. Top-matched comps best support the ARV.
Projected returns pro-forma
-3.0% appreciation · 1.6% rent growth · sell at horizon
- IRR
- -15.5%
- Equity multiple
- 0.45×
- Total profit
- $-51,197
- Equity at exit
- $49,950
- IRR
- -9.7%
- Equity multiple
- 0.44×
- Total profit
- $-52,445
- Equity at exit
- $28,965
Cash invested: $93,800 (down + closing). Projections, not guarantees.
Landlord ↔ Tenant lean methodology
- Overall (STATE)
- 18 Strongly Tenant-Friendly
- State California
- 18 Strongly Tenant-Friendly · D+13
- County
- — inherits STATE
- City
- — inherits STATE
ZIP-level market 92260
- Rents YoY
- 1.6%
- Active inventory
- 551
- Price-to-rent
- 8.6×
Monthly cashflow live
- Estimated rent
- $3,253 high interval (Pro) →
- Mortgage (P&I)
- −$1,757
- Tax from tax record
- −$156 /mo · $1,873/yr
- Insurance
- −$140
- HOA
- −$400
- Vacancy / Maint / Mgmt
- −$683
- Net cashflow
- $117
Break-even live
Sensitivity live
| Price | -10% $307 | -5% $212 | +0% $117 | +5% $23 | +10% $-72 |
|---|---|---|---|---|---|
| Rent | -10% $-140 | -5% $-11 | +0% $117 | +5% $246 | +10% $374 |
| Rate | -1.0pp $286 | -0.5pp $203 | base $117 | +0.5pp $31 | +1.0pp $-58 |
UW: 25.0% down · 7.5% · 30yr · 1.5% tax · 5.0% vac · 8.0% maint · 8.0% mgmt
Financing live
Cash to close
- Down payment
- $83,750
- Closing costs
- $10,050
- Reserves months
- —
- Total cash needed
- —
Loan-product check · same deal, 3 products live
Conventional
25% down · 7.5% · 30yr
- Down + closing
- —
- Monthly P&I
- —
- Monthly cashflow
- —
- DSCR
- —
- Eligible?
- —
Personal DTI + credit; lowest rate.
DSCR
20% down · 8.5% · 30yr
- Down + closing
- —
- Monthly P&I
- —
- Monthly cashflow
- —
- DSCR
- —
- Eligible?
- —
No personal income docs; deal must DSCR.
Hard money
10% down · 12.0% · 12mo
- Down + closing
- —
- Monthly P&I
- —
- Monthly cashflow
- —
- DSCR
- —
- Eligible?
- —
Short-term bridge; refi at stabilization.
Rent comps 7 comps
| Address | Beds | Baths | Sqft | Rent | $/sqft | DOM | Units | Dist |
|---|---|---|---|---|---|---|---|---|
| 74300 Country Club Dr Apt 5001 Palm Desert, CA | 2.0 | 2.0 | 1099 | $7,120 | $6.48 | 45d | 1 | 0.80mi |
| 74300 Country Club Dr Unit 243 Palm Desert, CA | 1.0 | 1.0 | 676 | $5,495 | $8.13 | 45d | 1 | 0.80mi |
| 73373 Country Club Dr Palm Desert, CA | 1.0–2.0 | 1.0–2.0 | 852 | $2,165 | $2.54 | 45d | 1 | 0.81mi |
| 40445 Portola Ave Palm Desert, CA | 1.0–2.0 | 1.0–2.0 | 975 | $3,215 | $3.30 | 1d | 16 | 0.85mi |
| 1 Marbella Ln Palm Desert, CA | 2.0 | 2.0 | 1080 | $4,500 | $4.17 | 45d | 1 | 0.99mi |
| 37600 College Dr Palm Desert, CA | 1.0–3.0 | 1.0–2.5 | 1195 | $2,458 | $2.06 | 0d | 20 | 1.30mi |
| 36101 Explorer Dr Palm Desert, CA | 1.0–3.0 | 1.0 | 805 | $1,478 | $1.84 | 45d | 1 | 1.34mi |
HOA detail
- Monthly dues
- $400 · $4,800/yr
- Likely covers
- trashinternet
Listing history 18 events
-
2026-06-21days on market $335,000 Active 83 DOM
-
2026-06-18days on market $335,000 Active 80 DOM
-
2026-06-17days on market $335,000 Active 79 DOM
-
2026-06-16days on market $335,000 Active 78 DOM
-
2026-06-15days on market $335,000 Active 77 DOM
-
2026-06-13days on market $335,000 Active 75 DOM
-
2026-06-09days on market $335,000 Active 71 DOM
-
2026-06-08days on market $335,000 Active 70 DOM
-
2026-06-07days on market $335,000 Active 69 DOM
-
2026-06-04days on market $335,000 Active 66 DOM
-
2026-06-03days on market $335,000 Active 65 DOM
-
2026-06-02days on market $335,000 Active 64 DOM
-
2026-06-01days on market $335,000 Active 63 DOM
-
2026-05-31days on market $335,000 Active 62 DOM
-
2026-04-29price $335,000 884-char remark
Show marketing remark (884 chars)
This beautifully updated home is just waiting for your personal touches. With an open floorplan, you will be able to entertain your family and friends with ease. The kitchen features granit counters, recessed lighting throughout the home, and a beautiful island. There is plenty of open space from the kitchen and family/living room. This home is offering you the opportunity to decorate and bring your own touches to this blank canvas. Come enjoy the country club lifestyle in the coveted Palm Desert Greens. Included in our low HOA dues, golf on our well manicured golf course, trash pickup, Spectrum WI-FI and TV. In addition, there are numerous clubs for you to participate in. BINGO is hosted on Friday nights here in the clubhouse. Whether you are looking for a quiet afternoon or social hour here with friends, Palm Desert Greens has it all. Come see this beautiful home today.
-
2026-03-27$345,000 Active 884-char remark
Show marketing remark (884 chars)
This beautifully updated home is just waiting for your personal touches. With an open floorplan, you will be able to entertain your family and friends with ease. The kitchen features granit counters, recessed lighting throughout the home, and a beautiful island. There is plenty of open space from the kitchen and family/living room. This home is offering you the opportunity to decorate and bring your own touches to this blank canvas. Come enjoy the country club lifestyle in the coveted Palm Desert Greens. Included in our low HOA dues, golf on our well manicured golf course, trash pickup, Spectrum WI-FI and TV. In addition, there are numerous clubs for you to participate in. BINGO is hosted on Friday nights here in the clubhouse. Whether you are looking for a quiet afternoon or social hour here with friends, Palm Desert Greens has it all. Come see this beautiful home today.
-
1998-07-31historical
-
1998-05-17$74,500
ⓘ Source: listings_history table (triggers on properties + properties_extension) + one-shot
backfill from property_details.listing_events for pre-trigger history.
Tax reassessment forecast CA · Resets to sale price
- Current annual tax
- $1,873 · $156/mo
- Projected year-2 tax
- $2,546 · $212/mo
- Expected delta
- +$673/yr (+$56/mo · 35.9%)
ⓘ Screening estimate from a state-policy table — verify with the county assessor before closing.
Climate risk First Street
- Flood 1/10 Low FEMA zone X (unshaded) · 0% chance over 30 yrs
- Wildfire 1/10 Low
- Heat 9/10 Extreme 6 d/yr ≥114°F today · 17 d/yr by 30 yrs out
- Wind 1/10 Low
- Air quality 4/10 Moderate 5 unhealthy d/yr today · 7 by 30 yrs out
Nearby sold comps map
Loading sold comps map…
Walkable amenities ~0.75 mi
Loading nearby amenities…
Taxation est. · year 1
- Rental income
- $39,035
- − Mortgage interest
- −$18,765
- − Property taxes
- −$1,873
- − Insurance
- −$1,675
- − Repairs & maintenance
- −$3,123
- − Management
- −$3,123
- − HOA
- −$4,800
- − Depreciation
- −$9,745
- Taxable loss
- −$4,069
- Est. tax savings @ 24.0%
- +$977
- After-tax cash flow
- $2,385/yr
For passive investors: Depreciation is non-cash, so a rental often shows a tax loss while cash-flowing — sheltering income. Rental losses are passive: they offset passive income freely, and up to $25,000/yr can offset ordinary (W-2) income if you actively participate and your MAGI is under $100k (phasing out to $0 by $150k); unused losses carry forward. On sale, claimed depreciation is recaptured at up to 25%, and gains may owe capital-gains tax (a 1031 exchange can defer both). Figures are a year-1 estimate at your 24.0% rate — not tax advice; consult a CPA.
Schools (NCES district)
- District
- Desert Sands Unified
- NCES district ID
- 0611110
- Math proficiency
- 31% ▼ -4.00%
- Reading proficiency
- 56% ▲ 7.00%
- Median HH income
- $54,957
- Composite
- 37.77/100
- National rank
- #4346
- State rank
- #199 of 517 in CA
Livability — Palm Desert
- Score
- 51/100
- State rank
- #1050
- US rank
- #25164
Category grades
Schools grade is shown separately in the Schools card above.
Census & demographics
- Census place
- Palm Desert, CA
- County
- Riverside County · 2,287,001 people
- City population
- 58,615
- Metro
- Riverside-San Bernardino-Ontario, CA
- Population (ZIP)
- 30,523
- Household income
- $70,091
- Rent vs Own
- Severe rent burden
- 1734.0
Population outlook (Riverside County) Hauer SSP2
- Today (2025)
- 2,664,475 people
- By 2030
- 2,802,692 · +5.2%
- By 2040
- 3,050,904 · +14.5%
- By 2050
- 3,256,783 · +22.2%
- By 2075
- 3,655,058 · +37.2%
- By 2100
- 3,766,594 · +41.4%
Race, ethnicity, and origin ACS 2023
- Neighborhood character
- Majority White (61%)
- Race & ethnicity
- White 61% Hispanic / Latino 31% Two or more races 20% Asian 4% Black 2%
- Hispanic origin (detail)
- Mexican 25%
- Common ancestry
- Italian 4% Lithuanian 3% Slovak 2%
- Foreign-born
- 18% · Canada, South Korea, Vietnam
- Languages at home
- 73% English-only · Spanish 22% French/Haitian/Cajun 1% Other Indo-European 1%
Political lean MEDSL · Riverside
- 2024 margin
- Toss-up / Even · D 48.0% · R 49.3% · Other 2.6%
- 2008→2024 swing
- -3.6pp toward R · 2008: 2.3pp · 2024: -1.3pp
- All cycles
- 2024: R+1.3 2020: D+8.0 2016: D+4.3 2012: R+0.4 2008: D+2.3
Not yet ingested
- Civics
- —
Market trends
- HPI YoY
- ▼ -364.94%
- Current HPI
- 294.9425
- Rent YoY
- ▲ 1.60%
- Metro
- Riverside-San Bernardino-Ontario, CA
- State GDP YoY
- ▲ 3.21%
- F500 in state
- 116
Industry mix (Fortune 500 HQ in CA)
| Industry | F500 HQs | Revenue |
|---|---|---|
| Technology | 27 | $1,492B |
|
||
| Financial Services | 3 | $174B |
|
||
| Retail | 3 | $44B |
|
||
| Insurance | 3 | $26B |
|
||
| Media / Entertainment | 2 | $115B |
|
||
| Pharmaceuticals / Biotech | 2 | $62B |
|
||
Price history
+349.7% since first listed4 events — show timeline
- 2026-04-29 Price Changed $335,000 GPSMLS
- 2026-03-27 Listed $345,000 GPSMLS
- 1998-07-31 Listing Removed — GPSMLS
- 1998-05-17 Listed $74,500 GPSMLS
Property tax history
+4.0%/yrLatest (2025): $1,873 · +6.4% YoY. Source: county tax records.
Cash-flow waterfall
monthlySold comps — $/sqft
last 12 mo · ≤1 miLoading sold comps…