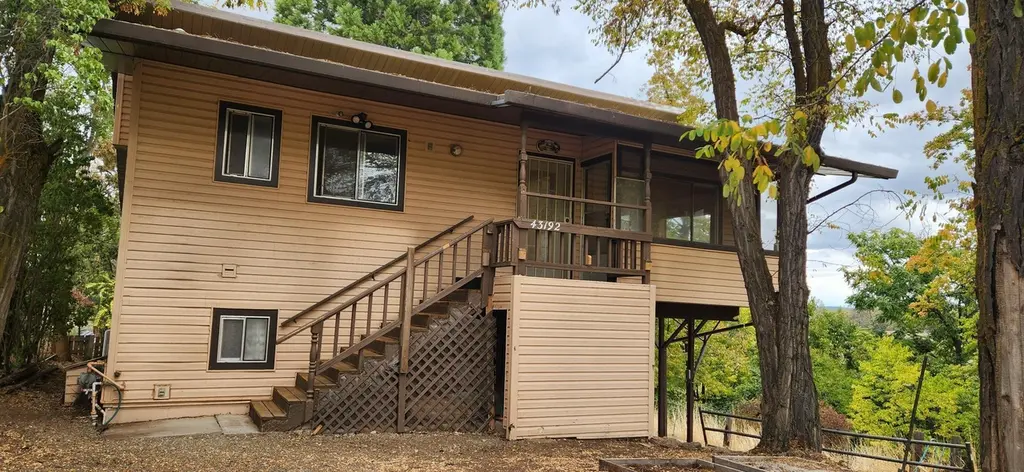
4 3192 River St · Fall River Mills, CA
Flood risk 6/10 · Moderate
- FEMA flood zone
- X (unshaded)
- Chance of flooding over 30 yrs
- 0.51%
- Est. flood insurance / yr
- $507 – $1,088
Fire risk 7/10 · Major
- Est. fire insurance / yr
- $659 – $1,223
Heat risk 5/10 · Moderate
- Hot days now (above 93°F)
- 7 days/yr
- Hot days in 30 yrs
- 17 days/yr
Wind risk 1/10 · Minimal
- Chance of severe wind over 30 yrs
- —
Air-quality risk 9/10 · Severe
- Unhealthy air days now
- 20 days/yr
- Unhealthy air days in 30 yrs
- 25 days/yr
Risk factors via First Street. Map © Google.
Why this score? — see what drove the B grade
The composite is a weighted blend of 9 inputs, each scored 0–100. Each bar is that input's sub-score; the figure is the points it added to the 100-point composite (weight × sub-score).
- Cash flow +24.3/30.0
- ARV discount +15.0/15.0
- DSCR +7.9/10.0
- Appreciation +6.4/10.0
- 1% rule +6.3/10.0
- Condition / age +2.8/5.0
- Schools +2.7/10.0
- Livability +2.6/5.0
- Rent growth +2.5/5.0
$199,000
🖨 Deal sheet 📄 Offer letter ✓ Due diligence
Listing remarks MLS
This property would be great as a vaction property, over look the Pit River from your sunroom cozy open living room and kitchen, downstairs bedroom and bath. Lots of storage, laundry area. Home is located in the heart of town close to all of the outdoor recreation, waterways an abundance of natural beauty
Key facts
- Open living room
- Lots of storage
- Laundry area
Tags
Neighborhood map
What this means for you Summary
Snapshot
- This is a 3-bed/2.0-bath single-family listed at $199k. Condition is rated average.
Deal economics
- At list price, monthly cash flow is $402 ($5k/yr) — positive.
- The deal already cash-flows at list — no discount required.
- Meets the 1% rule at list price ($2k rent vs $199k).
- Recommended offer: $187k (6.0% below list) — sets the bar for market timing.
Location & tenants
- Location reads 52/100 on livability (#1,038 in CA) — a working-class tenant base; expect higher turnover. Strengths: crime A, housing B; Watch: schools D, amenities F, commute F.
- Fall River Joint Unified (rural): math 28% / reading 35% proficiency, ranked #335 of 517 in CA (top 65%) — families likely to look elsewhere, expect single-tenant / working-renter base with shorter leases.
- Market conditions: 30 active listings in the ZIP; 1 comparable units currently listed for rent nearby; 246 units permitted in Shasta County in 2024 (0 in 5+ unit buildings).
Forward outlook
- In year one you build about $7k of equity ($1k loan paydown + $6k appreciation (2.9% local appreciation)).
- Shasta County population projected to shrink 9% by 2050 — rents likely to lag national; underwrite the cash flow, not the appreciation.
- At projected returns (2.9% appreciation + 3.0% rent growth), your $56k cash investment doubles in ~5 years — after that, you're playing with house money.
- By year 5, paydown + projected appreciation supports a ~$31k cash-out refi (75% LTV) — recoverable capital for the next deal without selling this one.
Negotiation context
- It's been on market 67 days — a 6% lower offer ($187k) is reasonable based on typical stale-listing flexibility.
- 2 sale attempts with the ask held roughly flat each time — persistent listings suggest the price (not the market) is what's stuck; bring a comps-based counter.
Risks & watch-outs
- Climate carrying-cost: major flood risk; major wildfire risk; extreme-heat days projected 7→17/yr by 2055 (HVAC capex compounding) — expect insurance premiums to compound above CPI over the hold.
Questions for the listing agent
- It's been on market 67 days. Have you received any prior offers? Is the seller open to a 6% concession, seller financing, or rate buy-down credit?
- Why hasn't it sold? Are there any deal-killer items the seller is aware of (foundation, flood, title, zoning, code violations)?
- Is there a deadline driving the sale (1031 exchange, divorce, estate, relocation)? That informs how much negotiation room exists.
- Schools are D-rated, which usually means shorter tenancies and higher turnover. Who's the typical renter profile here, and what's been the actual vacancy rate?
- What's the average days-on-market for RENTAL listings here right now (not sales)? A rising rental-DOM trend means longer vacancies and softer asking-rent achievability than the comps imply.
- What's the recent tenant-quality profile in this submarket — average credit score on applications, eviction rate, late-payment / NSF rate, and stable-employment percentage? A property-management company in the area should have these aggregated.
- How much new for-sale + rental construction is in the pipeline within 1–3 miles? Heavy new supply typically softens prices + rents 12–24 months out; constrained supply supports both.
Investment metrics
- 1% rule
- 1.13% ✓
- Cap rate
- 8.72%
- Cash-on-cash
- 8.66%
- DSCR
- 1.39
- GRM
- 7.4
CMA / ARV
- ARV (median comp)
- $240,367
- List price
- $199,000
- Delta
- -17.21%
- Verdict
- UNDERPRICED
- Comps
- 16 within 1.0 mi
Show comp detail 1 sale within ~0.75 mi
| Address | Dist | Beds/Ba | Sqft | Sold | Price | $/sf | Match |
|---|---|---|---|---|---|---|---|
| 24747 Green Valley Ct | 0.65mi | 3/2.5 | 1,778 (+11%) | 9mo | $340,000 | $191 | 42 |
Match score weights: distance 35% · size 25% · config 20% · recency 20%. Top-matched comps best support the ARV.
Projected returns pro-forma
2.87% appreciation · 3.0% rent growth · sell at horizon
- IRR
- 15.3%
- Equity multiple
- 1.87×
- Total profit
- $48,284
- Equity at exit
- $88,051
- IRR
- 17.1%
- Equity multiple
- 3.47×
- Total profit
- $137,735
- Equity at exit
- $134,598
Cash invested: $55,720 (down + closing). Projections, not guarantees.
Landlord ↔ Tenant lean methodology
- Overall (STATE)
- 18 Strongly Tenant-Friendly
- State California
- 18 Strongly Tenant-Friendly · D+13
- County
- — inherits STATE
- City
- — inherits STATE
ZIP-level market 96028
- Home prices YoY
- 2.0%
- Active inventory
- 30
- Price-to-rent
- 7.4×
Monthly cashflow live
- Estimated rent
- $2,250 medium interval (Pro) →
- Mortgage (P&I)
- −$1,044
- Tax est. 1.5%
- −$249 /mo · $2,985/yr
- Insurance
- −$83
- HOA
- −$0
- Vacancy / Maint / Mgmt
- −$472
- Net cashflow
- $402
Break-even live
UW: 25.0% down · 7.5% · 30yr · 1.5% tax · 5.0% vac · 8.0% maint · 8.0% mgmt
Financing live
Cash to close
- Down payment
- $49,750
- Closing costs
- $5,970
- Reserves months
- —
- Total cash needed
- —
Loan-product check · same deal, 3 products live
Conventional
25% down · 7.5% · 30yr
- Down + closing
- —
- Monthly P&I
- —
- Monthly cashflow
- —
- DSCR
- —
- Eligible?
- —
Personal DTI + credit; lowest rate.
DSCR
20% down · 8.5% · 30yr
- Down + closing
- —
- Monthly P&I
- —
- Monthly cashflow
- —
- DSCR
- —
- Eligible?
- —
No personal income docs; deal must DSCR.
Hard money
10% down · 12.0% · 12mo
- Down + closing
- —
- Monthly P&I
- —
- Monthly cashflow
- —
- DSCR
- —
- Eligible?
- —
Short-term bridge; refi at stabilization.
Rent comps 1 comps
| Address | Beds | Baths | Sqft | Rent | $/sqft | DOM | Units | Dist |
|---|---|---|---|---|---|---|---|---|
| 24909 2nd St Fall River Mills, CA | 3.0 | 1.5 | 1600 | $2,250 | $1.41 | 43d | 1 | 0.09mi |
Listing history 20 events
-
2026-06-19days on market $199,000 Active 67 DOM
-
2026-06-18days on market $199,000 Active 66 DOM
-
2026-06-17days on market $199,000 Active 65 DOM
-
2026-06-16days on market $199,000 Active 64 DOM
-
2026-06-15days on market $199,000 Active 63 DOM
-
2026-06-14days on market $199,000 Active 61 DOM
-
2026-06-12days on market $199,000 Active 60 DOM
-
2026-06-09days on market $199,000 Active 57 DOM
-
2026-06-08days on market $199,000 Active 56 DOM
-
2026-06-07days on market $199,000 Active 55 DOM
-
2026-06-07days on market $199,000 Active 54 DOM
-
2026-06-04days on market $199,000 Active 51 DOM
-
2026-06-02days on market $199,000 Active 50 DOM
-
2026-06-01days on market $199,000 Active 49 DOM
-
2026-05-31days on market $199,000 Active 48 DOM
-
2026-05-31days on market $199,000 Active 47 DOM
-
2026-04-13$199,000 Active 307-char remark
Show marketing remark (307 chars)
This property would be great as a vaction property, over look the Pit River from your sunroom cozy open living room and kitchen, downstairs bedroom and bath. Lots of storage, laundry area. Home is located in the heart of town close to all of the outdoor recreation, waterways an abundance of natural beauty
-
2026-02-06price $199,000
-
2025-10-28price $205,000
-
2025-10-10$220,000 Active
ⓘ Source: listings_history table (triggers on properties + properties_extension) + one-shot
backfill from property_details.listing_events for pre-trigger history.
Climate risk First Street
- Flood 6/10 Major FEMA zone X (unshaded) · 51% chance over 30 yrs
- Wildfire 7/10 Severe
- Heat 5/10 Major 7 d/yr ≥93°F today · 17 d/yr by 30 yrs out
- Wind 1/10 Low
- Air quality 9/10 Extreme 20 unhealthy d/yr today · 25 by 30 yrs out
Nearby sold comps map
Loading sold comps map…
Walkable amenities ~0.75 mi
Loading nearby amenities…
Taxation est. · year 1
- Rental income
- $27,000
- − Mortgage interest
- −$11,147
- − Property taxes
- −$2,985
- − Insurance
- −$995
- − Repairs & maintenance
- −$2,160
- − Management
- −$2,160
- − Depreciation
- −$5,789
- Taxable income
- $1,764
- Est. tax owed @ 24.0%
- −$423
- After-tax cash flow
- $4,404/yr
For passive investors: Depreciation is non-cash, so a rental often shows a tax loss while cash-flowing — sheltering income. Rental losses are passive: they offset passive income freely, and up to $25,000/yr can offset ordinary (W-2) income if you actively participate and your MAGI is under $100k (phasing out to $0 by $150k); unused losses carry forward. On sale, claimed depreciation is recaptured at up to 25%, and gains may owe capital-gains tax (a 1031 exchange can defer both). Figures are a year-1 estimate at your 24.0% rate — not tax advice; consult a CPA.
Condition & rehab AI · 12 photos
The property requires moderate renovations to improve its condition and increase its value. Repairs to the wooden deck and exterior siding are critical, along with painting the interior walls and replacing the carpeting.
Repairs flagged
- Major wooden deck — severe wear
- Major exterior siding — visible wear
- Major interior walls — some wear
Value-add opportunities
- Both paint interior walls — enhances curb appeal and interior aesthetics
- Both replace carpeting — improves comfort and reduces maintenance
- Both repair wooden deck — enhances safety and curb appeal
Renovation cost estimate screening
| Repair item | Severity | Est. cost |
|---|---|---|
| wooden deck · severe wear | Major | $15,000–50,000 |
| exterior siding · visible wear | Major | $15,000–50,000 |
| interior walls · some wear | Major | $15,000–50,000 |
| Total estimated repair cost · 3 items | $45,000–150,000 |
Value-add ROI direction
- Both paint interior walls — enhances curb appeal and interior aesthetics ↑
- Both replace carpeting — improves comfort and reduces maintenance ↑
- Both repair wooden deck — enhances safety and curb appeal ↑
ⓘ Cost ranges are severity-bucket heuristics (US national rule-of-thumb). Get contractor quotes + a written scope before underwriting a rehab budget.
Schools (NCES district)
- District
- Fall River Joint Unified
- NCES district ID
- 0613470
- Math proficiency
- 28% ▼ -9.00%
- Reading proficiency
- 35% ▼ -3.00%
- Median HH income
- $40,991
- Composite
- 26.57/100
- National rank
- #7186
- State rank
- #335 of 517 in CA
Livability — Fall River Mills
- Score
- 52/100
- State rank
- #1038
- US rank
- #25079
Category grades
Schools grade is shown separately in the Schools card above.
Census & demographics
- Census place
- Fall River Mills, CA
- Population (ZIP)
- 1,667
Population outlook (Shasta County) Hauer SSP2
- Today (2025)
- 179,231 people
- By 2030
- 176,953 · -1.3%
- By 2040
- 169,982 · -5.2%
- By 2050
- 162,547 · -9.3%
- By 2075
- 145,649 · -18.7%
- By 2100
- 123,025 · -31.4%
Race, ethnicity, and origin ACS 2023
- Neighborhood character
- Predominantly White (68%)
- Race & ethnicity
- White 68% Two or more races 23% Hispanic / Latino 22% Native American 3%
- Hispanic origin (detail)
- Mexican 21%
- Common ancestry
- Slovak 8% Romanian 5% Italian 4%
- Foreign-born
- 1% · Canada
- Languages at home
- 91% English-only · Spanish 8% German/W. Germanic 1%
Political lean MEDSL · Shasta
- 2024 margin
- Solid R (+36.5) · D 30.5% · R 67.0% · Other 2.5%
- 2008→2024 swing
- -10.7pp toward R · 2008: -25.8pp · 2024: -36.5pp
- All cycles
- 2024: R+36.5 2020: R+33.1 2016: R+37.4 2012: R+30.3 2008: R+25.8
Not yet ingested
- Civics
- —
Market trends
- HPI YoY
- ▲ 2.87%
- Current HPI
- 149.094
- Rent YoY
- —
- Metro
- —
- State GDP YoY
- ▲ 3.21%
- F500 in state
- 116
Industry mix (Fortune 500 HQ in CA)
| Industry | F500 HQs | Revenue |
|---|---|---|
| Technology | 27 | $1,492B |
|
||
| Financial Services | 3 | $174B |
|
||
| Retail | 3 | $44B |
|
||
| Insurance | 3 | $26B |
|
||
| Media / Entertainment | 2 | $115B |
|
||
| Pharmaceuticals / Biotech | 2 | $62B |
|
||
Price history
-9.5% since first listed4 events — show timeline
- 2026-04-13 Listed $199,000 SAOR
- 2026-02-06 Price Changed $199,000 SAOR
- 2025-10-28 Price Changed $205,000 SAOR
- 2025-10-10 Listed $220,000 SAOR
Cash-flow waterfall
monthlySold comps — $/sqft
last 12 mo · ≤1 miLoading sold comps…