433 Cumberland Ave · Silver City, NC
Flood risk 1/10 · Minimal
- FEMA flood zone
- X (unshaded)
- Chance of flooding over 30 yrs
- 0.0%
- Est. flood insurance / yr
- $507 – $1,088
Fire risk 6/10 · Moderate
- Est. fire insurance / yr
- $906 – $1,684
Heat risk 7/10 · Major
- Hot days now (above 107°F)
- 7 days/yr
- Hot days in 30 yrs
- 17 days/yr
Wind risk 6/10 · Moderate
- Chance of severe wind over 30 yrs
- 74.0%
Air-quality risk 1/10 · Minimal
- Unhealthy air days now
- 0 days/yr
- Unhealthy air days in 30 yrs
- 0 days/yr
Risk factors via First Street. Map © Google.
Why this score? — see what drove the B grade
The composite is a weighted blend of 9 inputs, each scored 0–100. Each bar is that input's sub-score; the figure is the points it added to the 100-point composite (weight × sub-score).
- Cash flow +30.0/30.0
- ARV discount +15.0/15.0
- DSCR +10.0/10.0
- 1% rule +7.7/10.0
- Livability +3.4/5.0
- Schools +3.2/10.0
- Rent growth +3.0/5.0
- Condition / age +2.5/5.0
- Appreciation +0.0/10.0
$150,000
🖨 Deal sheet 📄 Offer letter ✓ Due diligence
Listing remarks
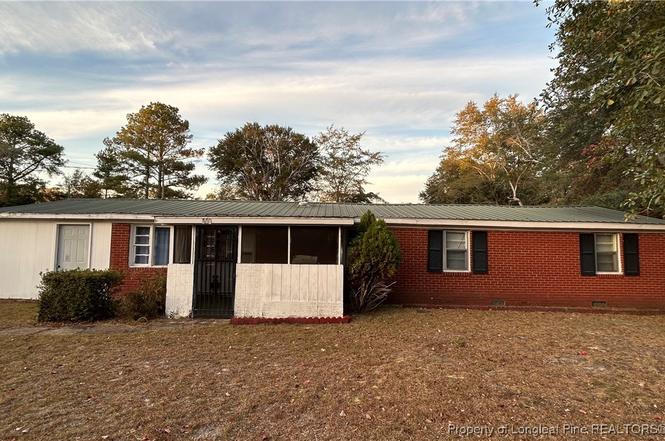
Located just minutes from downtown Raeford, this ranch-style home offers excellent potential for homeowners or investors. The property includes 3 bedrooms, 1 bathroom, a kitchen, living room, and front room, as well as a screened-in front porch and a covered rear room that could serve as additional living or storage space. A single-space carport sits behind the home, and the spacious, partially fenced backyard provides plenty of room for relaxation or entertaining. With some TLC, this home could truly shine as a great family residence or investment opportunity. Please note: The home does not currently have a permanent heating or cooling source. Per owners, the heat previously operated on pr
Key facts
- Covered rear room
- Parking
- Built 1961
Tags
Property features AI
Finance
- Other: Located in the Raeford subdivision
Exterior
- Parking: Attached carport; Covered parking for 1 vehicle; 1-car carport
- Utilities: Public water; Public sewer
- Home design: Single family residence; Residential property
- Construction: Brick construction
- Exterior features: Front porch; Porch; Storm door(s)
Interior
- Kitchen: Range
- Bedrooms: 5 total rooms (bedroom count not specified)
- Flooring: Carpet; Tile
- Bathrooms: 1 full bathroom
- Heating & cooling: No heating system specified
- Interior features: Range; No fireplace; Crawl space basement
Neighborhood map
What this means for you Summary
Snapshot
- This is a 3-bed/1.0-bath single-family listed at $150k.
Deal economics
- At list price, monthly cash flow is $622 ($7k/yr) — positive.
- The deal already cash-flows at list — no discount required.
- Meets the 1% rule at list price ($2k rent vs $150k).
- Recommended offer: $132k (12.0% below list) — sets the bar for market timing.
Location & tenants
- Location reads 68/100 on livability (#196 in NC) — a middle-class / working-renter tenant base. Strengths: cost of living A+, crime A-, housing A-; Watch: employment D, amenities F, commute D-.
- Hoke County Schools (suburban): math 35% / reading 40% proficiency, ranked #123 of 178 in NC (top 69%) — families likely to look elsewhere, expect single-tenant / working-renter base with shorter leases.
- Zoned schools: West Hoke Middle (math 23% / reading 32%, grade F, #368 of 475 statewide, top 78%, 576 students, 100% FRL); Hoke County High (math 42% / reading 44%, grade F, #372 of 535 statewide, top 69%, 2,060 students, 100% FRL) — zoned schools average 100% FRL vs 57% district-wide (43 pts higher); higher-poverty schools than district average — tighter screening recommended.
- Market conditions: Rents rising (+1.9%/yr); 566 active listings in the ZIP; 7 comparable units currently listed for rent nearby; rentals at typical pace (median 24d on market — plan ~3-4 weeks tenant-placement turnaround); 685 units permitted in Hoke County in 2024 (0 in 5+ unit buildings).
- This rent runs 34% of the median local income ($66k/yr) — at the standard rent-burdened threshold; future hikes will face affordability resistance.
Forward outlook
- Local home prices are declining (-3.0%/yr); year-one equity from $1k of loan paydown is wiped out by about $4k of value loss. Plan a longer hold.
- Hoke County population projected at +36% by 2050 — long-run rental-demand tailwind backs the buy-and-hold thesis.
- At projected returns (-3.0% appreciation + 1.9% rent growth), your $42k cash investment doubles in ~8 years — after that, you're playing with house money.
Negotiation context
- It's been on market 210 days — a 12% lower offer ($132k) is reasonable based on typical stale-listing flexibility.
Risks & watch-outs
- Climate carrying-cost: major wind risk, 74% chance of damaging wind over 30y; major wildfire risk; extreme-heat days projected 7→17/yr by 2055 (HVAC capex compounding) — expect insurance premiums to compound above CPI over the hold.
Questions for the listing agent
- It's been on market 210 days. Have you received any prior offers? Is the seller open to a 12% concession, seller financing, or rate buy-down credit?
- Built in 1961 — when were the roof, HVAC, electrical panel, plumbing, and water heater last replaced?
- Why hasn't it sold? Are there any deal-killer items the seller is aware of (foundation, flood, title, zoning, code violations)?
- Is there a deadline driving the sale (1031 exchange, divorce, estate, relocation)? That informs how much negotiation room exists.
- Schools are F-rated, which usually means shorter tenancies and higher turnover. Who's the typical renter profile here, and what's been the actual vacancy rate?
- What's the average days-on-market for RENTAL listings here right now (not sales)? A rising rental-DOM trend means longer vacancies and softer asking-rent achievability than the comps imply.
- What's the recent tenant-quality profile in this submarket — average credit score on applications, eviction rate, late-payment / NSF rate, and stable-employment percentage? A property-management company in the area should have these aggregated.
- How much new for-sale + rental construction is in the pipeline within 1–3 miles? Heavy new supply typically softens prices + rents 12–24 months out; constrained supply supports both.
Investment metrics
- 1% rule
- 1.27% ✓
- Cap rate
- 11.27%
- Cash-on-cash
- 17.78%
- DSCR
- 1.79
- GRM
- 6.6
CMA / ARV
- ARV (on-the-fly)
- $284,800
- Comps found
- 12
Show comp detail 12 sales within ~0.75 mi
| Address | Dist | Beds/Ba | Sqft | Sold | Price | $/sf | Match |
|---|---|---|---|---|---|---|---|
| 303 E 7th Ave | 0.33mi | 3/2.0 | 1,920 (+8%) | 1mo | $299,000 | $156 | 66 |
| 610 N Main St St | 0.51mi | 3/2.5 | 1,687 (-5%) | 1mo | $279,999 | $166 | 61 |
| 349 E 7th Ave | 0.32mi | 4/2.0 (+1) | 1,918 (+8%) | 8mo | $295,001 | $154 | 57 |
| 213 E 7th Ave | 0.35mi | 4/2.5 (+1) | 1,964 (+10%) | 2mo | $310,000 | $158 | 54 |
| 128 Meadow Sage (lot 114) St | 0.47mi | 3/2.0 | 1,602 (-10%) | 4mo | $299,900 | $187 | 54 |
| 510 E Donaldson Ave | 0.69mi | 3/2.0 | 1,866 (+5%) | 4mo | $270,000 | $145 | 52 |
| 195 Meadow Sage (lot 123) St | 0.50mi | 3/2.5 | 2,035 (+14%) | 2mo | $349,500 | $172 | 46 |
| 171 Meadow Sage (lot 121) St | 0.50mi | 3/2.5 | 2,037 (+14%) | 3mo | $349,500 | $172 | 44 |
| 1109 Fulton St | 0.58mi | 4/2.0 (+1) | 1,626 (-9%) | 9mo | $177,000 | $109 | 42 |
| 201 Wilshire Ln | 0.70mi | 3/2.0 | 1,611 (-10%) | 8mo | $232,500 | $144 | 41 |
| 606 Mclean St | 0.63mi | 4/2.5 (+1) | 1,945 (+9%) | 4mo | $329,000 | $169 | 40 |
| 103 Wilshire Ln | 0.69mi | 3/2.5 | 1,592 (-11%) | 8mo | $255,000 | $160 | 38 |
Match score weights: distance 35% · size 25% · config 20% · recency 20%. Top-matched comps best support the ARV.
Projected returns pro-forma
-3.0% appreciation · 1.92% rent growth · sell at horizon
- IRR
- 8.1%
- Equity multiple
- 1.31×
- Total profit
- $13,216
- Equity at exit
- $22,365
- IRR
- 16.5%
- Equity multiple
- 2.29×
- Total profit
- $54,055
- Equity at exit
- $12,969
Cash invested: $42,000 (down + closing). Projections, not guarantees.
Landlord ↔ Tenant lean methodology
- Overall (STATE)
- 85 Strongly Landlord-Friendly
- State North Carolina
- 85 Strongly Landlord-Friendly · R+3
- County
- — inherits STATE
- City
- — inherits STATE
ZIP-level market 28376
- Home prices YoY
- -24.0%
- Rents YoY
- 1.9%
- Active inventory
- 566
- Price-to-rent
- 6.6×
Monthly cashflow live
- Estimated rent
- $1,906 high interval (Pro) →
- Mortgage (P&I)
- −$787
- Tax from tax record
- −$34 /mo · $407/yr
- Insurance
- −$62
- HOA
- −$0
- Vacancy / Maint / Mgmt
- −$400
- Net cashflow
- $622
Break-even live
UW: 25.0% down · 7.5% · 30yr · 1.5% tax · 5.0% vac · 8.0% maint · 8.0% mgmt
Financing live
Cash to close
- Down payment
- $37,500
- Closing costs
- $4,500
- Reserves months
- —
- Total cash needed
- —
Loan-product check · same deal, 3 products live
Conventional
25% down · 7.5% · 30yr
- Down + closing
- —
- Monthly P&I
- —
- Monthly cashflow
- —
- DSCR
- —
- Eligible?
- —
Personal DTI + credit; lowest rate.
DSCR
20% down · 8.5% · 30yr
- Down + closing
- —
- Monthly P&I
- —
- Monthly cashflow
- —
- DSCR
- —
- Eligible?
- —
No personal income docs; deal must DSCR.
Hard money
10% down · 12.0% · 12mo
- Down + closing
- —
- Monthly P&I
- —
- Monthly cashflow
- —
- DSCR
- —
- Eligible?
- —
Short-term bridge; refi at stabilization.
Rent comps 7 comps
| Address | Beds | Baths | Sqft | Rent | $/sqft | DOM | Units | Dist |
|---|---|---|---|---|---|---|---|---|
| 122 Sherman Ct Unit 122 Raeford, NC | 3.0 | 2.5 | 1400 | $1,600 | $1.14 | 23d | 1 | 0.21mi |
| 916 Stevens St Raeford, NC | 3.0 | 2.5 | 1646 | $1,900 | $1.15 | 23d | 1 | 0.23mi |
| 125 Burgess Ln Raeford, NC | 3.0 | 2.5 | 1460 | $1,600 | $1.10 | 23d | 1 | 0.23mi |
| 198 Peeler Raeford, NC | 4.0 | 2.5 | 1886 | $2,150 | $1.14 | 23d | 1 | 0.81mi |
| 123 Main St Raeford, NC | 4.0 | 2.5 | 1913 | $2,200 | $1.15 | 23d | 1 | 0.91mi |
| 113 N Wright St Raeford, NC | 3.0 | 2.0 | 1585 | $1,550 | $0.98 | 14d | 1 | 1.35mi |
| 779 Doc Brown Rd Raeford, NC | 4.0 | 2.5 | 2105 | $2,200 | $1.05 | 14d | 1 | 1.40mi |
Listing history 18 events
-
2026-06-18days on market $150,000 Active 210 DOM
-
2026-06-17days on market $150,000 Active 209 DOM
-
2026-06-16days on market $150,000 Active 208 DOM
-
2026-06-15days on market $150,000 Active 207 DOM
-
2026-06-14days on market $150,000 Active 205 DOM
-
2026-06-13days on market $150,000 Active 204 DOM
-
2026-06-10days on market $150,000 Active 202 DOM
-
2026-06-09days on market $150,000 Active 201 DOM
-
2026-06-08days on market $150,000 Active 200 DOM
-
2026-06-07days on market $150,000 Active 199 DOM
-
2026-06-05days on market $150,000 Active 196 DOM
-
2026-06-03days on market $150,000 Active 195 DOM
-
2026-06-02days on market $150,000 Active 194 DOM
-
2026-06-01days on market $150,000 Active 193 DOM
-
2026-05-31days on market $150,000 Active 192 DOM
-
2026-05-30days on market $150,000 Active 191 DOM
-
2026-03-12price $150,000
-
2025-11-17$190,000 Active
ⓘ Source: listings_history table (triggers on properties + properties_extension) + one-shot
backfill from property_details.listing_events for pre-trigger history.
Tax reassessment forecast NC · Resets to sale price
- Current annual tax
- $407 · $34/mo
- Projected year-2 tax
- $1,230 · $102/mo
- Expected delta
- +$823/yr (+$69/mo · 201.9%)
ⓘ Screening estimate from a state-policy table — verify with the county assessor before closing.
Climate risk First Street
- Flood 1/10 Low FEMA zone X (unshaded) · 0% chance over 30 yrs
- Wildfire 6/10 Major
- Heat 7/10 Severe 7 d/yr ≥107°F today · 17 d/yr by 30 yrs out
- Wind 6/10 Major 74% chance of damaging wind over 30 yrs
- Air quality 1/10 Low 0 unhealthy d/yr today · 0 by 30 yrs out
Nearby sold comps map
Loading sold comps map…
Walkable amenities ~0.75 mi
Loading nearby amenities…
Taxation est. · year 1
- Rental income
- $22,867
- − Mortgage interest
- −$8,402
- − Property taxes
- −$407
- − Insurance
- −$750
- − Repairs & maintenance
- −$1,829
- − Management
- −$1,829
- − Depreciation
- −$4,364
- Taxable income
- $5,285
- Est. tax owed @ 24.0%
- −$1,268
- After-tax cash flow
- $6,200/yr
For passive investors: Depreciation is non-cash, so a rental often shows a tax loss while cash-flowing — sheltering income. Rental losses are passive: they offset passive income freely, and up to $25,000/yr can offset ordinary (W-2) income if you actively participate and your MAGI is under $100k (phasing out to $0 by $150k); unused losses carry forward. On sale, claimed depreciation is recaptured at up to 25%, and gains may owe capital-gains tax (a 1031 exchange can defer both). Figures are a year-1 estimate at your 24.0% rate — not tax advice; consult a CPA.
Schools (NCES district)
- District
- Hoke County Schools
- NCES district ID
- 3702250
- Math proficiency
- 35% ▼ -1.00%
- Reading proficiency
- 40% ▲ 1.00%
- Median HH income
- $43,896
- Composite
- 31.82/100
- National rank
- #5880
- State rank
- #123 of 178 in NC
Livability — Silver City
- Score
- 68/100
- State rank
- #196
- US rank
- #9631
Category grades
Schools grade is shown separately in the Schools card above.
Census & demographics
- Census place
- Silver City, NC
- County
- Hoke County · 44,880 people
- Metro
- Fayetteville, NC
- Population (ZIP)
- 44,880
- Household income
- $66,471
- Rent vs Own
- Severe rent burden
- 897.0
Population outlook (Hoke County) Hauer SSP2
- Today (2025)
- 63,354 people
- By 2030
- 68,361 · +7.9%
- By 2040
- 78,074 · +23.2%
- By 2050
- 86,384 · +36.4%
- By 2075
- 99,517 · +57.1%
- By 2100
- 98,939 · +56.2%
Race, ethnicity, and origin ACS 2023
- Neighborhood character
- Highly diverse neighborhood (Simpson 0.71)
- Race & ethnicity
- White 38% Black 35% Hispanic / Latino 15% Two or more races 9% Native American 3% Asian 1%
- Hispanic origin (detail)
- Mexican 7% Puerto Rican 4%
- Common ancestry
- Slovak 2% Romanian 1% Italian 1%
- Foreign-born
- 6% · Canada, Vietnam
- Languages at home
- 89% English-only · Spanish 8% French/Haitian/Cajun 1%
Political lean MEDSL · Hoke
- 2024 margin
- Lean D (+5.9) · D 52.4% · R 46.4% · Other 1.2%
- 2008→2024 swing
- -12.8pp toward R · 2008: 18.8pp · 2024: 5.9pp
- All cycles
- 2024: D+5.9 2020: D+10.9 2016: D+10.8 2012: D+19.0 2008: D+18.8
Not yet ingested
- Civics
- —
Market trends
- HPI YoY
- ▼ -53.30%
- Current HPI
- 169.1801
- Rent YoY
- ▲ 1.92%
- Metro
- Fayetteville, NC
- State GDP YoY
- ▲ 3.28%
- F500 in state
- 26
Industry mix (Fortune 500 HQ in NC)
| Industry | F500 HQs | Revenue |
|---|---|---|
| Financial Services | 2 | $213B |
|
||
| Retail | 2 | $95B |
|
||
| Industrial Conglomerate | 1 | $38B |
|
||
| Metals / Steel | 1 | $35B |
|
||
| Utilities | 1 | $30B |
|
||
| Industrial Machinery | 1 | $19B |
|
||
Price history
-21.1% since first listed2 events — show timeline
- 2026-03-12 Price Changed $150,000 LPRMLS
- 2025-11-17 Listed $190,000 LPRMLS
Property tax history
+2.4%/yrLatest (2025): $407 · +0.0% YoY. Source: county tax records.
Cash-flow waterfall
monthlySold comps — $/sqft
last 12 mo · ≤1 miLoading sold comps…