45067 Pipevine Cir · Alva, FL
Flood risk No data
- FEMA flood zone
- —
- Chance of flooding over 30 yrs
- —
- Est. flood insurance / yr
- —
Fire risk No data
- Est. fire insurance / yr
- —
Heat risk No data
- Hot days now (above threshold)
- —
- Hot days in 30 yrs
- —
Wind risk No data
- Chance of severe wind over 30 yrs
- —
Air-quality risk No data
- Unhealthy air days now
- —
- Unhealthy air days in 30 yrs
- —
Risk factors via First Street. Map © Google.
Why this score? — see what drove the B- grade
The composite is a weighted blend of 9 inputs, each scored 0–100. Each bar is that input's sub-score; the figure is the points it added to the 100-point composite (weight × sub-score).
- Cash flow +24.4/30.0
- 1% rule +7.9/10.0
- DSCR +7.9/10.0
- ARV discount +7.5/15.0
- Schools +4.6/10.0
- Condition / age +4.0/5.0
- Rent growth +3.5/5.0
- Livability +3.4/5.0
- Appreciation +2.4/10.0
$340,298
🖨 Deal sheet 📄 Offer letter ✓ Due diligence
Listing remarks MLS
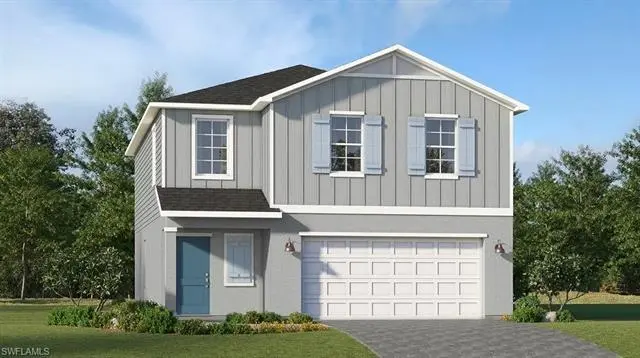
This expansive two-story home boasts a well-designed layout, featuring a first floor dedicated to shared living and entertaining. The open-concept design seamlessly connects the kitchen, dining room and family room, with a covered lanai extending the interior space outdoors. Upstairs, a spacious loft separates the three secondary bedrooms from the serene owner's suite. Completing the home is a convenient two-car garage.
Key facts
- Open-concept design
- Covered lanai
- Spacious loft
Tags
Property features AI
Finance
- Other: Property listed as new construction; Possession at closing
- Financial info: Total one-time fees and recurring fee totals recorded (buyer to verify exact amounts)
- HOA & community: Mandatory HOA; Master HOA fee collected quarterly; Quarterly HOA fees; Master HOA approximately $700 quarterly; HOA approximately $589.50 quarterly; One-time other fee listed; Total annual recurring fees noted; HOA maintenance covers insurance, internet/Wi-Fi, lawn/land maintenance, recreation facilities and street lights; Developer-managed community; Community amenities include clubhouse, pools, parks, dog park, exercise room, tennis, pickleball, basketball, bike/jog paths, fishing pier, boat dock/launch, shuffleboard, beauty salon, electric vehicle charging, sidewalks and underground utilities; Community type: Non-gated with tennis
Exterior
- Parking: Attached 2-car garage
- Security: Smoke detectors
- Utilities: Central water; Central sewer; Electric service (central)
- Home design: Single-family home; 2-story traditional design; Rear exposure faces south; Located in Babcock Ranch development (Sabal Glen at Midtown)
- Construction: Concrete block construction; Built in 2026
- Exterior features: Stucco exterior; Shingle roof; Single-hung and sliding windows; Manual shutters for storm protection; Landscaped area view; Regular lot; Developer-provided lot dimensions; Irrigation with lake/canal and reclaimed water
Interior
- Kitchen: Dishwasher; Disposal; Microwave; Range; Self-cleaning oven; Refrigerator/ice maker; Freezer; Pantry
- Bedrooms: 4 bedrooms; Master bedroom located upstairs
- Flooring: Carpet; Tile
- Bathrooms: 2 full bathrooms; 1 half bathroom; Master bath with shower (no tub)
- Heating & cooling: Central electric heating; Central electric cooling
- Interior features: High-speed internet available; Pantry; Smoke detectors; Walk-in closet; Window coverings; Breakfast bar, eat-in kitchen and dining area in living space; Great room, loft, open porch/lanai, guest room and guest bath; Laundry in residence
- Laundry & utility: Washer and dryer included; Auto garage door
Neighborhood map
What this means for you Summary
Snapshot
- This is a 4-bed/2.5-bath single-family listed at $340k. Condition is rated good.
Deal economics
- At list price, monthly cash flow is $690 ($8k/yr) — positive.
- The deal already cash-flows at list — no discount required.
- Meets the 1% rule at list price ($4k rent vs $340k).
- Recommended offer: $330k (3.0% below list) — sets the bar for market timing.
Location & tenants
- Location reads 68/100 on livability (#514 in FL) — a middle-class / working-renter tenant base. Strengths: crime A+, employment A+, housing A+; Watch: schools C-, amenities F, commute F.
- Charlotte (suburban): math 54% / reading 54% proficiency, ranked #22 of 73 in FL (top 30%) — acceptable for families but not a draw, mixed tenant base, ~2y average lease.
- Market conditions: Rents rising fast (+4.1%/yr); 1037 active listings in the ZIP; 6 comparable units currently listed for rent nearby; rentals at typical pace (median 21d on market — plan ~3-4 weeks tenant-placement turnaround); 4,585 units permitted in Charlotte County in 2024 (703 in 5+ unit buildings).
- At $4,395/mo this rent would consume 73% of the median local household income ($72k/yr) (locally 43% of renters already pay >50% of income on rent) — very limited rent-growth headroom before tenants either downsize or default.
Forward outlook
- Local home prices are declining (-3.0%/yr); year-one equity from $2k of loan paydown is wiped out by about $10k of value loss. Plan a longer hold.
- Charlotte County population projected at +24% by 2050 — long-run rental-demand tailwind backs the buy-and-hold thesis.
- At projected returns (-3.0% appreciation + 4.1% rent growth), your $95k cash investment doubles in ~10 years — after that, you're playing with house money.
Negotiation context
- It's been on market 45 days — a 3% lower offer ($330k) is reasonable based on typical stale-listing flexibility.
- 2 sale attempts with the ask held roughly flat each time — persistent listings suggest the price (not the market) is what's stuck; bring a comps-based counter.
Questions for the listing agent
- It's been on market 45 days. Have you received any prior offers? Is the seller open to a 3% concession, seller financing, or rate buy-down credit?
- What does the HOA fee cover, when was the last increase, and are there any pending special assessments or reserve-fund shortfalls?
- Is there a deadline driving the sale (1031 exchange, divorce, estate, relocation)? That informs how much negotiation room exists.
- What's the average days-on-market for RENTAL listings here right now (not sales)? A rising rental-DOM trend means longer vacancies and softer asking-rent achievability than the comps imply.
- What's the recent tenant-quality profile in this submarket — average credit score on applications, eviction rate, late-payment / NSF rate, and stable-employment percentage? A property-management company in the area should have these aggregated.
- How much new for-sale + rental construction is in the pipeline within 1–3 miles? Heavy new supply typically softens prices + rents 12–24 months out; constrained supply supports both.
Investment metrics
- 1% rule
- 1.29% ✓
- Cap rate
- 8.73%
- Cash-on-cash
- 8.69%
- DSCR
- 1.39
- GRM
- 6.5
CMA / ARV
No comps found within radius.
Projected returns pro-forma
-3.0% appreciation · 4.13% rent growth · sell at horizon
- IRR
- -1.6%
- Equity multiple
- 0.94×
- Total profit
- $-5,791
- Equity at exit
- $50,740
- IRR
- 9.5%
- Equity multiple
- 1.78×
- Total profit
- $74,134
- Equity at exit
- $29,423
Cash invested: $95,283 (down + closing). Projections, not guarantees.
Landlord ↔ Tenant lean methodology
- Overall (STATE)
- 87 Strongly Landlord-Friendly
- State Florida
- 87 Strongly Landlord-Friendly · R+3
- County
- — inherits STATE
- City
- — inherits STATE
ZIP-level market 33982
- Home prices YoY
- -1.2%
- Rents YoY
- 4.1%
- Active inventory
- 1037
- Price-to-rent
- 6.5×
Monthly cashflow live
- Estimated rent
- $4,395 high interval (Pro) →
- Mortgage (P&I)
- −$1,785
- Tax est. 1.5%
- −$425 /mo · $5,104/yr
- Insurance
- −$142
- HOA
- −$430
- Vacancy / Maint / Mgmt
- −$923
- Net cashflow
- $690
Break-even live
UW: 25.0% down · 7.5% · 30yr · 1.5% tax · 5.0% vac · 8.0% maint · 8.0% mgmt
Financing live
Cash to close
- Down payment
- $85,074
- Closing costs
- $10,209
- Reserves months
- —
- Total cash needed
- —
Loan-product check · same deal, 3 products live
Conventional
25% down · 7.5% · 30yr
- Down + closing
- —
- Monthly P&I
- —
- Monthly cashflow
- —
- DSCR
- —
- Eligible?
- —
Personal DTI + credit; lowest rate.
DSCR
20% down · 8.5% · 30yr
- Down + closing
- —
- Monthly P&I
- —
- Monthly cashflow
- —
- DSCR
- —
- Eligible?
- —
No personal income docs; deal must DSCR.
Hard money
10% down · 12.0% · 12mo
- Down + closing
- —
- Monthly P&I
- —
- Monthly cashflow
- —
- DSCR
- —
- Eligible?
- —
Short-term bridge; refi at stabilization.
Rent comps 6 comps
| Address | Beds | Baths | Sqft | Rent | $/sqft | DOM | Units | Dist |
|---|---|---|---|---|---|---|---|---|
| 15405 Green Acres Ave #2331 Punta Gorda, FL | 3.0 | 2.0 | 1301 | $5,500 | $4.23 | 21d | 1 | 1.32mi |
| 44458 Diamond Trl Punta Gorda, FL | 3.0 | 2.0 | 1484 | $2,500 | $1.68 | 21d | 1 | 1.39mi |
| 15194 Bluffton Ln #1422 Punta Gorda, FL | 3.0 | 2.0 | 2110 | $6,300 | $2.99 | 13d | 1 | 1.45mi |
| 15375 Green Acres Ave #2211 Punta Gorda, FL | 3.0 | 2.0 | 1301 | $2,295 | $1.76 | 21d | 1 | 1.46mi |
| 15345 Green Acres Ave #2111 Punta Gorda, FL | 3.0 | 2.0 | 1301 | $4,795 | $3.69 | 21d | 1 | 1.47mi |
| 15170 Bluffton Ln Unit 1821 Punta Gorda, FL | 3.0 | 2.0 | 2110 | $6,500 | $3.08 | 13d | 1 | 1.50mi |
HOA detail
- Monthly dues
- $430 · $5,160/yr
Listing history 18 events
-
2026-06-18days on market $340,298 Active 45 DOM
-
2026-06-17days on market $340,298 Active 44 DOM
-
2026-06-16days on market $340,298 Active 43 DOM
-
2026-06-15days on market $340,298 Active 42 DOM
-
2026-06-14days on market $340,298 Active 40 DOM
-
2026-06-13days on market $340,298 Active 39 DOM
-
2026-06-10days on market $340,298 Active 37 DOM
-
2026-06-09pricedays on market $340,298 Active 36 DOM
-
2026-06-08days on market $346,298 Active 35 DOM
-
2026-06-07days on market $346,298 Active 34 DOM
-
2026-06-05days on market $346,298 Active 31 DOM
-
2026-06-03days on market $346,298 Active 30 DOM
-
2026-06-02days on market $346,298 Active 29 DOM
-
2026-06-01days on market $346,298 Active 28 DOM
-
2026-05-31days on market $346,298 Active 27 DOM
-
2026-05-30days on market $346,298 Active 26 DOM
-
2026-05-04$346,298 Active
-
2026-03-17$346,298 Active 423-char remark
Show marketing remark (423 chars)
This expansive two-story home boasts a well-designed layout, featuring a first floor dedicated to shared living and entertaining. The open-concept design seamlessly connects the kitchen, dining room and family room, with a covered lanai extending the interior space outdoors. Upstairs, a spacious loft separates the three secondary bedrooms from the serene owner's suite. Completing the home is a convenient two-car garage.
ⓘ Source: listings_history table (triggers on properties + properties_extension) + one-shot
backfill from property_details.listing_events for pre-trigger history.
Nearby sold comps map
Loading sold comps map…
Walkable amenities ~0.75 mi
Loading nearby amenities…
Taxation est. · year 1
- Rental income
- $52,740
- − Mortgage interest
- −$19,062
- − Property taxes
- −$5,104
- − Insurance
- −$1,701
- − Repairs & maintenance
- −$4,219
- − Management
- −$4,219
- − HOA
- −$5,160
- − Depreciation
- −$9,900
- Taxable income
- $3,374
- Est. tax owed @ 24.0%
- −$810
- After-tax cash flow
- $7,474/yr
For passive investors: Depreciation is non-cash, so a rental often shows a tax loss while cash-flowing — sheltering income. Rental losses are passive: they offset passive income freely, and up to $25,000/yr can offset ordinary (W-2) income if you actively participate and your MAGI is under $100k (phasing out to $0 by $150k); unused losses carry forward. On sale, claimed depreciation is recaptured at up to 25%, and gains may owe capital-gains tax (a 1031 exchange can defer both). Figures are a year-1 estimate at your 24.0% rate — not tax advice; consult a CPA.
Condition & rehab AI · 12 photos
This home is in good condition with a modern kitchen and well-maintained exterior. It has potential for further value increases through minor exterior updates and landscaping improvements.
Value-add opportunities
- Both Painting the exterior siding — Fresh paint can enhance curb appeal and property value.
- Both Landscaping improvements — A well-maintained yard can increase both resale and rental value.
- Both Adding smart home features — Smart home features can increase both resale and rental value by making the home more modern and convenient.
Renovation cost estimate screening
Value-add ROI direction
- Both Painting the exterior siding — Fresh paint can enhance curb appeal and property value. ↑
- Both Landscaping improvements — A well-maintained yard can increase both resale and rental value. ↑
- Both Adding smart home features — Smart home features can increase both resale and rental value by making the home more modern and convenient. ↑
ⓘ Cost ranges are severity-bucket heuristics (US national rule-of-thumb). Get contractor quotes + a written scope before underwriting a rehab budget.
Schools (NCES district)
- District
- Charlotte
- NCES district ID
- 1200240
- Math proficiency
- 54% ▼ -6.00%
- Reading proficiency
- 54% ▼ -1.00%
- Median HH income
- $44,864
- Composite
- 45.62/100
- National rank
- #2586
- State rank
- #22 of 73 in FL
Livability — Alva
- Score
- 68/100
- State rank
- #514
- US rank
- #9471
Category grades
Schools grade is shown separately in the Schools card above.
Census & demographics
- County
- Charlotte County · 196,994 people
- Metro
- Punta Gorda, FL
- Population (ZIP)
- 13,006
- Household income
- $72,443
- Rent vs Own
- Severe rent burden
- 43.0
Population outlook (Charlotte County) Hauer SSP2
- Today (2025)
- 198,646 people
- By 2030
- 210,507 · +6.0%
- By 2040
- 230,857 · +16.2%
- By 2050
- 247,148 · +24.4%
- By 2075
- 281,777 · +41.8%
- By 2100
- 293,609 · +47.8%
Race, ethnicity, and origin ACS 2023
- Neighborhood character
- Predominantly White (81%)
- Race & ethnicity
- White 81% Two or more races 8% Hispanic / Latino 7% Black 7%
- Hispanic origin (detail)
- Puerto Rican 2% Cuban 3%
- Common ancestry
- Lithuanian 3% Iranian 3% Slovak 3%
- Foreign-born
- 6% · Canada, Jamaica
- Languages at home
- 93% English-only · Spanish 5% German/W. Germanic 1% Arabic 1%
Political lean MEDSL · Charlotte
- 2024 margin
- Solid R (+34.0) · D 32.7% · R 66.7%
- 2008→2024 swing
- -26.7pp toward R · 2008: -7.2pp · 2024: -34.0pp
- All cycles
- 2024: R+34.0 2020: R+26.6 2016: R+27.8 2012: R+14.3 2008: R+7.2
Not yet ingested
- Civics
- —
Market trends
- HPI YoY
- ▼ -5.25%
- Current HPI
- 448.5895
- Rent YoY
- ▲ 4.13%
- Metro
- Punta Gorda, FL
- State GDP YoY
- ▲ 3.28%
- F500 in state
- 36
Industry mix (Fortune 500 HQ in FL)
| Industry | F500 HQs | Revenue |
|---|---|---|
| Industrial Technology | 2 | $29B |
|
||
| Insurance | 2 | $17B |
|
||
| Retail | 1 | $60B |
|
||
| Technology Distribution | 1 | $58B |
|
||
| Homebuilding | 1 | $35B |
|
||
| Technology Manufacturing | 1 | $35B |
|
||
Price history
+0.0% since first listed2 events — show timeline
- 2026-05-04 Listed $346,298 NAPLESMLS
- 2026-03-17 Listed $346,298 Zillow
Cash-flow waterfall
monthlySold comps — $/sqft
last 12 mo · ≤1 miLoading sold comps…