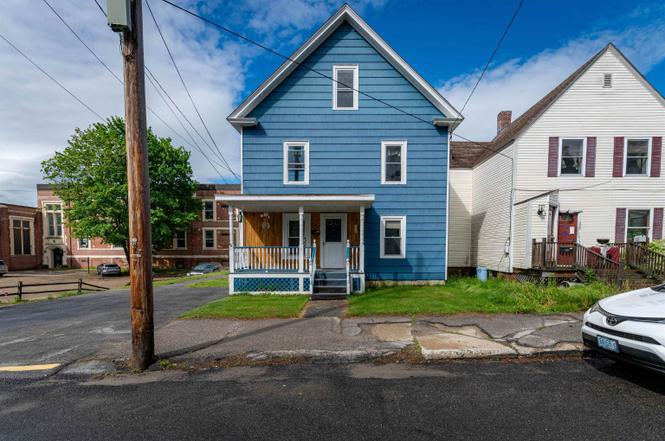
249 High St · Berlin, NH
Flood risk 1/10 · Minimal
- FEMA flood zone
- X (unshaded)
- Chance of flooding over 30 yrs
- 0.0%
- Est. flood insurance / yr
- $507 – $1,088
Fire risk 1/10 · Minimal
- Est. fire insurance / yr
- $507 – $941
Heat risk 2/10 · Minimal
- Hot days now (above 85°F)
- 8 days/yr
- Hot days in 30 yrs
- 18 days/yr
Wind risk 3/10 · Minor
- Chance of severe wind over 30 yrs
- 5.0%
Air-quality risk 2/10 · Minimal
- Unhealthy air days now
- 1 days/yr
- Unhealthy air days in 30 yrs
- 1 days/yr
Risk factors via First Street. Map © Google.
Why this score? — see what drove the A- grade
The composite is a weighted blend of 9 inputs, each scored 0–100. Each bar is that input's sub-score; the figure is the points it added to the 100-point composite (weight × sub-score).
- Cash flow +28.8/30.0
- ARV discount +15.0/15.0
- DSCR +10.0/10.0
- Appreciation +10.0/10.0
- 1% rule +9.2/10.0
- Livability +3.3/5.0
- Rent growth +2.5/5.0
- Condition / age +2.5/5.0
- Schools +2.2/10.0
$130,000
🖨 Deal sheet (PDF) 📄 Offer letter ✓ Due diligence
Listing remarks MLS
8095 RECENTLY REFURBISHED, REALLY NICE INSIDE, AMTROL WATER SYSTEM. THIS IS A MUST SEE PROPERTY. A LOT OF VALUE HERE FOR THE MONEY
Key facts
- Enclosed side porch
- Small front porch
- 2nd floor deck
Tags
Property features AI
Finance
- Other: Documents available: Deed, Property Disclosure, Tax Map
Exterior
- Parking: Paved driveway; One off-street parking spot and on-street parking
- Utilities: Public water; Public sewer; 200 amp electric service with circuit breakers (Eversource); Oil supplied by Irving; High-speed internet available; Cable and telephone available
- Home design: Multi-level New Englander style; Existing construction; Built in 1891
- Construction: Wood frame construction; Asbestos exterior; Asphalt shingle roof; Year built 1891
- Exterior features: City lot with sidewalks, in-town location; Near snowmobile trails and schools; Paved driveway; Street parking available; one off-street parking spot (per directions)
Interior
- Kitchen: Electric range; Microwave; Refrigerator
- Bedrooms: Master bedroom on 2nd level (approx. 12 x 19); Bedroom on 1st level (approx. 12 x 11); Bedroom on 2nd level (approx. 13 x 9)
- Flooring: Carpet; Softwood floors
- Bathrooms: Two full bathrooms (one on 1st level, one on 2nd level)
- Heating & cooling: Oil heat with baseboard and hot water systems; Cooling listed as other
- Interior features: Seven total rooms; Unfinished basement with storage space, concrete floor, bulkhead, interior and exterior stairs, and interior access; Den on second level
- Laundry & utility: Washer and dryer; Water heater
Neighborhood map
What this means for you Summary
Snapshot
- This is a 3-bed/2.0-bath single-family listed at $130k.
Deal economics
- At list price, monthly cash flow is $438 ($5k/yr) — positive.
- The deal already cash-flows at list — no discount required.
- Meets the 1% rule at list price ($2k rent vs $130k).
- Cap rate 10.3% vs local median 7.1% in Berlin — top-decile yield for the area; either an underpriced asset or a hidden risk that comps aren't pricing in. Stress-test before assuming the spread holds.
Location & tenants
- Location reads 66/100 on livability (#67 in NH) — a middle-class / working-renter tenant base. Strengths: cost of living A+, crime A-, housing A-; Watch: amenities F, commute F, employment F.
- Berlin School District (town): math 24% / reading 30% proficiency, ranked #91 of 98 in NH (top 93%) — low school quality limits family demand, transient renter base, plan for 1-2y turnover.
- Zoned schools: Berlin Elementary School (math 35% / reading 33%, grade F, #188 of 263 statewide, top 71%, 422 students, 62% FRL).
- Market conditions: 102 active listings in the ZIP; 95 units permitted in Coos County in 2024 (0 in 5+ unit buildings).
Forward outlook
- In year one you build about $14k of equity ($899 loan paydown + $13k appreciation (10.0% local appreciation)).
- Coos County population projected at -19% by 2050 — secular population decline; favor cash flow + early exit over multi-decade hold.
- At projected returns (10.0% appreciation + 3.0% rent growth), your $36k cash investment doubles in ~2 years — after that, you're playing with house money.
- By year 3, paydown + projected appreciation supports a ~$35k cash-out refi (75% LTV) — recoverable capital for the next deal without selling this one.
Negotiation context
- Only 2 days on market — expect competitive offers; lowballing is unlikely to land.
- 3 sale attempts since 25y ago with the ask held roughly flat each time — persistent listings suggest the price (not the market) is what's stuck; bring a comps-based counter.
- Current owner paid $55k; list at $130k implies a 136% gain — meaningful room to come down on a strong offer.
Risks & watch-outs
- Watch-outs: property tax is 2.6% of price; built in 1891 — expect roof / HVAC / electrical / plumbing capex.
Questions for the listing agent
- Built in 1891 — when were the roof, HVAC, electrical panel, plumbing, and water heater last replaced?
- Property tax is high relative to price — has the assessment been appealed recently, and will the sale trigger a re-assessment?
- Is there a deadline driving the sale (1031 exchange, divorce, estate, relocation)? That informs how much negotiation room exists.
- Schools are D-rated, which usually means shorter tenancies and higher turnover. Who's the typical renter profile here, and what's been the actual vacancy rate?
- What's the average days-on-market for RENTAL listings here right now (not sales)? A rising rental-DOM trend means longer vacancies and softer asking-rent achievability than the comps imply.
- What's the recent tenant-quality profile in this submarket — average credit score on applications, eviction rate, late-payment / NSF rate, and stable-employment percentage? A property-management company in the area should have these aggregated.
- How much new for-sale + rental construction is in the pipeline within 1–3 miles? Heavy new supply typically softens prices + rents 12–24 months out; constrained supply supports both.
Investment metrics
- 1% rule
- 1.42% ✓
- Cap rate
- 10.34%
- Cash-on-cash
- 14.45%
- DSCR
- 1.64
- GRM
- 5.9
CMA / ARV
- ARV (on-the-fly)
- $202,392
- Comps found
- 12
Show comp detail 12 sales within ~0.75 mi
| Address | Dist | Beds/Ba | Sqft | Sold | Price | $/sf | Match |
|---|---|---|---|---|---|---|---|
| 216 Prospect St | 0.13mi | 3/1.0 | 1,728 (-8%) | 2mo | $234,900 | $136 | 76 |
| 210 Willow St | 0.22mi | 3/2.0 | 1,977 (+6%) | 7mo | $325,000 | $164 | 74 |
| 242 Willard St | 0.08mi | 3/1.5 | 1,664 (-11%) | 9mo | $170,000 | $102 | 68 |
| 263 School St | 0.24mi | 3/2.0 | 1,649 (-12%) | 2mo | $235,000 | $143 | 67 |
| 199 Park St | 0.08mi | 4/2.0 (+1) | 1,616 (-14%) | 5mo | $175,000 | $108 | 64 |
| 418 High St | 0.26mi | 3/1.0 | 1,730 (-8%) | 10mo | $151,000 | $87 | 63 |
| 485 Madison Ave | 0.44mi | 3/1.0 | 1,997 (+7%) | 9mo | $275,000 | $138 | 57 |
| 79 Mount Forist St | 0.63mi | 4/2.0 (+1) | 1,873 (-0%) | 11mo | $109,900 | $59 | 56 |
| 386 High St | 0.22mi | 4/1.5 (+1) | 1,670 (-11%) | 12mo | $170,000 | $102 | 55 |
| 502 1St Ave | 0.74mi | 3/1.5 | 1,966 (+5%) | 7mo | $180,000 | $92 | 49 |
| 41 Whittemore Ave | 0.55mi | 3/1.5 | 2,132 (+14%) | 10mo | $150,000 | $70 | 42 |
| 624 Second Ave | 0.62mi | 4/1.5 (+1) | 1,623 (-13%) | 9mo | $243,900 | $150 | 34 |
Match score weights: distance 35% · size 25% · config 20% · recency 20%. Top-matched comps best support the ARV.
Projected returns pro-forma
10.0% appreciation · 3.0% rent growth · sell at horizon
- IRR
- 35.0%
- Equity multiple
- 3.71×
- Total profit
- $98,825
- Equity at exit
- $117,114
- IRR
- 30.1%
- Equity multiple
- 8.40×
- Total profit
- $269,261
- Equity at exit
- $252,561
Cash invested: $36,400 (down + closing). Projections, not guarantees.
Landlord ↔ Tenant lean methodology
- Overall (STATE)
- 56 Moderately Landlord-Leaning
- State New Hampshire
- 56 Moderately Landlord-Leaning · D+1
- County
- — inherits STATE
- City
- — inherits STATE
ZIP-level market 03570
- Home prices YoY
- 14.3%
- Active inventory
- 102
- Price-to-rent
- 5.9×
Monthly cashflow live
- Estimated rent
- $1,840 medium interval (Pro) →
- Mortgage (P&I)
- −$682
- Tax from tax record
- −$279 /mo · $3,350/yr
- Insurance
- −$54
- HOA
- −$0
- Vacancy / Maint / Mgmt
- −$386
- Net cashflow
- $438
Break-even live
Sensitivity live
| Price | -10% $512 | -5% $475 | +0% $438 | +5% $402 | +10% $365 |
|---|---|---|---|---|---|
| Rent | -10% $293 | -5% $366 | +0% $438 | +5% $511 | +10% $584 |
| Rate | -1.0pp $504 | -0.5pp $471 | base $438 | +0.5pp $405 | +1.0pp $370 |
UW: 25.0% down · 7.5% · 30yr · 1.5% tax · 5.0% vac · 8.0% maint · 8.0% mgmt
Financing live
Cash to close
- Down payment
- $32,500
- Closing costs
- $3,900
- Reserves months
- —
- Total cash needed
- —
Loan-product check · same deal, 3 products live
Conventional
25% down · 7.5% · 30yr
- Down + closing
- —
- Monthly P&I
- —
- Monthly cashflow
- —
- DSCR
- —
- Eligible?
- —
Personal DTI + credit; lowest rate.
DSCR
20% down · 8.5% · 30yr
- Down + closing
- —
- Monthly P&I
- —
- Monthly cashflow
- —
- DSCR
- —
- Eligible?
- —
No personal income docs; deal must DSCR.
Hard money
10% down · 12.0% · 12mo
- Down + closing
- —
- Monthly P&I
- —
- Monthly cashflow
- —
- DSCR
- —
- Eligible?
- —
Short-term bridge; refi at stabilization.
Listing history 3 events
-
2026-06-21days on market $130,000 Active 2 DOM
-
2026-06-18remarks 699-char remark
-
2026-06-18$130,000 Active 1 DOM
ⓘ Source: listings_history table (triggers on properties + properties_extension) + one-shot
backfill from property_details.listing_events for pre-trigger history.
Tax reassessment forecast NH · Partial reset (capped growth)
- Current annual tax
- $3,350 · $279/mo
- Projected year-2 tax
- $3,350 · $279/mo
- Expected delta
- $0/yr ($0/mo · 0.0%)
ⓘ Screening estimate from a state-policy table — verify with the county assessor before closing.
Climate risk First Street
- Flood 1/10 Low FEMA zone X (unshaded) · 0% chance over 30 yrs
- Wildfire 1/10 Low
- Heat 2/10 Low 8 d/yr ≥85°F today · 18 d/yr by 30 yrs out
- Wind 3/10 Moderate 5% chance of damaging wind over 30 yrs
- Air quality 2/10 Low 1 unhealthy d/yr today · 1 by 30 yrs out
Nearby sold comps map
Loading sold comps map…
Walkable amenities ~0.75 mi
Loading nearby amenities…
Taxation est. · year 1
- Rental income
- $22,078
- − Mortgage interest
- −$7,282
- − Property taxes
- −$3,350
- − Insurance
- −$650
- − Repairs & maintenance
- −$1,766
- − Management
- −$1,766
- − Depreciation
- −$3,782
- Taxable income
- $3,482
- Est. tax owed @ 24.0%
- −$836
- After-tax cash flow
- $4,425/yr
For passive investors: Depreciation is non-cash, so a rental often shows a tax loss while cash-flowing — sheltering income. Rental losses are passive: they offset passive income freely, and up to $25,000/yr can offset ordinary (W-2) income if you actively participate and your MAGI is under $100k (phasing out to $0 by $150k); unused losses carry forward. On sale, claimed depreciation is recaptured at up to 25%, and gains may owe capital-gains tax (a 1031 exchange can defer both). Figures are a year-1 estimate at your 24.0% rate — not tax advice; consult a CPA.
Schools (NCES district)
- District
- Berlin School District
- NCES district ID
- 3301860
- Math proficiency
- 24% ▼ -5.00%
- Reading proficiency
- 30% ▼ -12.00%
- Median HH income
- $37,494
- Composite
- 22.5/100
- National rank
- #8095
- State rank
- #91 of 98 in NH
Livability — Berlin
- Score
- 66/100
- State rank
- #67
- US rank
- #11665
Category grades
Schools grade is shown separately in the Schools card above.
Census & demographics
- Census place
- Berlin, NH
- City population
- 9,473
- Population (ZIP)
- 9,473
Population outlook (Coos County) Hauer SSP2
- Today (2025)
- 30,912 people
- By 2030
- 29,872 · -3.4%
- By 2040
- 27,449 · -11.2%
- By 2050
- 25,049 · -19.0%
- By 2075
- 19,584 · -36.6%
- By 2100
- 13,818 · -55.3%
Race, ethnicity, and origin ACS 2023
- Neighborhood character
- Predominantly White (86%)
- Race & ethnicity
- White 86% Hispanic / Latino 5% Black 4% Two or more races 4%
- Hispanic origin (detail)
- Common ancestry
- Lithuanian 21% German 2% Romanian 2%
- Foreign-born
- 3% · Canada, Jamaica
- Languages at home
- 88% English-only · French/Haitian/Cajun 8% Spanish 4%
Political lean MEDSL · Coos
- 2024 margin
- R (+13.8) · D 42.7% · R 56.5%
- 2008→2024 swing
- -32.1pp toward R · 2008: 18.3pp · 2024: -13.8pp
- All cycles
- 2024: R+13.8 2020: R+5.9 2016: R+9.1 2012: D+17.6 2008: D+18.3
Not yet ingested
- Civics
- —
Market trends
- HPI YoY
- ▲ 55.16%
- Current HPI
- 440.9127
- Rent YoY
- —
- Metro
- —
- State GDP YoY
- —
- F500 in state
- 0
Price history
+136.8% since first listed6 events — show timeline
- 2026-06-18 Listed $130,000 PrimeMLS
- 2003-03-21 Sold (MLS) $55,000 PrimeMLS
- 2003-02-12 Listed $55,000 PrimeMLS
- 2002-03-15 Sold (MLS) $49,900 PrimeMLS
- 2002-03-14 Sold (Public Records) $49,900 Public Records
- 2001-07-10 Listed $54,900 PrimeMLS
Property tax history
+4.0%/yrLatest (2025): $3,350 · +8.8% YoY. Source: county tax records.
Cash-flow waterfall
monthlySold comps — $/sqft
last 12 mo · ≤1 miLoading sold comps…