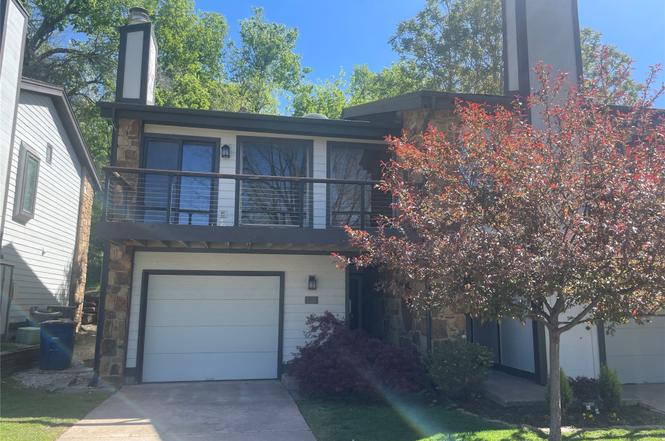
1531 Riverside Dr #1531 · Tulsa, OK
Flood risk 1/10 · Minimal
- FEMA flood zone
- X (shaded)
- Chance of flooding over 30 yrs
- 0.0%
- Est. flood insurance / yr
- $473 – $860
Fire risk 1/10 · Minimal
- Est. fire insurance / yr
- $2,463 – $4,575
Heat risk 6/10 · Moderate
- Hot days now (above 110°F)
- 7 days/yr
- Hot days in 30 yrs
- 17 days/yr
Wind risk 3/10 · Minor
- Chance of severe wind over 30 yrs
- 5.0%
Air-quality risk 3/10 · Minor
- Unhealthy air days now
- 2 days/yr
- Unhealthy air days in 30 yrs
- 3 days/yr
Risk factors via First Street. Map © Google.
Why this score? — see what drove the D+ grade
The composite is a weighted blend of 9 inputs, each scored 0–100. Each bar is that input's sub-score; the figure is the points it added to the 100-point composite (weight × sub-score).
- Cash flow +11.7/30.0
- 1% rule +9.0/10.0
- Appreciation +8.4/10.0
- ARV discount +7.5/15.0
- Livability +3.8/5.0
- DSCR +3.4/10.0
- Condition / age +2.5/5.0
- Rent growth +2.4/5.0
- Schools +0.8/10.0
$118,000
🖨 Deal sheet 📄 Offer letter ✓ Due diligence
Listing remarks
Location, location, location! Condo with stunning views of the Arkansas River! This condo also offers unbeatable access to some of Tulsa's best outdoor amenities. Enjoy being steps away from river parks, and scenic trails, walking distance to the Gathering Place, with downtown Tulsa only minutes away. This condo has sustained fire damage, will be a complete rehab, and is being sold as is, making it an ideal opportunity to design a space that's truly your own in one of the city's most sought-after areas.
Key facts
- Complete rehab
- Unbeatable access
- $500 HOA
Tags
Property features AI
Finance
- Other: Pets allowed
- HOA & community: Homeowners association with a $500 monthly fee; HOA fee includes structure maintenance
Exterior
- Parking: Attached garage (1 car)
- Security: No safety shelter
- Utilities: Public water; Public sewer
- Home design: 2 stories; Faces west; Slab foundation
- Construction: HardiPlank type siding; Wood frame construction
- Exterior features: Concrete driveway; Balcony; Deck; Patio; Mature trees; Less than 1 mile to the Arkansas River
Interior
- Kitchen: Kitchen (second level)
- Bedrooms: Master bedroom (second level); Additional bedroom (first level)
- Bathrooms: 2 full bathrooms
- Interior features: Vaulted ceilings; Aluminum window frames; Skylights; One fireplace
- Laundry & utility: Utility room (inside, first level); Gas water heater
Neighborhood map
What this means for you Summary
Snapshot
- This is a 2-bed/2.0-bath condo listed at $118k.
Deal economics
- At list price, monthly cash flow is $-35 ($-417/yr) — negative.
- To cash-flow at today's rent, offer at most $112k (5.2% below list).
- Meets the 1% rule at list price ($2k rent vs $118k).
- Recommended offer: $104k (12.0% below list) — sets the bar for market timing.
- Cap rate 5.9% vs local median 3.9% in Tulsa — top-decile yield for the area; either an underpriced asset or a hidden risk that comps aren't pricing in. Stress-test before assuming the spread holds.
Location & tenants
- Location reads 75/100 on livability (#13 in OK, #4,058 nationally) — a middle-class / working-renter tenant base. Strengths: amenities A+, commute A+, cost of living A+; Watch: schools F, crime F, employment D-.
- Tulsa (urban): math 7% / reading 12% proficiency, ranked #250 of 270 in OK (top 93%) — low school quality limits family demand, transient renter base, plan for 1-2y turnover; 76% free/reduced lunch — lower-income household profile, screen leases tightly.
- Market conditions: Rents soft (-0.3%/yr); 59 active listings in the ZIP; 40 comparable units currently listed for rent nearby; rentals at typical pace (median 16d on market — plan ~3-4 weeks tenant-placement turnaround); 2,818 units permitted in Tulsa County in 2024 (518 in 5+ unit buildings).
Forward outlook
- In year one you build about $9k of equity ($816 loan paydown + $8k appreciation (6.9% local appreciation)).
- Tulsa County population projected at +30% by 2050 — long-run rental-demand tailwind backs the buy-and-hold thesis.
- At projected returns (6.9% appreciation + 0.0% rent growth), your $33k cash investment doubles in ~4 years — after that, you're playing with house money.
- By year 4, paydown + projected appreciation supports a ~$31k cash-out refi (75% LTV) — recoverable capital for the next deal without selling this one.
Negotiation context
- It's been on market 232 days — a 12% lower offer ($104k) is reasonable based on typical stale-listing flexibility.
- 4 sale attempts since 32y ago; this cycle's ask has dropped $42k (26%) from the opening price — seller is motivated, your offer sets the floor, not the list.
- Current owner paid $84k; 40% above their basis — modest negotiation headroom, anchor on the comps not their cost.
Risks & watch-outs
- Watch-outs: HOA is 30% of rent.
- Climate carrying-cost: extreme-heat days projected 7→17/yr by 2055 (HVAC capex compounding) — expect insurance premiums to compound above CPI over the hold.
Questions for the listing agent
- What do current leases actually rent for vs. the listed asking? Can we see a recent rent roll and the last 12 months of T-12 income?
- It's been on market 232 days. Have you received any prior offers? Is the seller open to a 12% concession, seller financing, or rate buy-down credit?
- What does the HOA fee cover, when was the last increase, and are there any pending special assessments or reserve-fund shortfalls?
- Any open or pending special assessments — roof, HVAC, plumbing, elevator, façade? What's the per-unit balance and payoff schedule, and is the seller paying it off at close or rolling it to the buyer?
- Why hasn't it sold? Are there any deal-killer items the seller is aware of (foundation, flood, title, zoning, code violations)?
- Is there a deadline driving the sale (1031 exchange, divorce, estate, relocation)? That informs how much negotiation room exists.
- Schools are F-rated, which usually means shorter tenancies and higher turnover. Who's the typical renter profile here, and what's been the actual vacancy rate?
- Crime grade is F in this area — have there been break-ins, vandalism, or insurance claims at this property in the last 3 years? What carrier currently insures it and at what premium?
- The area grade is low — what's the realistic commute time and amenity access for the typical tenant pool here? Any planned neighborhood developments (good or bad) we should know about?
- What's the average days-on-market for RENTAL listings here right now (not sales)? A rising rental-DOM trend means longer vacancies and softer asking-rent achievability than the comps imply.
- What's the recent tenant-quality profile in this submarket — average credit score on applications, eviction rate, late-payment / NSF rate, and stable-employment percentage? A property-management company in the area should have these aggregated.
- How much new apartment / multifamily construction is in the pipeline within 1–3 miles? Heavy new supply (>2% of stock underway) typically softens rents 12–24 months out; light construction supports rent growth.
Investment metrics
- 1% rule
- 1.40% ✓
- Cap rate
- 5.94%
- Cash-on-cash
- -1.26%
- DSCR
- 0.94
- GRM
- 6.0
CMA / ARV
No comps found within radius.
Projected returns pro-forma
6.88% appreciation · 0.0% rent growth · sell at horizon
- IRR
- 14.7%
- Equity multiple
- 2.02×
- Total profit
- $33,637
- Equity at exit
- $80,841
- IRR
- 13.4%
- Equity multiple
- 3.77×
- Total profit
- $91,393
- Equity at exit
- $152,727
Cash invested: $33,040 (down + closing). Projections, not guarantees.
Landlord ↔ Tenant lean methodology
- Overall (STATE)
- 83 Strongly Landlord-Friendly
- State Oklahoma
- 83 Strongly Landlord-Friendly · R+20
- County
- — inherits STATE
- City
- — inherits STATE
ZIP-level market 74119
- Home prices YoY
- 2.7%
- Rents YoY
- -0.3%
- Active inventory
- 59
- Price-to-rent
- 6.0×
Monthly cashflow live
- Estimated rent
- $1,647 high interval (Pro) →
- Mortgage (P&I)
- −$619
- Tax from tax record
- −$168 /mo · $2,012/yr
- Insurance
- −$49
- HOA
- −$500
- Vacancy / Maint / Mgmt
- −$346
- Net cashflow
- $-35
Break-even live
UW: 25.0% down · 7.5% · 30yr · 1.5% tax · 5.0% vac · 8.0% maint · 8.0% mgmt
Financing live
Cash to close
- Down payment
- $29,500
- Closing costs
- $3,540
- Reserves months
- —
- Total cash needed
- —
Loan-product check · same deal, 3 products live
Conventional
25% down · 7.5% · 30yr
- Down + closing
- —
- Monthly P&I
- —
- Monthly cashflow
- —
- DSCR
- —
- Eligible?
- —
Personal DTI + credit; lowest rate.
DSCR
20% down · 8.5% · 30yr
- Down + closing
- —
- Monthly P&I
- —
- Monthly cashflow
- —
- DSCR
- —
- Eligible?
- —
No personal income docs; deal must DSCR.
Hard money
10% down · 12.0% · 12mo
- Down + closing
- —
- Monthly P&I
- —
- Monthly cashflow
- —
- DSCR
- —
- Eligible?
- —
Short-term bridge; refi at stabilization.
Rent comps 40 comps
| Address | Beds | Baths | Sqft | Rent | $/sqft | DOM | Units | Dist |
|---|---|---|---|---|---|---|---|---|
| 1620 S Elwood Ave Tulsa, OK | 1.0 | 1.0 | 750 | $1,025 | $1.37 | 10d | 1 | 0.13mi |
| 1401 S Elwood Ave Tulsa, OK | 3.0 | 1.0 | 1373 | $1,850 | $1.35 | 24d | 1 | 0.22mi |
| 1717 Riverside Dr Tulsa, OK | 2.0 | 1.0–2.0 | 910 | $2,201 | $2.42 | 2d | 22 | 0.30mi |
| 1515 S Carson Ave Tulsa, OK | 2.0 | 1.5 | 1100 | $2,200 | $2.00 | 24d | 1 | 0.31mi |
| 1309 S Jackson Ave Tulsa, OK | 2.0 | 1.0 | 775 | $1,050 | $1.35 | 2d | 1 | 0.34mi |
| 7125 N 220th RD Tulsa, OK | 2.0 | 1.0–2.0 | 750 | $2,800 | $3.73 | 10d | 37 | 0.35mi |
| 1312 S Jackson Ave Unit 3 Tulsa, OK | 2.0 | 1.0 | 775 | $1,050 | $1.35 | 14d | 1 | 0.37mi |
| 1816 S Carson Ave Tulsa, OK | 1.0–2.0 | 1.0–2.0 | 702 | $1,400 | $1.99 | 2d | 13 | 0.39mi |
| 1303 S Lawton Ave Tulsa, OK | 2.0 | 2.0 | 1250 | $1,575 | $1.26 | 3d | 1 | 0.41mi |
| 1703 S Jackson Ave Tulsa, OK | 1.0–2.0 | 1.0–2.0 | 745 | $1,409 | $1.89 | 24d | 28 | 0.42mi |
| 1703 S Jackson Ave Tulsa, OK | 1.0–2.0 | 1.0–2.0 | 745 | $1,375 | $1.84 | 16d | 1 | 0.42mi |
| 1000 S Denver Ave Tulsa, OK | 1.0–2.0 | 1.0–2.0 | 940 | $1,546 | $1.64 | 2d | 19 | 0.50mi |
| 1817 S Baltimore Ave Unit 4 Tulsa, OK | 2.0 | 1.0 | 750 | $1,050 | $1.40 | 24d | 1 | 0.62mi |
| 975 W 22nd Pl Tulsa, OK | 1.0–3.0 | 1.0–2.5 | 1125 | $1,292 | $1.15 | 2d | 1 | 0.73mi |
| 120 E 21st St Tulsa, OK | 1.0 | 1.5 | 1024 | $1,700 | $1.66 | 24d | 1 | 0.79mi |
| 403 S Cheyenne Ave Tulsa, OK | 2.0 | 1.0–2.0 | 750 | $1,799 | $2.40 | 2d | 8 | 0.82mi |
| 406 S Boulder Ave Tulsa, OK | 1.0–2.0 | 1.0–2.0 | 1082 | $2,906 | $2.69 | 16d | 3 | 0.84mi |
| 420 S Main St Tulsa, OK | 2.0 | 1.0–2.0 | 1291 | $2,700 | $2.09 | 2d | 13 | 0.85mi |
| 522 S Boston Ave Tulsa, OK | 1.0 | 1.0 | 755 | $1,274 | $1.69 | 3d | 6 | 0.86mi |
| 6 E 5th St Unit 703 Tulsa, OK | 2.0 | 2.0 | 962 | $1,731 | $1.80 | 21d | 1 | 0.87mi |
| 6 E 5th St Unit 105 Tulsa, OK | 2.0 | 2.0 | 1361 | $2,450 | $1.80 | 21d | 1 | 0.87mi |
| 6 E 5th St Unit 1001 Tulsa, OK | 1.0 | 1.0 | 845 | $2,500 | $2.96 | 21d | 1 | 0.87mi |
| 6 E 5th St Unit 501 Tulsa, OK | 1.0 | 1.0 | 958 | $1,725 | $1.80 | 21d | 1 | 0.87mi |
| 6 E 5th St Tulsa, OK | 1.0–2.0 | 1.0–2.0 | 1103 | $2,500 | $2.27 | 16d | 4 | 0.87mi |
| 1214 S Elgin Ave Unit 9 Tulsa, OK | 1.0 | 1.0 | 1200 | $950 | $0.79 | 24d | 1 | 0.88mi |
| 1214 S Elgin Ave Unit 5 Tulsa, OK | 2.0 | 1.0 | 1200 | $1,450 | $1.21 | 24d | 1 | 0.88mi |
| 1214 S Elgin Ave Unit 10 Tulsa, OK | 1.0 | 1.0 | 1200 | $1,000 | $0.83 | 16d | 1 | 0.88mi |
| 324 S Main St Tulsa, OK | 1.0–2.0 | 1.0–2.0 | 757 | $1,807 | $2.39 | 2d | 6 | 0.91mi |
| 9 E 4th St Tulsa, OK | 3.0 | 1.0–2.0 | 894 | $2,044 | $2.29 | 2d | 5 | 0.93mi |
| 119 E 26th St Tulsa, OK | 3.0 | 2.0 | 1500 | $2,200 | $1.47 | 16d | 1 | 0.99mi |
| 401 S Elgin Ave Tulsa, OK | 1.0–2.0 | 1.0–2.0 | 770 | $1,499 | $1.95 | 24d | 3 | 1.12mi |
| 1435 S Peoria Ave Tulsa, OK | 1.0 | 1.0 | 1000 | $1,495 | $1.50 | 24d | 1 | 1.15mi |
| 1428 S Quaker Ave Tulsa, OK | 2.0 | 1.0 | 850 | $1,225 | $1.44 | 3d | 1 | 1.19mi |
| 1312 S Quaker Ave Apt 1 Tulsa, OK | 1.0 | 1.0 | 770 | $950 | $1.23 | 24d | 1 | 1.22mi |
| 310 E 1st St Tulsa, OK | 1.0–2.0 | 1.0–2.0 | 1226 | $2,870 | $2.34 | 2d | 4 | 1.22mi |
| 310 E 1st St Tulsa, OK | 1.0–2.0 | 1.0–2.0 | 1110 | $2,870 | $2.58 | 19d | 5 | 1.22mi |
| 1411 S Quaker Ave Tulsa, OK | 2.0 | 1.5–2.5 | 1200 | $2,049 | $1.71 | 14d | 2 | 1.23mi |
| 1309 E 21st St Tulsa, OK | 2.0 | 2.0 | 925 | $1,250 | $1.35 | 3d | 2 | 1.24mi |
| 415 E 2nd St S Tulsa, OK | 1.0–2.0 | 1.0–2.0 | 807 | $2,180 | $2.70 | 2d | 28 | 1.26mi |
| 211 S Greenwood Ave Tulsa, OK | 1.0–2.0 | 1.0–2.0 | 933 | $2,344 | $2.51 | 2d | 3 | 1.33mi |
HOA detail condo
- Monthly dues
- $500 · $6,000/yr
- Assessments
- None detected in remarks — confirm with the listing agent.
Listing history 23 events
-
2026-06-13statusdays on market $118,000 Pending 232 DOM
-
2026-06-10days on market $118,000 Active 229 DOM
-
2026-06-09days on market $118,000 Active 228 DOM
-
2026-06-08days on market $118,000 Active 227 DOM
-
2026-06-07days on market $118,000 Active 226 DOM
-
2026-06-05days on market $118,000 Active 223 DOM
-
2026-06-03days on market $118,000 Active 222 DOM
-
2026-06-02days on market $118,000 Active 221 DOM
-
2026-06-01days on market $118,000 Active 220 DOM
-
2026-05-31days on market $118,000 Active 219 DOM
-
2026-05-13price $118,000
-
2026-03-23status Active
-
2026-03-07status Pending
-
2026-01-07price $135,000
-
2025-11-05price $149,900
-
2025-10-08$159,900 Active
-
2025-09-18historical
-
2025-08-11price $169,900
-
2025-06-14price $179,900
-
2025-04-11$194,900 Active
-
2000-09-18soldstatus $84,000
-
1994-05-31soldstatus $65,000
-
1994-03-17$66,900
ⓘ Source: listings_history table (triggers on properties + properties_extension) + one-shot
backfill from property_details.listing_events for pre-trigger history.
Tax reassessment forecast OK · Resets to sale price
- Current annual tax
- $2,012 · $168/mo
- Projected year-2 tax
- $2,012 · $168/mo
- Expected delta
- $0/yr ($0/mo · -0.0%)
ⓘ Screening estimate from a state-policy table — verify with the county assessor before closing.
Climate risk First Street
- Flood 1/10 Low FEMA zone X (shaded) · 0% chance over 30 yrs
- Wildfire 1/10 Low
- Heat 6/10 Major 7 d/yr ≥110°F today · 17 d/yr by 30 yrs out
- Wind 3/10 Moderate 5% chance of damaging wind over 30 yrs
- Air quality 3/10 Moderate 2 unhealthy d/yr today · 3 by 30 yrs out
Nearby sold comps map
Loading sold comps map…
Walkable amenities ~0.75 mi
Loading nearby amenities…
Taxation est. · year 1
- Rental income
- $19,760
- − Mortgage interest
- −$6,610
- − Property taxes
- −$2,012
- − Insurance
- −$590
- − Repairs & maintenance
- −$1,581
- − Management
- −$1,581
- − HOA
- −$6,000
- − Depreciation
- −$3,433
- Taxable loss
- −$2,046
- Est. tax savings @ 24.0%
- +$491
- After-tax cash flow
- $74/yr
For passive investors: Depreciation is non-cash, so a rental often shows a tax loss while cash-flowing — sheltering income. Rental losses are passive: they offset passive income freely, and up to $25,000/yr can offset ordinary (W-2) income if you actively participate and your MAGI is under $100k (phasing out to $0 by $150k); unused losses carry forward. On sale, claimed depreciation is recaptured at up to 25%, and gains may owe capital-gains tax (a 1031 exchange can defer both). Figures are a year-1 estimate at your 24.0% rate — not tax advice; consult a CPA.
Schools (NCES district)
- District
- Tulsa
- NCES district ID
- 4030240
- Math proficiency
- 7% ▼ -9.00%
- Reading proficiency
- 12% ▼ -7.00%
- Median HH income
- $37,895
- Composite
- 8.04/100
- National rank
- #9919
- State rank
- #250 of 270 in OK
Livability — Tulsa
- Score
- 75/100
- State rank
- #13
- US rank
- #4058
Category grades
Schools grade is shown separately in the Schools card above.
Census & demographics
- Census place
- Tulsa, OK
- County
- Tulsa County · 640,811 people
- City population
- 389,418
- Metro
- Tulsa, OK
- Population (ZIP)
- 3,670
- Household income
- $56,234
- Rent vs Own
- Severe rent burden
- 337.0
Population outlook (Tulsa County) Hauer SSP2
- Today (2025)
- 723,846 people
- By 2030
- 766,033 · +5.8%
- By 2040
- 851,386 · +17.6%
- By 2050
- 938,389 · +29.6%
- By 2075
- 1,166,011 · +61.1%
- By 2100
- 1,350,277 · +86.5%
Race, ethnicity, and origin ACS 2023
- Neighborhood character
- Predominantly White (73%)
- Race & ethnicity
- White 73% Two or more races 12% Black 7% Hispanic / Latino 5% Asian 3% Native American 2%
- Hispanic origin (detail)
- Mexican 3%
- Common ancestry
- Slovak 3% Lithuanian 2% Serbian 2%
- Foreign-born
- 5% · Canada, China, South Korea
- Languages at home
- 95% English-only · Spanish 3% Other Asian/Pacific 1% Chinese 1%
Political lean MEDSL · Tulsa
- 2024 margin
- R (+15.2) · D 41.3% · R 56.5% · Other 2.2%
- 2008→2024 swing
- +9.2pp toward D · 2008: -24.5pp · 2024: -15.2pp
- All cycles
- 2024: R+15.2 2020: R+15.6 2016: R+22.9 2012: R+27.4 2008: R+24.5
Not yet ingested
- Civics
- —
Market trends
- HPI YoY
- ▲ 6.88%
- Current HPI
- 261.8691
- Rent YoY
- ▼ -0.35%
- Metro
- Tulsa, OK
- State GDP YoY
- ▲ 1.55%
- F500 in state
- 6
Industry mix (Fortune 500 HQ in OK)
| Industry | F500 HQs | Revenue |
|---|---|---|
| Energy | 3 | $48B |
|
||
Price history
+76.4% since first listed13 events — show timeline
- 2026-05-13 Price Changed $118,000 MLS Technology, Inc.
- 2026-03-23 Relisted — MLS Technology, Inc.
- 2026-03-07 Pending — MLS Technology, Inc.
- 2026-01-07 Price Changed $135,000 MLS Technology, Inc.
- 2025-11-05 Price Changed $149,900 MLS Technology, Inc.
- 2025-10-08 Listed $159,900 MLS Technology, Inc.
- 2025-09-18 Listing Removed — MLS Technology, Inc.
- 2025-08-11 Price Changed $169,900 MLS Technology, Inc.
- 2025-06-14 Price Changed $179,900 MLS Technology, Inc.
- 2025-04-11 Listed $194,900 MLS Technology, Inc.
- 2000-09-18 Sold (Public Records) $84,000 Public Records
- 1994-05-31 Sold (Public Records) $65,000 Public Records
- 1994-03-17 Listed $66,900 MLS Technology, Inc.
Property tax history
+3.1%/yrLatest (2025): $2,012 · +8.6% YoY. Source: county tax records.
Cash-flow waterfall
monthlySold comps — $/sqft
last 12 mo · ≤1 miLoading sold comps…