 Multi-family
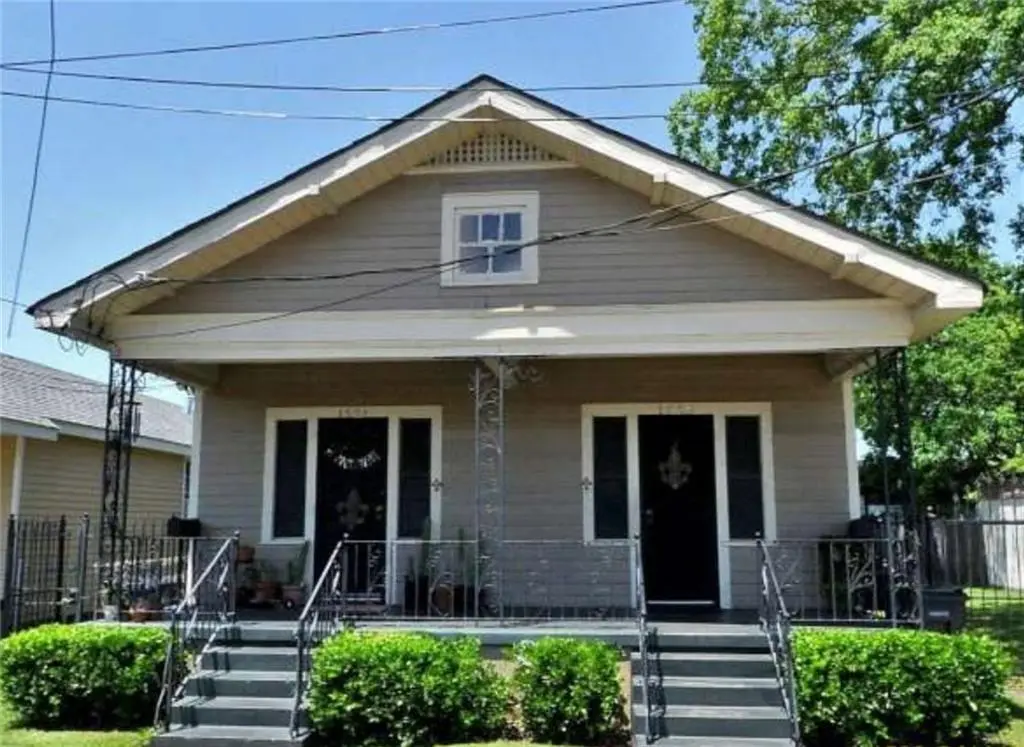
1526-28 Gallier St · New Orleans, LA
Flood risk 8/10 · Major
- FEMA flood zone
- X (shaded)
- Chance of flooding over 30 yrs
- 0.6%
- Est. flood insurance / yr
- $507 – $1,088
Fire risk 2/10 · Minimal
- Est. fire insurance / yr
- $1,269 – $2,357
Heat risk 10/10 · Severe
- Hot days now (above 108°F)
- 7 days/yr
- Hot days in 30 yrs
- 22 days/yr
Wind risk 10/10 · Severe
- Chance of severe wind over 30 yrs
- 99.0%
Air-quality risk 3/10 · Minor
- Unhealthy air days now
- 3 days/yr
- Unhealthy air days in 30 yrs
- 3 days/yr
Risk factors via First Street. Map © Google.
Why this score? — see what drove the D grade
The composite is a weighted blend of 9 inputs, each scored 0–100. Each bar is that input's sub-score; the figure is the points it added to the 100-point composite (weight × sub-score).
- Cash flow +20.2/30.0
- DSCR +6.4/10.0
- 1% rule +4.4/10.0
- Livability +4.0/5.0
- Rent growth +3.1/5.0
- Condition / age +2.5/5.0
- Schools +1.6/10.0
- ARV discount +0.0/15.0
- Appreciation +0.0/10.0
$325,000
🖨 Deal sheet 📄 Offer letter ✓ Due diligence
Multi-family units
County records classify this as Multi-Family (2-4 Unit). Listing-text estimate: 1 unit. estimate disagrees with records
Listing remarks MLS
Income producing/Investment property in the historic Bywater North area. Multi- family (Double) home with Section 8 tenants in place. 6 bedrooms, 2 bathrooms classic shotgun-style architecture with granite countertops, solid wood cabinets & stainless steel appliances. All electric units with separate utilities, central A/C & Heat & indoor laundry. Conveniently located within minutes to shopping, dining, and local amenities.
Key facts
- Solid wood cabinets
- Separate utilities
- Central a/c
Tags
Property features AI
Finance
- Financial info: Two-unit property; Unit 1528: 775 area, currently rent $1,197; Unit 1526: 775 area, currently rent $1,384; Tenants pay electricity, gas, and water
Exterior
- Utilities: Public water; Public sewer
- Home design: Single-story building; Raised foundation
- Construction: Frame construction with wood siding; Shingle roof; Built in very good condition
- Exterior features: Fenced yard; Front porch
Interior
- Bedrooms: Two 3-bedroom units (units 1526 and 1528)
- Bathrooms: Two full bathrooms (one in each unit)
- Heating & cooling: Central heating; Central air conditioning
- Interior features: Screens on windows; Very good condition
- Laundry & utility: Indoor laundry
Neighborhood map
What this means for you Summary
Snapshot
- This is a 4-bed/2.0-bath multifamily listed at $325k.
Deal economics
- At list price, monthly cash flow is $342 ($4k/yr) — positive.
- The deal already cash-flows at list — no discount required.
- To meet the 1% rule (rent ≥ 1% of price), the offer needs to be $305k (6.2% below list).
- Recommended offer: $305k (6.2% below list) — sets the bar for 1% rule.
- Cap rate 7.8% vs local median 4.4% in New Orleans — top-decile yield for the area; either an underpriced asset or a hidden risk that comps aren't pricing in. Stress-test before assuming the spread holds.
Location & tenants
- Location reads 81/100 on livability (#3 in LA, #1,383 nationally) — a professional / high-income tenant draw. Strengths: amenities A+, commute A+, health & safety A+; Watch: crime C-, employment D.
- Orleans Parish (urban): math 11% / reading 27% proficiency, ranked #69 of 98 in LA (top 70%) — low school quality limits family demand, transient renter base, plan for 1-2y turnover; 68% free/reduced lunch — lower-income household profile, screen leases tightly.
- Market conditions: Rents rising (+2.5%/yr); 581 active listings in the ZIP; 40 comparable units currently listed for rent nearby; rentals at typical pace (median 24d on market — plan ~3-4 weeks tenant-placement turnaround); 710 units permitted in Orleans Parish in 2024 (244 in 5+ unit buildings).
- At $3,048/mo this rent would consume 80% of the median local household income ($46k/yr) (locally 1988% of renters already pay >50% of income on rent) — very limited rent-growth headroom before tenants either downsize or default.
Forward outlook
- Local home prices are declining (-3.0%/yr); year-one equity from $2k of loan paydown is wiped out by about $10k of value loss. Plan a longer hold.
- Orleans County population projected at +61% by 2050 — long-run rental-demand tailwind backs the buy-and-hold thesis.
Negotiation context
- It's been on market 45 days — a 3% lower offer ($315k) is reasonable based on typical stale-listing flexibility.
- 2 sale attempts with the ask held roughly flat each time — persistent listings suggest the price (not the market) is what's stuck; bring a comps-based counter.
- Current owner paid $65k; list at $325k implies a 400% gain — meaningful room to come down on a strong offer.
Risks & watch-outs
- Watch-outs: flood insurance adds $66/mo.
- Climate carrying-cost: severe flood risk; severe wind risk, 99% chance of damaging wind over 30y; extreme-heat days projected 7→22/yr by 2055 (HVAC capex compounding) — expect insurance premiums to compound above CPI over the hold.
Questions for the listing agent
- It's been on market 45 days. Have you received any prior offers? Is the seller open to a 6% concession, seller financing, or rate buy-down credit?
- Built in 1978 — when were the roof, HVAC, electrical panel, plumbing, and water heater last replaced?
- What's the actual annual flood-insurance premium (NFIP or private), and is the property in a SFHA with mandatory coverage?
- Is there a deadline driving the sale (1031 exchange, divorce, estate, relocation)? That informs how much negotiation room exists.
- The area grade is low — what's the realistic commute time and amenity access for the typical tenant pool here? Any planned neighborhood developments (good or bad) we should know about?
- What's the average days-on-market for RENTAL listings here right now (not sales)? A rising rental-DOM trend means longer vacancies and softer asking-rent achievability than the comps imply.
- What's the recent tenant-quality profile in this submarket — average credit score on applications, eviction rate, late-payment / NSF rate, and stable-employment percentage? A property-management company in the area should have these aggregated.
- How much new apartment / multifamily construction is in the pipeline within 1–3 miles? Heavy new supply (>2% of stock underway) typically softens rents 12–24 months out; light construction supports rent growth.
Investment metrics
- 1% rule
- 0.94% ✗
- Cap rate
- 7.80%
- Cash-on-cash
- 5.38%
- DSCR
- 1.24
- GRM
- 8.9
CMA / ARV
- ARV (median comp)
- $254,117
- List price
- $325,000
- Delta
- 27.89%
- Verdict
- OVERPRICED
- Comps
- 20 within 1.0 mi
Show comp detail 12 sales within ~0.75 mi
| Address | Dist | Beds/Ba | Sqft | Sold | Price | $/sf | Match |
|---|---|---|---|---|---|---|---|
| 3601 N Claiborne St | 0.08mi | 4/3.0 | 1,547 (-0%) | 11mo | $212,000 | $137 | 83 |
| 2929 Saint Claude Ave | 0.50mi | 4/2.0 | 1,507 (-3%) | 1mo | $155,000 | $103 | 71 |
| 1537-1539 Louisa St | 0.15mi | 4/2.0 | 1,778 (+15%) | 6mo | $329,000 | $185 | 63 |
| 3824 26 Royal St | 0.67mi | 4/2.0 | 1,599 (+3%) | 1mo | $232,500 | $145 | 63 |
| 2421 Feliciana St | 0.72mi | 4/2.0 | 1,572 (+1%) | 2mo | $113,900 | $72 | 62 |
| 1304-06 Independence St | 0.20mi | 4/2.0 | 1,768 (+14%) | 11mo | $61,000 | $35 | 58 |
| 1332 Port St | 0.61mi | 3/2.0 (-1) | 1,475 (-5%) | 6mo | $181,000 | $123 | 53 |
| 727 Montegut St | 0.69mi | 4/2.0 | 1,670 (+8%) | 4mo | $155,000 | $93 | 52 |
| 2336 38 Louisa St | 0.63mi | 4/2.0 | 1,404 (-9%) | 8mo | $214,900 | $153 | 49 |
| 2630 N Rampart St | 0.73mi | 4/2.0 | 1,680 (+8%) | 4mo | $387,500 | $231 | 49 |
| 2326 28 Desire St | 0.59mi | 4/2.0 | 1,376 (-11%) | 11mo | $130,000 | $94 | 45 |
| 832 34 France St | 0.64mi | 3/3.0 (-1) | 1,677 (+8%) | 10mo | $485,000 | $289 | 39 |
Match score weights: distance 35% · size 25% · config 20% · recency 20%. Top-matched comps best support the ARV.
Projected returns pro-forma
-3.0% appreciation · 2.49% rent growth · sell at horizon
- IRR
- -9.8%
- Equity multiple
- 0.64×
- Total profit
- $-32,511
- Equity at exit
- $48,459
- IRR
- -1.1%
- Equity multiple
- 0.92×
- Total profit
- $-6,856
- Equity at exit
- $28,100
Cash invested: $91,000 (down + closing). Projections, not guarantees.
Landlord ↔ Tenant lean methodology
- Overall (STATE)
- 90 Strongly Landlord-Friendly
- State Louisiana
- 90 Strongly Landlord-Friendly · R+12
- County
- — inherits STATE
- City
- — inherits STATE
ZIP-level market 70117
- Rents YoY
- 2.5%
- Active inventory
- 581
- Price-to-rent
- 17.8×
Monthly cashflow live
- Estimated rent
- $3,048 high interval (Pro) →
- Mortgage (P&I)
- −$1,704
- Tax from tax record
- −$160 /mo · $1,918/yr
- Insurance
- −$135
- Flood insurance flood zone
- −$66 /mo · $798/yr
- HOA
- −$0
- Vacancy / Maint / Mgmt
- −$640
- Net cashflow
- $342
Break-even live
2-unit breakdown (identical units grouped — click to expand)
| Units | Beds | Baths | Est. rent |
|---|---|---|---|
| 2× units | 3 | 1 | $3,048 |
| #1 | 3 | 1 | $1,524 |
| #2 | 3 | 1 | $1,524 |
| Total (2 units) | $3,048 | ||
UW: 25.0% down · 7.5% · 30yr · 1.5% tax · 5.0% vac · 8.0% maint · 8.0% mgmt
Financing live
Cash to close
- Down payment
- $81,250
- Closing costs
- $9,750
- Reserves months
- —
- Total cash needed
- —
Loan-product check · same deal, 3 products live
Conventional
25% down · 7.5% · 30yr
- Down + closing
- —
- Monthly P&I
- —
- Monthly cashflow
- —
- DSCR
- —
- Eligible?
- —
Personal DTI + credit; lowest rate.
DSCR
20% down · 8.5% · 30yr
- Down + closing
- —
- Monthly P&I
- —
- Monthly cashflow
- —
- DSCR
- —
- Eligible?
- —
No personal income docs; deal must DSCR.
Hard money
10% down · 12.0% · 12mo
- Down + closing
- —
- Monthly P&I
- —
- Monthly cashflow
- —
- DSCR
- —
- Eligible?
- —
Short-term bridge; refi at stabilization.
Rent comps 40 comps
| Address | Beds | Baths | Sqft | Rent | $/sqft | DOM | Units | Dist |
|---|---|---|---|---|---|---|---|---|
| 1437 Gallier St New Orleans, LA | 3.0 | 2.0 | 1451 | $1,875 | $1.29 | 21d | 1 | 0.04mi |
| 5624-5626 Saint Claude ST New Orleans, LA | 4.0 | 3.0 | 1521 | $2,300 | $1.51 | 24d | 1 | 0.10mi |
| 1325 Pauline St New Orleans, LA | 3.0 | 2.0 | 1792 | $2,250 | $1.26 | 3d | 1 | 0.19mi |
| 1325 Pauline St New Orleans, LA | 3.0 | 2.0 | 1792 | $2,250 | $1.26 | 3d | 1 | 0.19mi |
| 1323 Pauline St New Orleans, LA | 3.0 | 2.0 | 1792 | $2,250 | $1.26 | 3d | 1 | 0.20mi |
| 1628 Bartholomew St New Orleans, LA | 3.0 | 2.0 | 1050 | $1,600 | $1.52 | 24d | 1 | 0.25mi |
| 1822 Piety St New Orleans, LA | 3.0 | 1.5 | 1200 | $1,500 | $1.25 | 16d | 1 | 0.27mi |
| 1904 Desire St New Orleans, LA | 3.0 | 1.0 | 1200 | $1,400 | $1.17 | 10d | 1 | 0.29mi |
| 1835 Louisa St New Orleans, LA | 3.0 | 2.5 | 1800 | $2,350 | $1.31 | 3d | 1 | 0.31mi |
| 1839 Louisa St New Orleans, LA | 3.0 | 2.0 | 1500 | $2,095 | $1.40 | 16d | 1 | 0.32mi |
| 3221 Saint Claude Ave New Orleans, LA | 3.0 | 1.0 | 1900 | $1,650 | $0.87 | 24d | 1 | 0.33mi |
| 1942 Piety St New Orleans, LA | 3.0 | 1.0 | 1100 | $1,500 | $1.36 | 24d | 1 | 0.36mi |
| 2019 Gallier St New Orleans, LA | 4.0 | 2.0 | 1400 | $2,200 | $1.57 | 24d | 1 | 0.37mi |
| 1411 France St New Orleans, LA | 3.0 | 2.0 | 1525 | $2,000 | $1.31 | 24d | 1 | 0.38mi |
| 2028 Desire St New Orleans, LA | 3.0 | 1.0 | 1300 | $1,300 | $1.00 | 24d | 1 | 0.40mi |
| 1231 Feliciana St New Orleans, LA | 3.0 | 2.5 | 1869 | $2,750 | $1.47 | 44d | 1 | 0.40mi |
| 4230 N Claiborne Ave New Orleans, LA | 3.0 | 2.5 | 1296 | $1,750 | $1.35 | 24d | 1 | 0.41mi |
| 1403 Lesseps St New Orleans, LA | 3.0 | 3.0 | 1700 | $1,800 | $1.06 | 12d | 1 | 0.45mi |
| 4318 N Robertson St New Orleans, LA | 3.0 | 1.0 | 1250 | $1,150 | $0.92 | 3d | 1 | 0.45mi |
| 4318 1/2 N Robertson St New Orleans, LA | 3.0 | 1.0 | 1250 | $1,150 | $0.92 | 3d | 1 | 0.46mi |
| 2129 Desire St Unit 1B New Orleans, LA | 3.0 | 1.0 | 1105 | $1,200 | $1.09 | 3d | 1 | 0.47mi |
| 2129 Desire St Unit 1B New Orleans, LA | 3.0 | 1.0 | 1105 | $1,200 | $1.09 | 3d | 1 | 0.47mi |
| 4317 Urquhart St New Orleans, LA | 3.0 | 2.0 | 1300 | $1,650 | $1.27 | 24d | 1 | 0.48mi |
| 4222 N Johnson St New Orleans, LA | 3.0 | 2.0 | 1100 | $1,895 | $1.72 | 24d | 1 | 0.51mi |
| 1038 Montegut St New Orleans, LA | 3.0 | 2.5 | 2250 | $4,200 | $1.87 | 44d | 1 | 0.54mi |
| 1038 Montegut St New Orleans, LA | 3.0 | 2.5 | 2250 | $4,200 | $1.87 | 24d | 1 | 0.54mi |
| 3134 Burgundy St New Orleans, LA | 3.0 | 2.0 | 1887 | $2,900 | $1.54 | 24d | 1 | 0.55mi |
| 2114 Feliciana St Unit A New Orleans, LA | 3.0 | 2.0 | 1134 | $1,500 | $1.32 | 16d | 1 | 0.58mi |
| 2114 Feliciana St Unit A New Orleans, LA | 3.0 | 2.0 | 1134 | $1,500 | $1.32 | 24d | 1 | 0.58mi |
| 882 Montegut St New Orleans, LA | 1.0–3.0 | 1.0–2.0 | 826 | $2,575 | $3.12 | 44d | 7 | 0.64mi |
| 2331 Feliciana St New Orleans, LA | 3.0 | 2.0 | 1250 | $1,850 | $1.48 | 24d | 1 | 0.70mi |
| 2524 N Galvez St New Orleans, LA | 3.0 | 2.5 | 1102 | $1,800 | $1.63 | 17d | 1 | 0.91mi |
| 2522 N Galvez St New Orleans, LA | 3.0 | 2.0 | 1105 | $1,675 | $1.52 | 24d | 1 | 0.91mi |
| 2515 N Galvez St New Orleans, LA | 4.0 | 2.0 | 1200 | $1,200 | $1.00 | 10d | 1 | 0.93mi |
| 2515 N Galvez St Unit 2515 New Orleans, LA | 4.0 | 2.0 | 1200 | $1,900 | $1.58 | 24d | 1 | 0.93mi |
| 2556 N Tonti St New Orleans, LA | 3.0 | 2.0 | 1100 | $1,850 | $1.68 | 16d | 1 | 1.01mi |
| 2317 N Rampart St Unit 1272378P New Orleans, LA | 3.0–6.0 | 2.0–4.0 | 1581 | $4,154 | $2.63 | 3d | 2 | 1.04mi |
| 2322 Burgundy St Unit C New Orleans, LA | 3.0 | 2.0 | 1250 | $2,200 | $1.76 | 24d | 1 | 1.05mi |
| 632 Mandeville St Unit 2B New Orleans, LA | 4.0 | 4.5 | 1337 | $4,500 | $3.37 | 17d | 1 | 1.07mi |
| 1710 Marigny St New Orleans, LA | 3.0 | 2.0 | 1120 | $1,750 | $1.56 | 24d | 1 | 1.13mi |
Listing history 17 events
-
2026-06-18days on market $325,000 Active 45 DOM
-
2026-06-17days on market $325,000 Active 44 DOM
-
2026-06-16days on market $325,000 Active 43 DOM
-
2026-06-15days on market $325,000 Active 42 DOM
-
2026-06-13days on market $325,000 Active 40 DOM
-
2026-06-10days on market $325,000 Active 37 DOM
-
2026-06-09days on market $325,000 Active 36 DOM
-
2026-06-08days on market $325,000 Active 35 DOM
-
2026-06-07days on market $325,000 Active 34 DOM
-
2026-06-05days on market $325,000 Active 31 DOM
-
2026-06-03days on market $325,000 Active 30 DOM
-
2026-06-02days on market $325,000 Active 29 DOM
-
2026-06-01days on market $325,000 Active 28 DOM
-
2026-05-31days on market $325,000 Active 27 DOM
-
2026-05-04$325,000 Active 445-char remark
Show marketing remark (439 chars)
Income producing/Investment property in the historic Bywater North area. Multi- family (Double) home with Section 8 tenants in place. 6 bedrooms, 2 bathrooms classic shotgun-style architecture with granite countertops, solid wood cabinets & stainless steel appliances. All electric units with separate utilities, central A/C & Heat & indoor laundry. Conveniently located within minutes to shopping, dining, and local amenities.
-
2026-05-04$325,000 Active 439-char remark
Show marketing remark (439 chars)
Income producing/Investment property in the historic Bywater North area. Multi- family (Double) home with Section 8 tenants in place. 6 bedrooms, 2 bathrooms classic shotgun-style architecture with granite countertops, solid wood cabinets & stainless steel appliances. All electric units with separate utilities, central A/C & Heat & indoor laundry. Conveniently located within minutes to shopping, dining, and local amenities.
-
1995-11-20soldstatus $65,000
ⓘ Source: listings_history table (triggers on properties + properties_extension) + one-shot
backfill from property_details.listing_events for pre-trigger history.
Tax reassessment forecast LA · Resets to sale price
- Current annual tax
- $1,918 · $160/mo
- Projected year-2 tax
- $1,918 · $160/mo
- Expected delta
- $0/yr ($0/mo · 0.0%)
ⓘ Screening estimate from a state-policy table — verify with the county assessor before closing.
Climate risk First Street
- Flood 8/10 Severe FEMA zone X (shaded) · 60% chance over 30 yrs
- Wildfire 2/10 Low
- Heat 10/10 Extreme 7 d/yr ≥108°F today · 22 d/yr by 30 yrs out
- Wind 10/10 Extreme 99% chance of damaging wind over 30 yrs
- Air quality 3/10 Moderate 3 unhealthy d/yr today · 3 by 30 yrs out
Nearby sold comps map
Loading sold comps map…
Walkable amenities ~0.75 mi
Loading nearby amenities…
Taxation est. · year 1
- Rental income
- $36,576
- − Mortgage interest
- −$18,205
- − Property taxes
- −$1,918
- − Insurance
- −$2,422
- − Repairs & maintenance
- −$2,926
- − Management
- −$2,926
- − Depreciation
- −$9,455
- Taxable loss
- −$1,276
- Est. tax savings @ 24.0%
- +$306
- After-tax cash flow
- $4,409/yr
For passive investors: Depreciation is non-cash, so a rental often shows a tax loss while cash-flowing — sheltering income. Rental losses are passive: they offset passive income freely, and up to $25,000/yr can offset ordinary (W-2) income if you actively participate and your MAGI is under $100k (phasing out to $0 by $150k); unused losses carry forward. On sale, claimed depreciation is recaptured at up to 25%, and gains may owe capital-gains tax (a 1031 exchange can defer both). Figures are a year-1 estimate at your 24.0% rate — not tax advice; consult a CPA.
Schools (NCES district)
- District
- Orleans Parish
- NCES district ID
- 2201170
- Math proficiency
- 11% ▼ -52.00%
- Reading proficiency
- 27% ▼ -46.00%
- Median HH income
- $37,011
- Composite
- 15.78/100
- National rank
- #9271
- State rank
- #69 of 98 in LA
Livability — New Orleans
- Score
- 81/100
- State rank
- #3
- US rank
- #1383
Category grades
Schools grade is shown separately in the Schools card above.
Census & demographics
- Census place
- New Orleans, LA
- County
- Orleans Parish · 338,817 people
- City population
- 338,817
- Metro
- New Orleans-Metairie, LA
- Population (ZIP)
- 25,652
- Household income
- $45,764
- Rent vs Own
- Severe rent burden
- 1988.0
Population outlook (Orleans County) Hauer SSP2
- Today (2025)
- 513,025 people
- By 2030
- 575,781 · +12.2%
- By 2040
- 700,174 · +36.5%
- By 2050
- 826,541 · +61.1%
- By 2075
- 1,123,374 · +119.0%
- By 2100
- 1,355,609 · +164.2%
Race, ethnicity, and origin ACS 2023
- Neighborhood character
- Majority Black (60%)
- Race & ethnicity
- Black 60% White 30% Two or more races 6% Hispanic / Latino 5%
- Common ancestry
- Lithuanian 5% Italian 1% Romanian 1%
- Foreign-born
- 5% · Canada, South Korea
- Languages at home
- 93% English-only · Spanish 3% Other Indo-European 1% French/Haitian/Cajun 1%
Political lean MEDSL · Orleans
- 2024 margin
- Solid D (+67.0) · D 82.2% · R 15.2% · Other 2.7%
- 2008→2024 swing
- +6.7pp toward D · 2008: 60.3pp · 2024: 67.0pp
- All cycles
- 2024: D+67.0 2020: D+68.2 2016: D+66.2 2012: D+62.5 2008: D+60.3
Not yet ingested
- Civics
- —
Market trends
- HPI YoY
- ▼ -177.22%
- Current HPI
- 184.6061
- Rent YoY
- ▲ 2.49%
- Metro
- New Orleans-Metairie, LA
- State GDP YoY
- ▲ 3.29%
- F500 in state
- 10
Industry mix (Fortune 500 HQ in LA)
| Industry | F500 HQs | Revenue |
|---|---|---|
| Telecommunications | 2 | $23B |
|
||
| Utilities | 1 | $12B |
|
||
| Wholesale / Distribution | 1 | $5B |
|
||
| Advertising | 1 | $2B |
|
||
Price history
+400.0% since first listed3 events — show timeline
- 2026-05-04 Listed $325,000 AcadianaMLS
- 2026-05-04 Listed $325,000 GSREIN
- 1995-11-20 Sold (Public Records) $65,000 Public Records
Property tax history
+3.9%/yrLatest (2026): $1,918 · +1.1% YoY. Source: county tax records.
Cash-flow waterfall
monthlySold comps — $/sqft
last 12 mo · ≤1 miLoading sold comps…