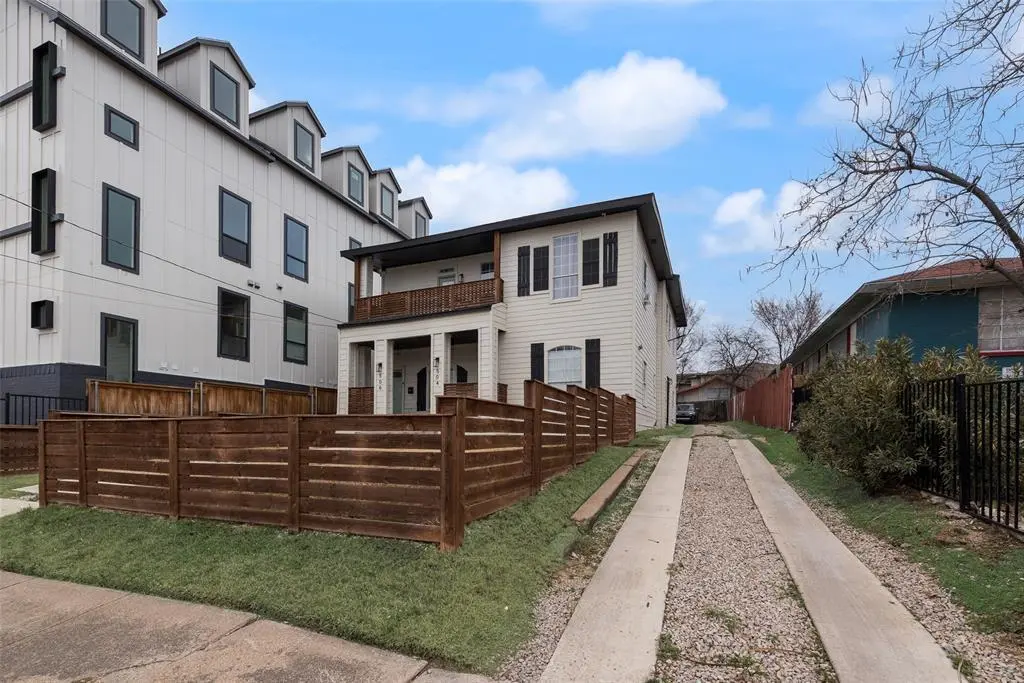
 Fourplex
506 N Lancaster Ave · Dallas, TX
Flood risk 1/10 · Minimal
- FEMA flood zone
- X (unshaded)
- Chance of flooding over 30 yrs
- 0.0%
- Est. flood insurance / yr
- $507 – $1,088
Fire risk 1/10 · Minimal
- Est. fire insurance / yr
- $1,222 – $2,270
Heat risk 7/10 · Major
- Hot days now (above 109°F)
- 7 days/yr
- Hot days in 30 yrs
- 24 days/yr
Wind risk 6/10 · Moderate
- Chance of severe wind over 30 yrs
- 27.0%
Air-quality risk 3/10 · Minor
- Unhealthy air days now
- 2 days/yr
- Unhealthy air days in 30 yrs
- 3 days/yr
Risk factors via First Street. Map © Google.
Why this score? — see what drove the D grade
The composite is a weighted blend of 9 inputs, each scored 0–100. Each bar is that input's sub-score; the figure is the points it added to the 100-point composite (weight × sub-score).
- ARV discount +11.9/15.0
- Appreciation +10.0/10.0
- Cash flow +6.8/30.0
- Livability +4.0/5.0
- Schools +2.8/10.0
- Condition / age +2.5/5.0
- 1% rule +1.9/10.0
- Rent growth +1.8/5.0
- DSCR +1.1/10.0
$880,000
🖨 Deal sheet (PDF) 📄 Offer letter ✓ Due diligence
Multi-family units
County records classify this as Multi-Family (5+ Unit). Listing-text estimate: 4 units. estimate disagrees with records
5+ unit building — per-unit beds/baths from public records are typically unavailable; the breakdown below (if shown) is an estimate from the listing text.
Listing remarks
Located in the heart of North Oak Cliff, this updated 2023 4-plex offers a rare opportunity just minutes from Bishop Arts District and Downtown Dallas. The property updated in 2023 features (2) 2-bedroom 1-bath units and (2) 1-bedroom 1-bath units, providing flexible living and rental options in a highly desirable Dallas location. Residents enjoy close proximity to some of the city’s best dining, entertainment, and cultural attractions, along with easy access to major employment centers in Downtown Dallas. Nearby parks and green spaces, including Lake Cliff Park, offer additional recreation and outdoor appeal. The area continues to experience strong growth and redevelopment, making th
Key facts
- Short term rental
- Airbnb eligible
- North oak cliff
Tags
Property features AI
Finance
- Other: Tenancy typically 9 months or less
- Financial info: Property listed as residential income with 4 units; Gross annual income: $76,200; Gross annual expenses: $17,402; Insurance expense: $3,500; Net operating income: $55,298; Capitalization rate: 6.28%; Listing terms include 1031 Exchange, Cash, Conventional, FHA, VA Loan
- HOA & community: No association
Exterior
- Parking: 6 parking spaces; Additional parking; Concrete parking surfaces
- Security: Smoke detector(s); Video surveillance noted
- Utilities: City sewer
- Home design: Residential income property (quadruplex); Two levels; Preowned (built 1945)
- Construction: Shingle roof; Siding exterior; Pillar/post/pier foundation; Year built 1945
- Exterior features: Balcony; Covered porch(es); Covered patio/porch; Private entrances; Front yard wood fencing
Interior
- Kitchen: Dishwasher; Disposal; Electric cooktop; Electric oven; Electric range; Gas cooktop; Gas oven; Gas range; Microwave; Refrigerator; Kitchen island; Pantry
- Bedrooms: 6 bedrooms total
- Flooring: Luxury vinyl plank
- Bathrooms: 4 full bathrooms
- Heating & cooling: Central heating; Electric heating; Natural gas heating; Central air conditioning; Electric cooling
- Interior features: Open floorplan; Kitchen island; Pantry; Multiple staircases; Cable TV available; Walk-in closets; Smoke detector(s)
- Laundry & utility: Electric water heater; Tankless water heater
Neighborhood map
What this means for you Summary
Snapshot
- This is a 2×2bd/1ba + 2×1bd/1ba units multifamily listed at $880k.
Deal economics
- At list price, monthly cash flow is $-1k ($-16k/yr) — negative. Per door: $-338/mo.
- To cash-flow at today's rent, offer at most $641k (27.1% below list).
- To meet the 1% rule (rent ≥ 1% of price), the offer needs to be $606k (31.1% below list).
- Recommended offer: $606k (31.1% below list) — sets the bar for 1% rule.
- Cap rate 4.5% vs local median 2.3% in Dallas — top-decile yield for the area; either an underpriced asset or a hidden risk that comps aren't pricing in. Stress-test before assuming the spread holds.
Location & tenants
- Location reads 81/100 on livability (#24 in TX, #1,380 nationally) — a professional / high-income tenant draw. Strengths: amenities A+, commute A+, housing A+; Watch: crime F.
- Dallas ISD (urban): math 31% / reading 36% proficiency, ranked #559 of 826 in TX (top 68%) — families likely to look elsewhere, expect single-tenant / working-renter base with shorter leases; 83% free/reduced lunch — lower-income household profile, screen leases tightly.
- Zoned schools: James Bowie El (math 37% / reading 47%, grade F, #1,335 of 4,322 statewide, top 33%, 345 students, 96% FRL); Hector P Garcia Middle (math 15% / reading 27%, grade F, #1,387 of 1,662 statewide, top 85%, 595 students, 95% FRL); W H Adamson H S (math 30% / reading 31%, grade F, #1,085 of 1,632 statewide, top 67%, 1,482 students, 96% FRL).
- Market conditions: Rents soft (-2.7%/yr); 147 active listings in the ZIP; 12,577 units permitted in Dallas County in 2024 (6,829 in 5+ unit buildings).
- At $6,062/mo this rent would consume 155% of the median local household income ($47k/yr) (locally 948% of renters already pay >50% of income on rent) — very limited rent-growth headroom before tenants either downsize or default.
Forward outlook
- In year one you build about $94k of equity ($6k loan paydown + $88k appreciation (10.0% local appreciation)).
- Dallas County population projected at +35% by 2050 — long-run rental-demand tailwind backs the buy-and-hold thesis.
- By year 2, paydown + projected appreciation supports a ~$151k cash-out refi (75% LTV) — recoverable capital for the next deal without selling this one.
Negotiation context
- It's been on market 56 days — a 3% lower offer ($854k) is reasonable based on typical stale-listing flexibility.
- 5 sale attempts since 4y ago with the ask held roughly flat each time — persistent listings suggest the price (not the market) is what's stuck; bring a comps-based counter.
Risks & watch-outs
- Watch-outs: built in 1945 — expect roof / HVAC / electrical / plumbing capex.
- Climate carrying-cost: major wind risk, 27% chance of damaging wind over 30y; extreme-heat days projected 7→24/yr by 2055 (HVAC capex compounding) — expect insurance premiums to compound above CPI over the hold.
Questions for the listing agent
- What do current leases actually rent for vs. the listed asking? Can we see a recent rent roll and the last 12 months of T-12 income?
- It's been on market 56 days. Have you received any prior offers? Is the seller open to a 31% concession, seller financing, or rate buy-down credit?
- Can we see the unit-by-unit rent roll, current vacancy, and any below-market leases? What's the average tenancy length?
- What capital expenditures (roof, boiler, parking lot, exteriors) have been made in the last 5 years, and what's planned in the next 2?
- Built in 1945 — when were the roof, HVAC, electrical panel, plumbing, and water heater last replaced?
- Is there a deadline driving the sale (1031 exchange, divorce, estate, relocation)? That informs how much negotiation room exists.
- Crime grade is F in this area — have there been break-ins, vandalism, or insurance claims at this property in the last 3 years? What carrier currently insures it and at what premium?
- The area grade is low — what's the realistic commute time and amenity access for the typical tenant pool here? Any planned neighborhood developments (good or bad) we should know about?
- What's the average days-on-market for RENTAL listings here right now (not sales)? A rising rental-DOM trend means longer vacancies and softer asking-rent achievability than the comps imply.
- What's the recent tenant-quality profile in this submarket — average credit score on applications, eviction rate, late-payment / NSF rate, and stable-employment percentage? A property-management company in the area should have these aggregated.
- How much new apartment / multifamily construction is in the pipeline within 1–3 miles? Heavy new supply (>2% of stock underway) typically softens rents 12–24 months out; light construction supports rent growth.
Investment metrics
- 1% rule
- 0.69% ✗
- Cap rate
- 4.45%
- Cash-on-cash
- -6.58%
- DSCR
- 0.71
- GRM
- 12.1
CMA / ARV
- ARV (median comp)
- $974,221
- List price
- $880,000
- Delta
- -9.67%
- Verdict
- FAIR
- Comps
- 6 within 1.0 mi
Projected returns pro-forma
10.0% appreciation · 0.0% rent growth · sell at horizon
- IRR
- 18.8%
- Equity multiple
- 2.52×
- Total profit
- $375,587
- Equity at exit
- $792,774
- IRR
- 16.9%
- Equity multiple
- 5.64×
- Total profit
- $1,142,152
- Equity at exit
- $1,709,646
Cash invested: $246,400 (down + closing). Projections, not guarantees.
Landlord ↔ Tenant lean methodology
- Overall (STATE)
- 87 Strongly Landlord-Friendly
- State Texas
- 87 Strongly Landlord-Friendly · R+5
- County
- — inherits STATE
- City
- — inherits STATE
ZIP-level market 75203
- Home prices YoY
- 31.8%
- Rents YoY
- -2.7%
- Active inventory
- 147
- Price-to-rent
- 45.4×
Monthly cashflow live
- Estimated rent
- $6,062 high interval (Pro) →
- Mortgage (P&I)
- −$4,615
- Tax from tax record
- −$1,159 /mo · $13,902/yr
- Insurance
- −$367
- HOA
- −$0
- Vacancy / Maint / Mgmt
- −$1,273
- Net cashflow
- $-1,351
Break-even live
Sensitivity live
| Price | -10% $-853 | -5% $-1,102 | +0% $-1,351 | +5% $-1,600 | +10% $-1,849 |
|---|---|---|---|---|---|
| Rent | -10% $-1,830 | -5% $-1,590 | +0% $-1,351 | +5% $-1,112 | +10% $-872 |
| Rate | -1.0pp $-908 | -0.5pp $-1,127 | base $-1,351 | +0.5pp $-1,579 | +1.0pp $-1,811 |
4-unit breakdown (identical units grouped — click to expand)
| Units | Beds | Baths | Est. rent |
|---|---|---|---|
| 2× units | 2 | 1 | $3,230 |
| #1 | 2 | 1 | $1,615 |
| #2 | 2 | 1 | $1,615 |
| 2× units | 1 | 1 | $2,832 |
| #3 | 1 | 1 | $1,416 |
| #4 | 1 | 1 | $1,416 |
| Total (4 units) | $6,062 | ||
UW: 25.0% down · 7.5% · 30yr · 1.5% tax · 5.0% vac · 8.0% maint · 8.0% mgmt
Financing live
Cash to close
- Down payment
- $220,000
- Closing costs
- $26,400
- Reserves months
- —
- Total cash needed
- —
Loan-product check · same deal, 3 products live
Conventional
25% down · 7.5% · 30yr
- Down + closing
- —
- Monthly P&I
- —
- Monthly cashflow
- —
- DSCR
- —
- Eligible?
- —
Personal DTI + credit; lowest rate.
DSCR
20% down · 8.5% · 30yr
- Down + closing
- —
- Monthly P&I
- —
- Monthly cashflow
- —
- DSCR
- —
- Eligible?
- —
No personal income docs; deal must DSCR.
Hard money
10% down · 12.0% · 12mo
- Down + closing
- —
- Monthly P&I
- —
- Monthly cashflow
- —
- DSCR
- —
- Eligible?
- —
Short-term bridge; refi at stabilization.
Listing history 31 events
-
2026-06-21days on market $880,000 Active 56 DOM
-
2026-06-18days on market $880,000 Active 53 DOM
-
2026-06-17days on market $880,000 Active 52 DOM
-
2026-06-16days on market $880,000 Active 51 DOM
-
2026-06-15days on market $880,000 Active 50 DOM
-
2026-06-13days on market $880,000 Active 48 DOM
-
2026-06-09days on market $880,000 Active 44 DOM
-
2026-06-08days on market $880,000 Active 43 DOM
-
2026-06-07days on market $880,000 Active 42 DOM
-
2026-06-04days on market $880,000 Active 39 DOM
-
2026-06-03days on market $880,000 Active 38 DOM
-
2026-06-02days on market $880,000 Active 37 DOM
-
2026-06-01days on market $880,000 Active 36 DOM
-
2026-05-31days on market $880,000 Active 35 DOM
-
2026-04-26$880,000 Active 979-char remark
-
2025-05-19soldstatus
-
2024-12-09soldstatus
-
2022-12-29soldstatus
-
2022-12-23soldstatus Closed
-
2022-10-17status Pending
-
2022-09-28price $525,500
-
2022-09-27status Active
-
2022-09-26historical Active Option Contract
-
2022-08-16price $548,500
-
2022-08-02status Active
-
2022-07-22status Pending
-
2022-07-12$565,000 Active
-
2022-06-01historical
-
2022-03-16$585,000 Active
-
2006-11-09soldstatus
-
2005-09-20soldstatus
ⓘ Source: listings_history table (triggers on properties + properties_extension) + one-shot
backfill from property_details.listing_events for pre-trigger history.
Tax reassessment forecast TX · Resets to sale price
- Current annual tax
- $13,902 · $1,159/mo
- Projected year-2 tax
- $16,104 · $1,342/mo
- Expected delta
- +$2,202/yr (+$183/mo · 15.8%)
ⓘ Screening estimate from a state-policy table — verify with the county assessor before closing.
Climate risk First Street
- Flood 1/10 Low FEMA zone X (unshaded) · 0% chance over 30 yrs
- Wildfire 1/10 Low
- Heat 7/10 Severe 7 d/yr ≥109°F today · 24 d/yr by 30 yrs out
- Wind 6/10 Major 27% chance of damaging wind over 30 yrs
- Air quality 3/10 Moderate 2 unhealthy d/yr today · 3 by 30 yrs out
Nearby sold comps map
Loading sold comps map…
Walkable amenities ~0.75 mi
Loading nearby amenities…
Taxation est. · year 1
- Rental income
- $72,744
- − Mortgage interest
- −$49,294
- − Property taxes
- −$13,902
- − Insurance
- −$4,400
- − Repairs & maintenance
- −$5,820
- − Management
- −$5,820
- − Depreciation
- −$25,600
- Taxable loss
- −$32,091
- Est. tax savings @ 24.0%
- +$7,702
- After-tax cash flow
- $-8,510/yr
For passive investors: Depreciation is non-cash, so a rental often shows a tax loss while cash-flowing — sheltering income. Rental losses are passive: they offset passive income freely, and up to $25,000/yr can offset ordinary (W-2) income if you actively participate and your MAGI is under $100k (phasing out to $0 by $150k); unused losses carry forward. On sale, claimed depreciation is recaptured at up to 25%, and gains may owe capital-gains tax (a 1031 exchange can defer both). Figures are a year-1 estimate at your 24.0% rate — not tax advice; consult a CPA.
Schools (NCES district)
- District
- Dallas ISD
- NCES district ID
- 4816230
- Math proficiency
- 31% ▼ -16.00%
- Reading proficiency
- 36% ▼ -4.00%
- Median HH income
- $42,881
- Composite
- 28.41/100
- National rank
- #6763
- State rank
- #559 of 826 in TX
Livability — Dallas
- Score
- 81/100
- State rank
- #24
- US rank
- #1380
Category grades
Schools grade is shown separately in the Schools card above.
Census & demographics
- Census place
- Dallas, TX
- County
- Dallas County · 2,612,404 people
- City population
- 1,168,437
- Metro
- Dallas-Fort Worth-Arlington, TX
- Population (ZIP)
- 15,775
- Household income
- $46,989
- Rent vs Own
- Severe rent burden
- 948.0
Population outlook (Dallas County) Hauer SSP2
- Today (2025)
- 2,979,839 people
- By 2030
- 3,191,823 · +7.1%
- By 2040
- 3,619,611 · +21.5%
- By 2050
- 4,026,915 · +35.1%
- By 2075
- 4,957,073 · +66.4%
- By 2100
- 5,508,725 · +84.9%
Race, ethnicity, and origin ACS 2023
- Neighborhood character
- Diverse neighborhood (Simpson 0.55)
- Race & ethnicity
- Hispanic / Latino 59% Black 31% Two or more races 17% White 7% Native American 2%
- Hispanic origin (detail)
- Mexican 53%
- Common ancestry
- Lithuanian 1% Swiss 1%
- Foreign-born
- 29% · Canada, China, Jamaica
- Languages at home
- 47% English-only · Spanish 51% French/Haitian/Cajun 1%
Political lean MEDSL · Dallas
- 2024 margin
- Strong D (+22.2) · D 60.2% · R 38.0% · Other 1.8%
- 2008→2024 swing
- +6.9pp toward D · 2008: 15.3pp · 2024: 22.2pp
- All cycles
- 2024: D+22.2 2020: D+31.6 2016: D+26.2 2012: D+15.4 2008: D+15.3
Not yet ingested
- Civics
- —
Market trends
- HPI YoY
- ▲ 86.64%
- Current HPI
- 358.9507
- Rent YoY
- ▼ -2.72%
- Metro
- Dallas-Fort Worth-Arlington, TX
- State GDP YoY
- ▲ 3.95%
- F500 in state
- 110
Industry mix (Fortune 500 HQ in TX)
| Industry | F500 HQs | Revenue |
|---|---|---|
| Energy | 16 | $1,198B |
|
||
| Technology | 5 | $198B |
|
||
| Engineering / Construction | 4 | $72B |
|
||
| Energy Services | 3 | $60B |
|
||
| Utilities | 3 | $41B |
|
||
| Healthcare | 2 | $330B |
|
||
Price history
+50.4% since first listed17 events — show timeline
- 2026-04-26 Listed $880,000 NTREIS
- 2025-05-19 Sold (Public Records) — Public Records
- 2024-12-09 Sold (Public Records) — Public Records
- 2022-12-29 Sold (Public Records) — Public Records
- 2022-12-23 Sold (MLS) — NTREIS
- 2022-10-17 Pending — NTREIS
- 2022-09-28 Price Changed $525,500 NTREIS
- 2022-09-27 Relisted — NTREIS
- 2022-09-26 Contingent — NTREIS
- 2022-08-16 Price Changed $548,500 NTREIS
- 2022-08-02 Relisted — NTREIS
- 2022-07-22 Pending — NTREIS
- 2022-07-12 Listed $565,000 NTREIS
- 2022-06-01 Listing Removed — NTREIS
- 2022-03-16 Listed $585,000 NTREIS
- 2006-11-09 Sold (Public Records) — Public Records
- 2005-09-20 Sold (Public Records) — Public Records
Property tax history
+8.2%/yrLatest (2025): $13,902 · -0.3% YoY. Source: county tax records.
Cash-flow waterfall
monthlySold comps — $/sqft
last 12 mo · ≤1 miLoading sold comps…