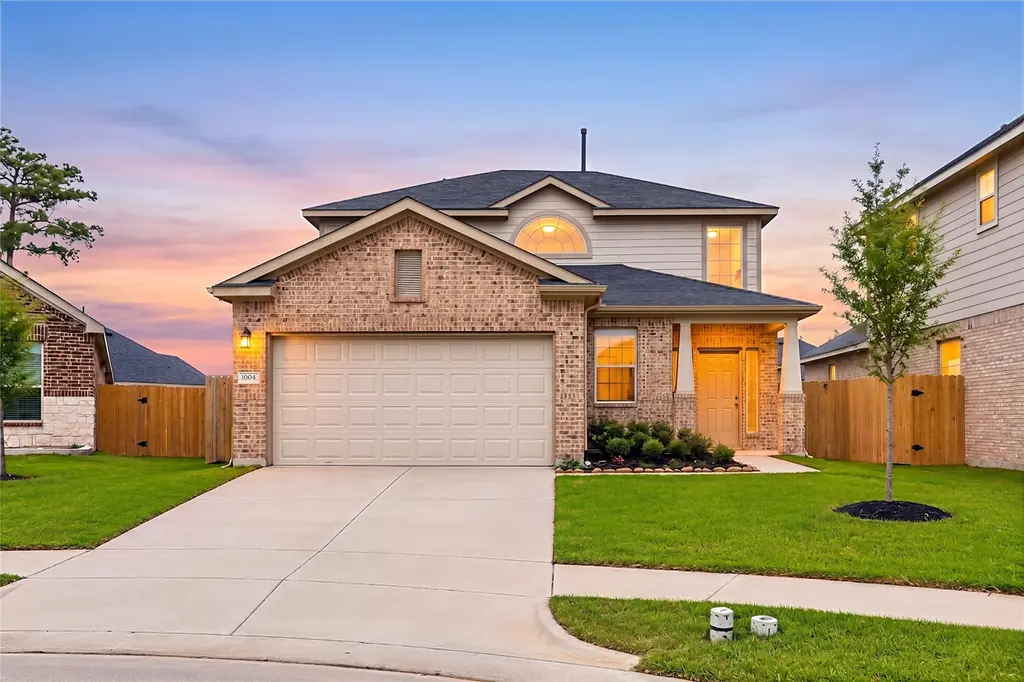
10042 Cottontail Ct · Magnolia, TX
Flood risk 1/10 · Minimal
- FEMA flood zone
- X (unshaded)
- Chance of flooding over 30 yrs
- 0.0%
- Est. flood insurance / yr
- $507 – $1,088
Fire risk 4/10 · Minor
- Est. fire insurance / yr
- $1,222 – $2,270
Heat risk 8/10 · Major
- Hot days now (above 111°F)
- 7 days/yr
- Hot days in 30 yrs
- 24 days/yr
Wind risk 8/10 · Major
- Chance of severe wind over 30 yrs
- 99.0%
Air-quality risk 2/10 · Minimal
- Unhealthy air days now
- 2 days/yr
- Unhealthy air days in 30 yrs
- 2 days/yr
Risk factors via First Street. Map © Google.
Why this score? — see what drove the D+ grade
The composite is a weighted blend of 9 inputs, each scored 0–100. Each bar is that input's sub-score; the figure is the points it added to the 100-point composite (weight × sub-score).
- ARV discount +12.9/15.0
- Appreciation +10.0/10.0
- Cash flow +6.1/30.0
- Condition / age +4.0/5.0
- Schools +3.9/10.0
- Livability +3.7/5.0
- 1% rule +3.0/10.0
- Rent growth +2.6/5.0
- DSCR +0.4/10.0
$279,000
🖨 Deal sheet (PDF) 📄 Offer letter ✓ Due diligence
Listing remarks
Discover charm, open space & a peaceful cul-de-sac setting in Mill Creek Trails! This inviting 2-story home delivers Craftsman-style curb appeal, an oversize backyard & NEW CARPET TO BE INSTALLED PRIOR TO CLOSING! Step inside to soaring ceilings, & durable vinyl plank floors flowing through the main living area. The dining room sits off the island kitchen w/ granite counters, great prep space & easy connection for everyday living or entertaining. The downstairs primary suite offers privacy & comfort w/ a soaking tub, separate shower & walk-in closet. A decorative wrought iron staircase adds character while keeping the home bright & airy. Upstairs fea
Key facts
- 5,357 sq ft lot
- 2 garage spots
- Built 2020
Property features AI
Finance
- HOA & community: Association: King; Annual association fee of $450
Exterior
- Parking: Attached 2-car garage
- Security: Smoke detectors installed
- Utilities: Public water; Public sewer
- Home design: Residential property; Built in 2020; Slab foundation; Composition roof; Builder: Colina
- Construction: Brick and cement siding construction
- Exterior features: Deck; Patio; Fenced backyard; Located on a cul-de-sac; Concrete road surface
Interior
- Kitchen: Dishwasher; Gas cooktop; Gas oven; Garbage disposal
- Bedrooms: Primary bedroom on the first floor (16 x 13); Three additional bedrooms on the second floor (12 x 12; 13 x 10; 13 x 11)
- Flooring: Carpet; Plank; Vinyl
- Bathrooms: 2 full bathrooms; 1 half bathroom
- Heating & cooling: Central heating (gas); Central air conditioning (electric)
- Interior features: Kitchen island; Pantry; Self-closing cabinet doors; Soaking tub; Separate shower; Tub/shower combination; Ceiling fans; Kitchen/dining combo; Programmable thermostat; Low emissivity windows; Ventilation for improved indoor air quality; Energy Star qualified appliances
- Laundry & utility: Washer hookup; Electric dryer hookup
Neighborhood map
What this means for you Summary
Snapshot
- This is a 4-bed/2.5-bath single-family listed at $279k. Condition is rated good.
Deal economics
- At list price, monthly cash flow is $-525 ($-6k/yr) — negative.
- To cash-flow at today's rent, offer at most $186k (33.3% below list).
- To meet the 1% rule (rent ≥ 1% of price), the offer needs to be $223k (20.0% below list).
- Recommended offer: $186k (33.3% below list) — sets the bar for cash-flow.
Location & tenants
- Location reads 73/100 on livability (#222 in TX) — a middle-class / working-renter tenant base. Strengths: crime A+, cost of living A+, housing A+; Watch: amenities F, commute F.
- Magnolia ISD (rural): math 42% / reading 45% proficiency, ranked #247 of 826 in TX (top 30%) — families likely to look elsewhere, expect single-tenant / working-renter base with shorter leases.
- Zoned schools: Cedric C Smith (math 48% / reading 42%, grade D-, #1,133 of 4,322 statewide, top 27%, 724 students, 55% FRL); Bear Branch J H (math 44% / reading 46%, grade D, #479 of 1,662 statewide, top 29%, 1,076 students, 37% FRL); Magnolia H S (math 47% / reading 62%, grade C-, #379 of 1,632 statewide, top 26%, 2,248 students, 31% FRL) — zoned schools at 41% FRL track the district average.
- Market conditions: Rents flat; 1622 active listings in the ZIP; 1 comparable units currently listed for rent nearby; high-income renter base; 13,259 units permitted in Montgomery County in 2024 (1,402 in 5+ unit buildings).
Forward outlook
- In year one you build about $30k of equity ($2k loan paydown + $28k appreciation (10.0% local appreciation)).
- Montgomery County population projected at +65% by 2050 — long-run rental-demand tailwind backs the buy-and-hold thesis.
- By year 2, paydown + projected appreciation supports a ~$48k cash-out refi (75% LTV) — recoverable capital for the next deal without selling this one.
Negotiation context
- It's been on market 20 days — a 2% lower offer ($275k) is reasonable based on typical stale-listing flexibility.
- 2 sale attempts since 2y ago; this cycle's ask has dropped $16k (5%) from the opening price — seller is motivated, your offer sets the floor, not the list.
Risks & watch-outs
- Watch-outs: property tax is 2.9% of price.
- Climate carrying-cost: severe wind risk, 99% chance of damaging wind over 30y; extreme-heat days projected 7→24/yr by 2055 (HVAC capex compounding) — expect insurance premiums to compound above CPI over the hold.
Questions for the listing agent
- What do current leases actually rent for vs. the listed asking? Can we see a recent rent roll and the last 12 months of T-12 income?
- Property tax is high relative to price — has the assessment been appealed recently, and will the sale trigger a re-assessment?
- What does the HOA fee cover, when was the last increase, and are there any pending special assessments or reserve-fund shortfalls?
- Is there a deadline driving the sale (1031 exchange, divorce, estate, relocation)? That informs how much negotiation room exists.
- Schools are D-rated, which usually means shorter tenancies and higher turnover. Who's the typical renter profile here, and what's been the actual vacancy rate?
- The area grade is low — what's the realistic commute time and amenity access for the typical tenant pool here? Any planned neighborhood developments (good or bad) we should know about?
- What's the average days-on-market for RENTAL listings here right now (not sales)? A rising rental-DOM trend means longer vacancies and softer asking-rent achievability than the comps imply.
- What's the recent tenant-quality profile in this submarket — average credit score on applications, eviction rate, late-payment / NSF rate, and stable-employment percentage? A property-management company in the area should have these aggregated.
- How much new for-sale + rental construction is in the pipeline within 1–3 miles? Heavy new supply typically softens prices + rents 12–24 months out; constrained supply supports both.
Investment metrics
- 1% rule
- 0.80% ✗
- Cap rate
- 4.03%
- Cash-on-cash
- -8.07%
- DSCR
- 0.64
- GRM
- 10.4
CMA / ARV
- ARV (on-the-fly)
- $316,863
- Comps found
- 12
Show comp detail 12 sales within ~0.75 mi
| Address | Dist | Beds/Ba | Sqft | Sold | Price | $/sf | Match |
|---|---|---|---|---|---|---|---|
| 27237 Crevalle Jack Ln | 0.17mi | 3/2.5 (-1) | 2,100 (+1%) | 2mo | $275,000 | $131 | 83 |
| 27286 Axis Deer Trl | 0.07mi | 3/2.5 (-1) | 1,988 (-4%) | 6mo | $300,142 | $151 | 80 |
| 27310 Axis Deer Trl | 0.10mi | 3/2.5 (-1) | 1,988 (-4%) | 6mo | $281,231 | $141 | 78 |
| 10216 Longhorn Ridge Ct | 0.17mi | 3/2.5 (-1) | 1,988 (-4%) | 4mo | $320,142 | $161 | 77 |
| 27207 Mockingbird Terrace Ln | 0.23mi | 3/2.5 (-1) | 1,988 (-4%) | 3mo | $317,254 | $160 | 75 |
| 27146 Grey Fox Run | 0.21mi | 4/2.0 | 1,948 (-6%) | 4mo | $299,000 | $153 | 75 |
| 10236 Badger Run Ln | 0.31mi | 3/2.5 (-1) | 2,061 (-0%) | 6mo | $289,990 | $141 | 75 |
| 27278 Axis Deer Trl | 0.06mi | 3/2.5 (-1) | 1,866 (-10%) | 4mo | $299,635 | $161 | 72 |
| 10280 Badger Run Ln | 0.33mi | 4/2.5 | 2,173 (+5%) | 7mo | $305,510 | $141 | 71 |
| 27314 Axis Deer Trl | 0.11mi | 3/2.5 (-1) | 1,866 (-10%) | 6mo | $297,525 | $159 | 68 |
| 10155 Red Snapper Rd | 0.21mi | 4/2.5 | 1,860 (-10%) | 7mo | $283,416 | $152 | 68 |
| 27313 Dobbin Huffsmith Rd | 0.71mi | 4/3.0 | 2,381 (+15%) | 7mo | $400,000 | $168 | 34 |
Match score weights: distance 35% · size 25% · config 20% · recency 20%. Top-matched comps best support the ARV.
Projected returns pro-forma
10.0% appreciation · 0.32% rent growth · sell at horizon
- IRR
- 17.8%
- Equity multiple
- 2.45×
- Total profit
- $112,884
- Equity at exit
- $251,345
- IRR
- 16.2%
- Equity multiple
- 5.46×
- Total profit
- $348,598
- Equity at exit
- $542,036
Cash invested: $78,120 (down + closing). Projections, not guarantees.
Landlord ↔ Tenant lean methodology
- Overall (STATE)
- 87 Strongly Landlord-Friendly
- State Texas
- 87 Strongly Landlord-Friendly · R+5
- County
- — inherits STATE
- City
- — inherits STATE
ZIP-level market 77354
- Home prices YoY
- 2.4%
- Rents YoY
- 0.3%
- Active inventory
- 1622
- Price-to-rent
- 10.4×
Monthly cashflow live
- Estimated rent
- $2,233 medium interval (Pro) →
- Mortgage (P&I)
- −$1,463
- Tax from tax record
- −$672 /mo · $8,066/yr
- Insurance
- −$116
- HOA
- −$38
- Vacancy / Maint / Mgmt
- −$469
- Net cashflow
- $-525
Break-even live
Sensitivity live
| Price | -10% $-367 | -5% $-446 | +0% $-525 | +5% $-604 | +10% $-683 |
|---|---|---|---|---|---|
| Rent | -10% $-702 | -5% $-614 | +0% $-525 | +5% $-437 | +10% $-349 |
| Rate | -1.0pp $-385 | -0.5pp $-454 | base $-525 | +0.5pp $-598 | +1.0pp $-671 |
UW: 25.0% down · 7.5% · 30yr · 1.5% tax · 5.0% vac · 8.0% maint · 8.0% mgmt
Financing live
Cash to close
- Down payment
- $69,750
- Closing costs
- $8,370
- Reserves months
- —
- Total cash needed
- —
Loan-product check · same deal, 3 products live
Conventional
25% down · 7.5% · 30yr
- Down + closing
- —
- Monthly P&I
- —
- Monthly cashflow
- —
- DSCR
- —
- Eligible?
- —
Personal DTI + credit; lowest rate.
DSCR
20% down · 8.5% · 30yr
- Down + closing
- —
- Monthly P&I
- —
- Monthly cashflow
- —
- DSCR
- —
- Eligible?
- —
No personal income docs; deal must DSCR.
Hard money
10% down · 12.0% · 12mo
- Down + closing
- —
- Monthly P&I
- —
- Monthly cashflow
- —
- DSCR
- —
- Eligible?
- —
Short-term bridge; refi at stabilization.
Rent comps 1 comps
| Address | Beds | Baths | Sqft | Rent | $/sqft | DOM | Units | Dist |
|---|---|---|---|---|---|---|---|---|
| 9829 Glen Brook Ln Magnolia, TX | 4.0 | 2.0 | 1637 | $1,999 | $1.22 | 4d | 1 | 0.63mi |
HOA detail
- Monthly dues
- $38 · $456/yr
Listing history 12 events
-
2026-06-07days on market $279,000 Coming Soon 20 DOM
-
2026-06-04days on market $279,000 Coming Soon 17 DOM
-
2026-06-03days on market $279,000 Coming Soon 16 DOM
-
2026-06-02days on market $279,000 Coming Soon 15 DOM
-
2026-06-01days on market $279,000 Coming Soon 14 DOM
-
2026-05-31days on market $279,000 Coming Soon 13 DOM
-
2026-05-18historical $279,000
-
2025-06-20historical
-
2025-03-12$295,000 Active
-
2024-08-12historical
-
2024-05-30price $294,999
-
2024-05-15$299,999 Active
ⓘ Source: listings_history table (triggers on properties + properties_extension) + one-shot
backfill from property_details.listing_events for pre-trigger history.
Tax reassessment forecast TX · Resets to sale price
- Current annual tax
- $8,066 · $672/mo
- Projected year-2 tax
- $8,066 · $672/mo
- Expected delta
- $0/yr ($0/mo · 0.0%)
ⓘ Screening estimate from a state-policy table — verify with the county assessor before closing.
Climate risk First Street
- Flood 1/10 Low FEMA zone X (unshaded) · 0% chance over 30 yrs
- Wildfire 4/10 Moderate
- Heat 8/10 Severe 7 d/yr ≥111°F today · 24 d/yr by 30 yrs out
- Wind 8/10 Severe 99% chance of damaging wind over 30 yrs
- Air quality 2/10 Low 2 unhealthy d/yr today · 2 by 30 yrs out
Nearby sold comps map
Loading sold comps map…
Walkable amenities ~0.75 mi
Loading nearby amenities…
Taxation est. · year 1
- Rental income
- $26,799
- − Mortgage interest
- −$15,628
- − Property taxes
- −$8,066
- − Insurance
- −$1,395
- − Repairs & maintenance
- −$2,144
- − Management
- −$2,144
- − HOA
- −$456
- − Depreciation
- −$8,116
- Taxable loss
- −$11,151
- Est. tax savings @ 24.0%
- +$2,676
- After-tax cash flow
- $-3,628/yr
For passive investors: Depreciation is non-cash, so a rental often shows a tax loss while cash-flowing — sheltering income. Rental losses are passive: they offset passive income freely, and up to $25,000/yr can offset ordinary (W-2) income if you actively participate and your MAGI is under $100k (phasing out to $0 by $150k); unused losses carry forward. On sale, claimed depreciation is recaptured at up to 25%, and gains may owe capital-gains tax (a 1031 exchange can defer both). Figures are a year-1 estimate at your 24.0% rate — not tax advice; consult a CPA.
Condition & rehab AI · 12 photos
This well-maintained, 2-story home in Mill Creek Trails offers a good condition with a good curb appeal and modern finishes. Minor updates can further enhance its value for both resale and rental.
Value-add opportunities
- Both Paint exterior and interior walls — Fresh paint can enhance curb appeal and interior aesthetics.
- Both Replace carpet in bedrooms — New carpet can improve comfort and add value.
- Both Install smart home devices — Smart home devices can increase convenience and appeal to potential buyers/renters.
- Both Add outdoor lighting — Well-lit exterior can enhance safety and curb appeal.
- Both Upgrade kitchen appliances — Modern appliances can improve functionality and appeal to potential buyers/renters.
Renovation cost estimate screening
Value-add ROI direction
- Both Paint exterior and interior walls — Fresh paint can enhance curb appeal and interior aesthetics. ↑
- Both Replace carpet in bedrooms — New carpet can improve comfort and add value. ↑
- Both Install smart home devices — Smart home devices can increase convenience and appeal to potential buyers/renters. ↑
- Both Add outdoor lighting — Well-lit exterior can enhance safety and curb appeal. ↑
- Both Upgrade kitchen appliances — Modern appliances can improve functionality and appeal to potential buyers/renters. ↑
ⓘ Cost ranges are severity-bucket heuristics (US national rule-of-thumb). Get contractor quotes + a written scope before underwriting a rehab budget.
Schools (NCES district)
- District
- Magnolia ISD
- NCES district ID
- 4828740
- Math proficiency
- 42% ▼ -7.00%
- Reading proficiency
- 45% ▼ -4.00%
- Median HH income
- $71,692
- Composite
- 39.46/100
- National rank
- #3958
- State rank
- #247 of 826 in TX
Livability — Magnolia
- Score
- 73/100
- State rank
- #222
- US rank
- #5442
Category grades
Schools grade is shown separately in the Schools card above.
Census & demographics
- County
- Montgomery County · 663,713 people
- City population
- 32,847
- Metro
- Houston-The Woodlands-Sugar Land, TX
- Population (ZIP)
- 44,900
- Household income
- $112,504
- Rent vs Own
- Severe rent burden
- 586.0
Population outlook (Montgomery County) Hauer SSP2
- Today (2025)
- 713,896 people
- By 2030
- 805,263 · +12.8%
- By 2040
- 992,708 · +39.1%
- By 2050
- 1,179,590 · +65.2%
- By 2075
- 1,628,084 · +128.1%
- By 2100
- 1,937,880 · +171.5%
Race, ethnicity, and origin ACS 2023
- Neighborhood character
- Predominantly White (66%)
- Race & ethnicity
- White 66% Hispanic / Latino 25% Two or more races 18% Black 3% Asian 1%
- Hispanic origin (detail)
- Mexican 14% Puerto Rican 1%
- Common ancestry
- Lithuanian 4% Slovak 2% Italian 2%
- Foreign-born
- 11% · Canada, Vietnam
- Languages at home
- 83% English-only · Spanish 15% Other Indo-European 1% German/W. Germanic 1%
Political lean MEDSL · Montgomery
- 2024 margin
- Solid R (+45.5) · D 26.8% · R 72.3%
- 2008→2024 swing
- +7.2pp toward D · 2008: -52.7pp · 2024: -45.5pp
- All cycles
- 2024: R+45.5 2020: R+43.8 2016: R+51.4 2012: R+60.7 2008: R+52.7
Not yet ingested
- Civics
- —
Market trends
- HPI YoY
- ▲ 12.09%
- Current HPI
- 512.87
- Rent YoY
- ▲ 0.32%
- Metro
- Houston-The Woodlands-Sugar Land, TX
- State GDP YoY
- ▲ 3.95%
- F500 in state
- 110
Industry mix (Fortune 500 HQ in TX)
| Industry | F500 HQs | Revenue |
|---|---|---|
| Energy | 16 | $1,198B |
|
||
| Technology | 5 | $198B |
|
||
| Engineering / Construction | 4 | $72B |
|
||
| Energy Services | 3 | $60B |
|
||
| Utilities | 3 | $41B |
|
||
| Healthcare | 2 | $330B |
|
||
Price history
-7.0% since first listed6 events — show timeline
- 2026-05-18 Coming Soon $279,000 HARMLS
- 2025-06-20 Listing Removed — HARMLS
- 2025-03-12 Listed $295,000 HARMLS
- 2024-08-12 Listing Removed — HARMLS
- 2024-05-30 Price Changed $294,999 HARMLS
- 2024-05-15 Listed $299,999 HARMLS
Property tax history
+3.7%/yrLatest (2025): $8,066 · -4.8% YoY. Source: county tax records.
Cash-flow waterfall
monthlySold comps — $/sqft
last 12 mo · ≤1 miLoading sold comps…