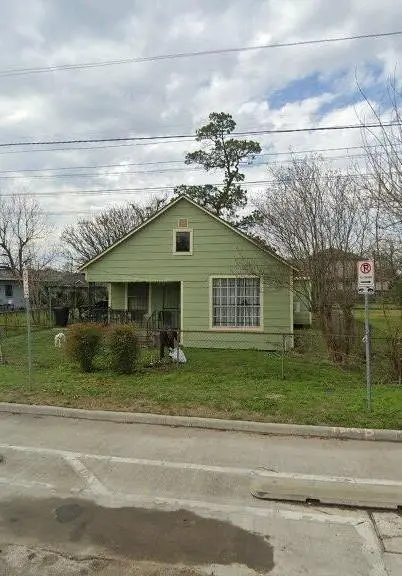
4913 Elysian St · Houston, TX
Flood risk 6/10 · Moderate
- FEMA flood zone
- X (unshaded)
- Chance of flooding over 30 yrs
- 0.73%
- Est. flood insurance / yr
- $507 – $1,088
Fire risk 1/10 · Minimal
- Est. fire insurance / yr
- $1,222 – $2,270
Heat risk 9/10 · Severe
- Hot days now (above 109°F)
- 7 days/yr
- Hot days in 30 yrs
- 24 days/yr
Wind risk 9/10 · Severe
- Chance of severe wind over 30 yrs
- 99.0%
Air-quality risk 3/10 · Minor
- Unhealthy air days now
- 2 days/yr
- Unhealthy air days in 30 yrs
- 3 days/yr
Risk factors via First Street. Map © Google.
Why this score? — see what drove the D grade
The composite is a weighted blend of 9 inputs, each scored 0–100. Each bar is that input's sub-score; the figure is the points it added to the 100-point composite (weight × sub-score).
- ARV discount +15.0/15.0
- Cash flow +10.7/30.0
- Livability +3.7/5.0
- 1% rule +3.6/10.0
- DSCR +3.1/10.0
- Rent growth +2.7/5.0
- Schools +2.7/10.0
- Condition / age +2.5/5.0
- Appreciation +0.0/10.0
$190,000
🖨 Deal sheet (PDF) 📄 Offer letter ✓ Due diligence
Listing remarks
This property is situated in the burgeoning Northside Area, ideal for remodeling or new construction. Surrounded by recently renovated and constructed properties, it boasts a prime location near Downtown Houston and major freeways. Room sizes should be verified.
Key facts
- 5,000 sq ft lot
- Built 1940
- Listed 60 days
Property features AI
Exterior
- Parking: No dedicated parking
- Utilities: Public water
- Home design: Residential property
- Construction: Wood siding exterior; Block foundation; Composition roof; Built in 1940
- Exterior features: Subdivision lot
Interior
- Bedrooms: Three bedrooms on the first floor (sizes: 10x11, 10x11, 10x10)
- Bathrooms: One full bathroom
- Interior features: 3 total rooms
Neighborhood map
What this means for you Summary
Snapshot
- This is a 3-bed/1.0-bath single-family listed at $190k.
Deal economics
- At list price, monthly cash flow is $-92 ($-1k/yr) — negative.
- To cash-flow at today's rent, offer at most $174k (8.6% below list).
- To meet the 1% rule (rent ≥ 1% of price), the offer needs to be $163k (14.2% below list).
- Recommended offer: $163k (14.2% below list) — sets the bar for 1% rule.
- Cap rate 5.7% vs local median 3.2% in Houston — top-decile yield for the area; either an underpriced asset or a hidden risk that comps aren't pricing in. Stress-test before assuming the spread holds.
Location & tenants
- Location reads 74/100 on livability (#184 in TX, #4,771 nationally) — a middle-class / working-renter tenant base. Strengths: amenities A+, cost of living A+, housing A+; Watch: crime F.
- Houston ISD (urban): math 27% / reading 35% proficiency, ranked #593 of 826 in TX (top 72%) — families likely to look elsewhere, expect single-tenant / working-renter base with shorter leases; 71% free/reduced lunch — lower-income household profile, screen leases tightly.
- Zoned schools: Looscan El (math 22% / reading 27%, grade F, #3,052 of 4,322 statewide, top 74%, 262 students, 98% FRL); Marshall Middle (math 14% / reading 22%, grade F, #1,491 of 1,662 statewide, top 91%, 607 students, 97% FRL); Northside H S (math 15% / reading 26%, grade F, #1,389 of 1,632 statewide, top 86%, 1,168 students, 94% FRL) — zoned schools average 96% FRL vs 71% district-wide (25 pts higher); higher-poverty schools than district average — tighter screening recommended.
- Market conditions: Rents flat; 605 active listings in the ZIP; 16 comparable units currently listed for rent nearby; rentals at typical pace (median 26d on market — plan ~3-4 weeks tenant-placement turnaround); 44% of comp listings sitting > 30 days — soft ceiling on asking rent; solid renter incomes; 29,883 units permitted in Harris County in 2024 (8,621 in 5+ unit buildings).
Forward outlook
- Local home prices are declining (-3.0%/yr); year-one equity from $1k of loan paydown is wiped out by about $6k of value loss. Plan a longer hold.
- Harris County population projected at +47% by 2050 — long-run rental-demand tailwind backs the buy-and-hold thesis.
Negotiation context
- It's been on market 61 days — a 6% lower offer ($179k) is reasonable based on typical stale-listing flexibility.
- 10 sale attempts since 3y ago with the ask held roughly flat each time — persistent listings suggest the price (not the market) is what's stuck; bring a comps-based counter.
Risks & watch-outs
- Watch-outs: built in 1940 — expect roof / HVAC / electrical / plumbing capex.
- Climate carrying-cost: major flood risk; severe wind risk, 99% chance of damaging wind over 30y; extreme-heat days projected 7→24/yr by 2055 (HVAC capex compounding) — expect insurance premiums to compound above CPI over the hold.
Questions for the listing agent
- What do current leases actually rent for vs. the listed asking? Can we see a recent rent roll and the last 12 months of T-12 income?
- It's been on market 61 days. Have you received any prior offers? Is the seller open to a 14% concession, seller financing, or rate buy-down credit?
- Built in 1940 — when were the roof, HVAC, electrical panel, plumbing, and water heater last replaced?
- Why hasn't it sold? Are there any deal-killer items the seller is aware of (foundation, flood, title, zoning, code violations)?
- Is there a deadline driving the sale (1031 exchange, divorce, estate, relocation)? That informs how much negotiation room exists.
- Schools are D-rated, which usually means shorter tenancies and higher turnover. Who's the typical renter profile here, and what's been the actual vacancy rate?
- Crime grade is F in this area — have there been break-ins, vandalism, or insurance claims at this property in the last 3 years? What carrier currently insures it and at what premium?
- The area grade is low — what's the realistic commute time and amenity access for the typical tenant pool here? Any planned neighborhood developments (good or bad) we should know about?
- What's the average days-on-market for RENTAL listings here right now (not sales)? A rising rental-DOM trend means longer vacancies and softer asking-rent achievability than the comps imply.
- What's the recent tenant-quality profile in this submarket — average credit score on applications, eviction rate, late-payment / NSF rate, and stable-employment percentage? A property-management company in the area should have these aggregated.
- How much new for-sale + rental construction is in the pipeline within 1–3 miles? Heavy new supply typically softens prices + rents 12–24 months out; constrained supply supports both.
Investment metrics
- 1% rule
- 0.86% ✗
- Cap rate
- 5.71%
- Cash-on-cash
- -2.08%
- DSCR
- 0.91
- GRM
- 9.7
CMA / ARV
- ARV (median comp)
- $269,226
- List price
- $190,000
- Delta
- -29.43%
- Verdict
- UNDERPRICED
- Comps
- 20 within 1.0 mi
Show comp detail 12 sales within ~0.75 mi
| Address | Dist | Beds/Ba | Sqft | Sold | Price | $/sf | Match |
|---|---|---|---|---|---|---|---|
| 5105 Terry St | 0.16mi | 3/2.0 | 1,152 (-2%) | 19mo | $299,000 | $260 | 70 |
| 1506 Amundsen St | 0.30mi | 3/2.0 | 1,112 (-5%) | 5mo | $295,000 | $265 | 70 |
| 1509 Moody St | 0.06mi | 3/1.0 | 1,280 (+9%) | 16mo | $129,000 | $101 | 68 |
| 1410 Caplin St | 0.74mi | 3/1.0 | 1,209 (+3%) | 0mo | $154,000 | $127 | 60 |
| 2719 Milwaukee St | 0.62mi | 3/3.0 | 1,148 (-2%) | 2mo | $215,000 | $187 | 58 |
| 5106 Hardy St | 0.10mi | 3/2.0 | 1,343 (+15%) | 11mo | $325,000 | $242 | 58 |
| 4802 Chapman St | 0.17mi | 4/1.0 (+1) | 1,305 (+11%) | 18mo | $149,000 | $114 | 53 |
| 4600 Terry St | 0.23mi | 2/1.0 (-1) | 1,008 (-14%) | 17mo | $214,900 | $213 | 47 |
| 5710 Cherry St | 0.60mi | 2/1.0 (-1) | 1,039 (-11%) | 1mo | $159,000 | $153 | 47 |
| 5619 Chapman St | 0.46mi | 3/1.0 | 1,020 (-13%) | 17mo | $167,000 | $164 | 43 |
| 702 Sue St | 0.67mi | 3/2.0 | 1,302 (+11%) | 11mo | $499,000 | $383 | 37 |
| 5610 Chapman St | 0.45mi | 2/2.0 (-1) | 1,013 (-14%) | 14mo | $350,000 | $346 | 36 |
Match score weights: distance 35% · size 25% · config 20% · recency 20%. Top-matched comps best support the ARV.
Projected returns pro-forma
-3.0% appreciation · 0.84% rent growth · sell at horizon
- IRR
- -22.3%
- Equity multiple
- 0.25×
- Total profit
- $-40,055
- Equity at exit
- $28,330
- IRR
- -23.2%
- Equity multiple
- -0.05×
- Total profit
- $-55,791
- Equity at exit
- $16,428
Cash invested: $53,200 (down + closing). Projections, not guarantees.
Landlord ↔ Tenant lean methodology
- Overall (STATE)
- 87 Strongly Landlord-Friendly
- State Texas
- 87 Strongly Landlord-Friendly · R+5
- County
- — inherits STATE
- City
- — inherits STATE
ZIP-level market 77009
- Rents YoY
- 0.8%
- Active inventory
- 605
- Price-to-rent
- 9.7×
Monthly cashflow live
- Estimated rent
- $1,630 high interval (Pro) →
- Mortgage (P&I)
- −$996
- Tax from tax record
- −$304 /mo · $3,649/yr
- Insurance
- −$79
- HOA
- −$0
- Vacancy / Maint / Mgmt
- −$342
- Net cashflow
- $-92
Break-even live
Sensitivity live
| Price | -10% $15 | -5% $-38 | +0% $-92 | +5% $-146 | +10% $-200 |
|---|---|---|---|---|---|
| Rent | -10% $-221 | -5% $-156 | +0% $-92 | +5% $-28 | +10% $37 |
| Rate | -1.0pp $4 | -0.5pp $-44 | base $-92 | +0.5pp $-141 | +1.0pp $-191 |
UW: 25.0% down · 7.5% · 30yr · 1.5% tax · 5.0% vac · 8.0% maint · 8.0% mgmt
Financing live
Cash to close
- Down payment
- $47,500
- Closing costs
- $5,700
- Reserves months
- —
- Total cash needed
- —
Loan-product check · same deal, 3 products live
Conventional
25% down · 7.5% · 30yr
- Down + closing
- —
- Monthly P&I
- —
- Monthly cashflow
- —
- DSCR
- —
- Eligible?
- —
Personal DTI + credit; lowest rate.
DSCR
20% down · 8.5% · 30yr
- Down + closing
- —
- Monthly P&I
- —
- Monthly cashflow
- —
- DSCR
- —
- Eligible?
- —
No personal income docs; deal must DSCR.
Hard money
10% down · 12.0% · 12mo
- Down + closing
- —
- Monthly P&I
- —
- Monthly cashflow
- —
- DSCR
- —
- Eligible?
- —
Short-term bridge; refi at stabilization.
Rent comps 16 comps
| Address | Beds | Baths | Sqft | Rent | $/sqft | DOM | Units | Dist |
|---|---|---|---|---|---|---|---|---|
| 2516 Ivy St Houston, TX | 3.0 | 1.0 | 1200 | $1,500 | $1.25 | 45d | 1 | 0.36mi |
| 2110 Melbourne St Unit 3 Houston, TX | 2.0 | 1.0 | 825 | $1,350 | $1.64 | 26d | 1 | 0.84mi |
| 914 Bunton St Houston, TX | 3.0 | 2.0 | 1389 | $1,950 | $1.40 | 45d | 1 | 0.86mi |
| 6869 Arto St Houston, TX | 1.0–2.0 | 1.0 | 900 | $950 | $1.06 | 19d | 6 | 1.10mi |
| 3107 Melbourne St Houston, TX | 3.0 | 1.0 | 956 | $1,500 | $1.57 | 45d | 1 | 1.12mi |
| 4711 Sayers St Unit A Houston, TX | 2.0 | 1.0 | 1200 | $1,650 | $1.38 | 45d | 1 | 1.22mi |
| 6918 Irvington Blvd Houston, TX | 2.0 | 2.0 | 1100 | $1,550 | $1.41 | 45d | 1 | 1.32mi |
| 4111 Cavalcade St Unit 5 Houston, TX | 2.0 | 1.0 | 757 | $825 | $1.09 | 45d | 1 | 1.34mi |
| 1007 Archer St Houston, TX | 2.0 | 1.0 | 1008 | $1,923 | $1.91 | 4d | 1 | 1.36mi |
| 1209 Cordell St Houston, TX | 2.0 | 2.0 | 990 | $2,200 | $2.22 | 0d | 1 | 1.39mi |
| 207 Lindale St Unit 1316403P Houston, TX | 2.0 | 1.0 | 1119 | $3,187 | $2.85 | 1d | 1 | 1.42mi |
| 1617 Enid St Houston, TX | 1.0–2.0 | 1.0–2.0 | 974 | $2,417 | $2.48 | 0d | 53 | 1.45mi |
| 7301 Jensen Dr Unit 50 Houston, TX | 2.0 | 1.0 | 880 | $999 | $1.14 | 9d | 1 | 1.48mi |
| 7301 Jensen Dr Apt 12 Houston, TX | 2.0 | 1.0 | 880 | $930 | $1.06 | 9d | 1 | 1.48mi |
| 4203 Hirsch Rd Unit 13 Houston, TX | 2.0 | 1.0 | 758 | $975 | $1.29 | 1d | 1 | 1.48mi |
| 4203 Hirsch Rd Unit 5 Houston, TX | 2.0 | 1.0 | 758 | $950 | $1.25 | 45d | 1 | 1.49mi |
Listing history 35 events
-
2026-06-21days on market $190,000 Active 61 DOM
-
2026-06-18days on market $190,000 Active 58 DOM
-
2026-06-17days on market $190,000 Active 57 DOM
-
2026-06-16days on market $190,000 Active 56 DOM
-
2026-06-15days on market $190,000 Active 55 DOM
-
2026-06-13days on market $190,000 Active 53 DOM
-
2026-06-10days on market $190,000 Active 49 DOM
-
2026-06-08days on market $190,000 Active 48 DOM
-
2026-06-07days on market $190,000 Active 47 DOM
-
2026-06-04days on market $190,000 Active 44 DOM
-
2026-06-01days on market $190,000 Active 41 DOM
-
2026-05-31days on market $190,000 Active 40 DOM
-
2026-04-22$190,000 Active 262-char remark
-
2026-04-18historical $190,000 262-char remark
-
2026-01-31historical
-
2026-01-01status Active
-
2025-12-31historical
-
2025-10-13$190,000 Active
-
2025-03-31historical
-
2025-03-05status Active
-
2025-02-28historical
-
2024-11-06$190,000 Active
-
2024-10-31historical
-
2024-09-04price $200,000
-
2024-09-04status Active
-
2024-08-31historical
-
2024-08-03price $210,000
-
2024-08-03status Active
-
2024-07-31historical
-
2024-04-27$215,000 Active
-
2024-03-31historical
-
2023-12-01$225,000 Active
-
2023-05-23historical
-
2023-05-06$225,000 Active
-
2000-09-28soldstatus
ⓘ Source: listings_history table (triggers on properties + properties_extension) + one-shot
backfill from property_details.listing_events for pre-trigger history.
Tax reassessment forecast TX · Resets to sale price
- Current annual tax
- $3,649 · $304/mo
- Projected year-2 tax
- $3,649 · $304/mo
- Expected delta
- $0/yr ($0/mo · 0.0%)
ⓘ Screening estimate from a state-policy table — verify with the county assessor before closing.
Climate risk First Street
- Flood 6/10 Major FEMA zone X (unshaded) · 73% chance over 30 yrs
- Wildfire 1/10 Low
- Heat 9/10 Extreme 7 d/yr ≥109°F today · 24 d/yr by 30 yrs out
- Wind 9/10 Extreme 99% chance of damaging wind over 30 yrs
- Air quality 3/10 Moderate 2 unhealthy d/yr today · 3 by 30 yrs out
Nearby sold comps map
Loading sold comps map…
Walkable amenities ~0.75 mi
Loading nearby amenities…
Taxation est. · year 1
- Rental income
- $19,557
- − Mortgage interest
- −$10,643
- − Property taxes
- −$3,649
- − Insurance
- −$950
- − Repairs & maintenance
- −$1,565
- − Management
- −$1,565
- − Depreciation
- −$5,527
- Taxable loss
- −$4,341
- Est. tax savings @ 24.0%
- +$1,042
- After-tax cash flow
- $-63/yr
For passive investors: Depreciation is non-cash, so a rental often shows a tax loss while cash-flowing — sheltering income. Rental losses are passive: they offset passive income freely, and up to $25,000/yr can offset ordinary (W-2) income if you actively participate and your MAGI is under $100k (phasing out to $0 by $150k); unused losses carry forward. On sale, claimed depreciation is recaptured at up to 25%, and gains may owe capital-gains tax (a 1031 exchange can defer both). Figures are a year-1 estimate at your 24.0% rate — not tax advice; consult a CPA.
Schools (NCES district)
- District
- Houston ISD
- NCES district ID
- 4823640
- Math proficiency
- 27% ▼ -18.00%
- Reading proficiency
- 35% ▼ -6.00%
- Median HH income
- $46,054
- Composite
- 26.63/100
- National rank
- #7173
- State rank
- #593 of 826 in TX
Livability — Houston
- Score
- 74/100
- State rank
- #184
- US rank
- #4771
Category grades
Schools grade is shown separately in the Schools card above.
Census & demographics
- Census place
- Houston, TX
- County
- Harris County · 4,702,590 people
- City population
- 3,226,434
- Metro
- Houston-The Woodlands-Sugar Land, TX
- Population (ZIP)
- 35,769
- Household income
- $83,148
- Rent vs Own
- Severe rent burden
- 994.0
Population outlook (Harris County) Hauer SSP2
- Today (2025)
- 5,571,493 people
- By 2030
- 6,089,821 · +9.3%
- By 2040
- 7,142,806 · +28.2%
- By 2050
- 8,185,864 · +46.9%
- By 2075
- 10,574,329 · +89.8%
- By 2100
- 12,109,958 · +117.4%
Race, ethnicity, and origin ACS 2023
- Neighborhood character
- Diverse neighborhood (Simpson 0.60)
- Race & ethnicity
- Hispanic / Latino 53% White 33% Two or more races 22% Black 8% Asian 3%
- Hispanic origin (detail)
- Mexican 46%
- Common ancestry
- Italian 2% Lithuanian 2% Slovak 1%
- Foreign-born
- 20% · Canada
- Languages at home
- 55% English-only · Spanish 40% Other Indo-European 2% Other Asian/Pacific 1%
Political lean MEDSL · Harris
- 2024 margin
- Lean D (+5.5) · D 52.0% · R 46.4% · Other 1.6%
- 2008→2024 swing
- +3.9pp toward D · 2008: 1.6pp · 2024: 5.5pp
- All cycles
- 2024: D+5.5 2020: D+13.3 2016: D+12.4 2012: D+0.1 2008: D+1.6
Not yet ingested
- Civics
- —
Market trends
- HPI YoY
- ▼ -533.57%
- Current HPI
- 219.5037
- Rent YoY
- ▲ 0.84%
- Metro
- Houston-The Woodlands-Sugar Land, TX
- State GDP YoY
- ▲ 3.95%
- F500 in state
- 110
Industry mix (Fortune 500 HQ in TX)
| Industry | F500 HQs | Revenue |
|---|---|---|
| Energy | 16 | $1,198B |
|
||
| Technology | 5 | $198B |
|
||
| Engineering / Construction | 4 | $72B |
|
||
| Energy Services | 3 | $60B |
|
||
| Utilities | 3 | $41B |
|
||
| Healthcare | 2 | $330B |
|
||
Price history
-15.6% since first listed23 events — show timeline
- 2026-04-22 Listed $190,000 HARMLS
- 2026-04-18 Coming Soon $190,000 HARMLS
- 2026-01-31 Listing Removed — HARMLS
- 2026-01-01 Relisted — HARMLS
- 2025-12-31 Listing Removed — HARMLS
- 2025-10-13 Listed $190,000 HARMLS
- 2025-03-31 Listing Removed — HARMLS
- 2025-03-05 Relisted — HARMLS
- 2025-02-28 Listing Removed — HARMLS
- 2024-11-06 Listed $190,000 HARMLS
- 2024-10-31 Listing Removed — HARMLS
- 2024-09-04 Price Changed $200,000 HARMLS
- 2024-09-04 Relisted — HARMLS
- 2024-08-31 Listing Removed — HARMLS
- 2024-08-03 Price Changed $210,000 HARMLS
- 2024-08-03 Relisted — HARMLS
- 2024-07-31 Listing Removed — HARMLS
- 2024-04-27 Listed $215,000 HARMLS
- 2024-03-31 Listing Removed — HARMLS
- 2023-12-01 Listed $225,000 HARMLS
- 2023-05-23 Listing Removed — HARMLS
- 2023-05-06 Listed $225,000 HARMLS
- 2000-09-28 Sold (Public Records) — Public Records
Property tax history
+4.9%/yrLatest (2025): $3,649 · +11.7% YoY. Source: county tax records.
Cash-flow waterfall
monthlySold comps — $/sqft
last 12 mo · ≤1 miLoading sold comps…